"Ether Plunges 5.5% as RSI Hits Oversold 14 – What’s Next?"
· Crypto · QuoteReporter
"Ether Plunges 5.5% as RSI Hits Oversold 14 – What’s Next?"
Ethereum (ETH/USD) | June 05, 2026 $1,672.5800 -5.48%
🔍 Technical Analysis
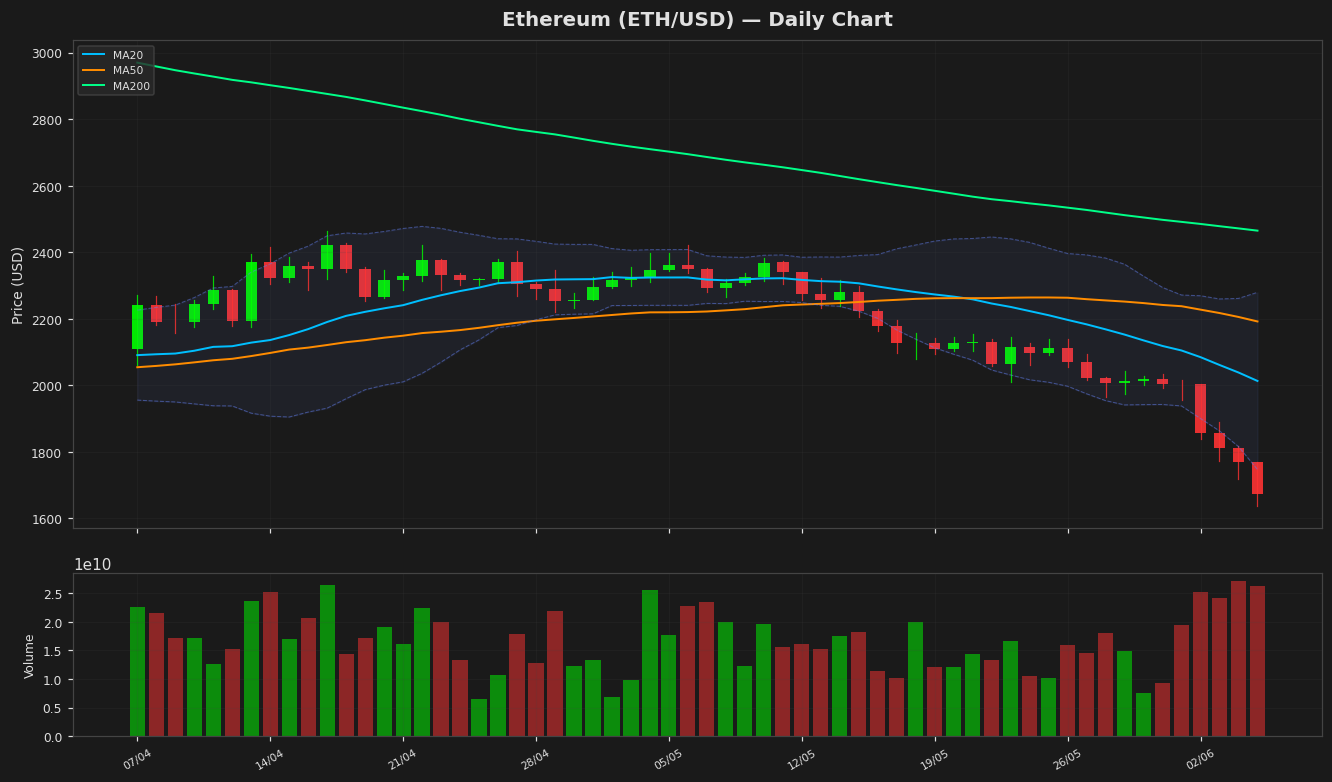
Ethereum (ETH) is currently trading at $1,672.58, reflecting a sharp daily decline of 5.48%. The price action shows ETH struggling below key moving averages, signaling bearish momentum. The MA20 at $2,013.28 and MA50 at $2,192.02 both act as resistance levels, while the MA200 at $2,464.88 further underscores the long-term downtrend. The Bollinger Bands highlight heightened volatility, with the upper band at $2,279.45 and the lower band at $1,747.12. The price hovering near the lower band suggests potential oversold conditions, but a breakout below could intensify selling pressure.
The RSI at 14.05 indicates extreme oversold territory, which may precede a short-term bounce or consolidation. However, the MACD at -115.65, below its signal line at -82.87, reinforces bearish momentum. The ATR(14) of 84.78 confirms elevated volatility, with ETH testing critical support near $1,636.86 (52W low). A breach below this level could trigger further downside toward $1,500.
Key resistance levels to watch are $1,800 (psychological barrier) and $2,013 (MA20). The 52W high of $4,755.22 and YTD high of $3,397.89 remain distant targets, requiring a significant bullish reversal. Until ETH reclaims the MA20, the bearish trend persists, with traders monitoring oversold RSI for potential reversals or continuation patterns.
Technical Metrics
| Metric | Value |
|---|---|
| Current Price | $1,672.5800 |
| Daily Change | -5.48% |
| MA 20 | $2,013.2845 |
| % from MA20 | -16.92% |
| MA 50 | $2,192.0151 |
| % from MA50 | -23.70% |
| MA 200 | $2,464.8833 |
| % from MA200 | -32.14% |
| BB Upper | $2,279.4475 |
| % from BB Upper | -26.62% |
| BB Lower | $1,747.1215 |
| % from BB Lower | -4.27% |
| RSI (14) | 14.05 |
| MACD | -115.652170 |
| MACD Signal | -82.873660 |
| ATR (14) | 84.781154 |
| 3-Day High | $1,889.0588 |
| 3-Day Low | $1,636.8589 |
| 52-Week High | $4,755.2202 |
| % from 52W High | -64.83% |
| 52-Week Low | $1,636.8589 |
| % from 52W Low | +2.18% |
| YTD High | $3,397.8977 |
| % from YTD High | -50.78% |
| YTD Low | $1,636.8589 |
| % from YTD Low | +2.18% |
📊 Market Commentary
Ethereum (ETH) has faced significant downward pressure today, dropping 5.48% to $1,672.58, nearing the lower end of its 52-week range ($1,636.86 – $4,755.22). The Relative Strength Index (RSI) sits at an extremely oversold level of 14.0, signaling intense selling momentum but also raising the possibility of a short-term bounce if bearish exhaustion sets in. Market sentiment remains cautious as macroeconomic uncertainties, including Fed policy and recession fears, continue to weigh on risk assets.
Traders are closely monitoring the $1,636 support level, which represents the yearly low. A sustained break below this threshold could trigger further downside, while a hold may prompt consolidation or a relief rally. On the upside, resistance is seen near $1,800, a psychological level that previously acted as support. The broader crypto market’s correlation with equities remains high, meaning ETH’s near-term direction may hinge on traditional market movements.
Volume has spiked during the sell-off, indicating strong capitulation. Derivatives data shows elevated funding rates for short positions, suggesting crowded bearish bets that could unwind sharply if conditions reverse. While ETH’s oversold RSI hints at potential near-term stabilization, traders remain wary until broader market sentiment improves. Key factors to watch include Bitcoin’s price action, macroeconomic developments, and Ethereum network activity, particularly gas fees and adoption metrics post-Merge. For now, ETH remains in a defensive stance as traders await clearer signals.
Disclaimer
The content on MarketsFN.com is provided for educational and informational purposes only. It does not constitute financial advice or investment recommendations. All investments involve risk. Cryptocurrency markets are highly volatile. Past performance does not guarantee future results.