Ethereum Dips, Ripple Slides, Tron Surges: Crypto Market Update
· Crypto · QuoteReporter
Ethereum Dips, Ripple Slides, Tron Surges: Crypto Market Update
Crypto Market Report | August 04, 2026
📊 Crypto Market Overview
The cryptocurrency market is currently experiencing a mixed sentiment, with Bitcoin (BTC) trading at $63,551.96, reflecting a slight increase of 0.11% today. Despite this modest uptick, Bitcoin's Relative Strength Index (RSI) is at 41.8, indicating a neutral to slightly bearish momentum, while the Moving Average Convergence Divergence (MACD) stands at -112.52, suggesting a potential weakening trend. Ethereum (ETH) has seen a decline of 1.29%, currently priced at $1,858.28, with an RSI of 44.9 and a positive MACD of 21.03, indicating some bullish potential despite the day's losses.
Ripple (XRP) and Solana (SOL) are also facing downward pressure, with XRP down 0.95% and SOL down 0.12%. Both have RSI values below 45, signaling oversold conditions. Conversely, Binance Coin (BNB) is one of the key movers today, gaining 0.24% and maintaining a healthier RSI of 60.3, which reflects stronger buying momentum. Tron (TRX) is also performing positively, up 0.89%, with an RSI of 54.9, indicating a balanced market position.
In the macro context, recent headlines have influenced market dynamics. Notably, Nigeria's new crypto tax regulations and Apple's temporary removal of Telegram from its App Store have drawn attention. Additionally, the ongoing enforcement actions by the CFTC highlight regulatory scrutiny in the sector. The technical landscape shows that many cryptocurrencies are hovering near critical support levels, which could shape their short-term trajectories. The overall market remains cautious, with traders closely monitoring regulatory developments and macroeconomic indicators that could impact sentiment and trading volumes in the coming days.
Ripple (XRP) and Solana (SOL) are also facing downward pressure, with XRP down 0.95% and SOL down 0.12%. Both have RSI values below 45, signaling oversold conditions. Conversely, Binance Coin (BNB) is one of the key movers today, gaining 0.24% and maintaining a healthier RSI of 60.3, which reflects stronger buying momentum. Tron (TRX) is also performing positively, up 0.89%, with an RSI of 54.9, indicating a balanced market position.
In the macro context, recent headlines have influenced market dynamics. Notably, Nigeria's new crypto tax regulations and Apple's temporary removal of Telegram from its App Store have drawn attention. Additionally, the ongoing enforcement actions by the CFTC highlight regulatory scrutiny in the sector. The technical landscape shows that many cryptocurrencies are hovering near critical support levels, which could shape their short-term trajectories. The overall market remains cautious, with traders closely monitoring regulatory developments and macroeconomic indicators that could impact sentiment and trading volumes in the coming days.
📰 Crypto News
- Apple briefly removes Telegram from App Store, Gram rebounds
- NY judge denies CFTC motion to halt enforcement action against Kalshi
- Nigeria sets crypto tax collection rules for digital asset platforms
- Here’s what happened in crypto today
- Crypto firms still seeking frontier AI access; only select few have it
- Coldcard Bitcoin theft tops $100M across 3 confirmed attack waves: Galaxy
- Bitmine adds $19.6M in ETH, repurchases 4.5M shares
- Mastercard completes $1.8B BVNK acquisition in stablecoin push
- Malaysia Blockchain Week’s OnlyFans scandal, lonely heart scammed for $3.3M: Asia Express
- Caleb & Brown expands to UK, betting on untapped crypto demand
- Boltz pauses service after wave of AI-assisted hacking attempts
- Bhutan's GMC puts part of its bitcoin treasury to work after 10,000 BTC pledge
- Why Jim Cramer’s quantum panic isn’t rattling bitcoin as price holds steady around $64,000
- XRP holders can now borrow RLUSD on Ethereum through $280 million lending pool
- A new Solana proposal aims to ramp up daily SOL Burns from $47,000 to $650,000
🔍 Technical Analysis
Bitcoin (BTC) — +0.11%
$63,551.96 52W: $57,747.77 — $97,860.60
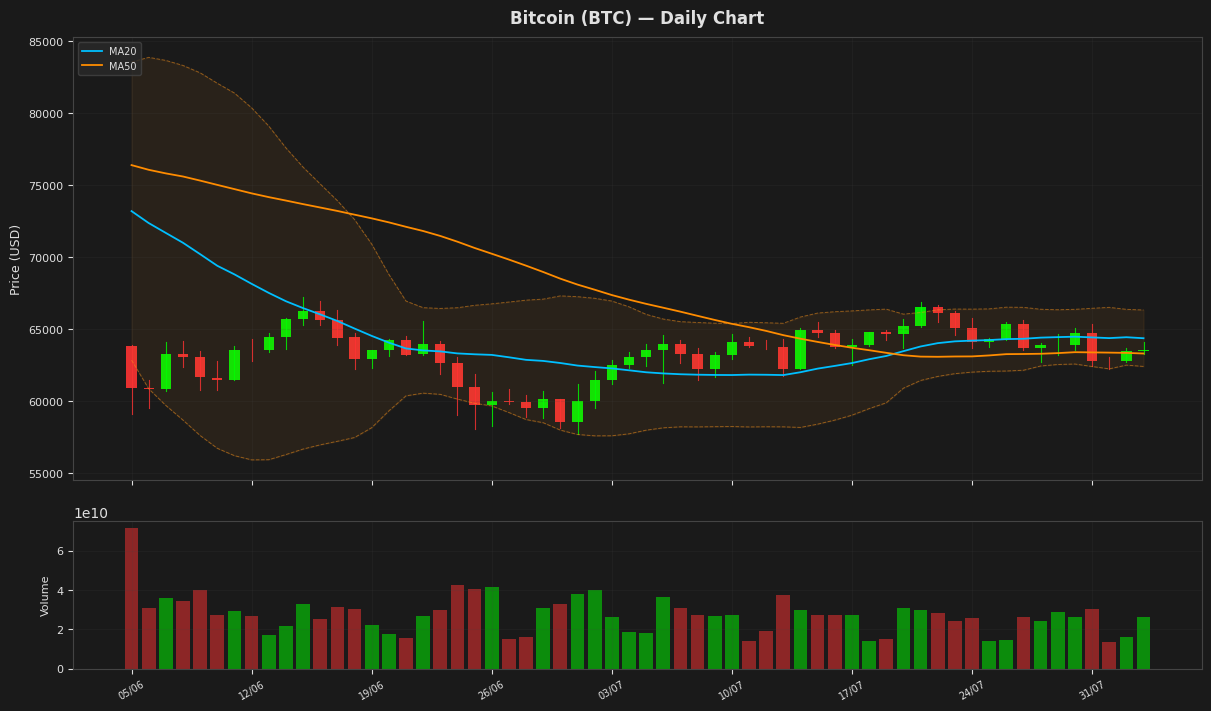
Bitcoin is currently trading at $63,551.96, showing a slight daily increase of 0.11%. The price is above the 20-day moving average (MA20) of $64,368.03 but below the 50-day moving average (MA50) of $63,308.04, indicating a potential consolidation phase. The RSI at 41.85 suggests that Bitcoin is approaching oversold conditions, while the MACD remains negative, indicating bearish momentum. The Bollinger Bands show a range between $62,410.91 and $66,325.16, suggesting limited volatility in the near term.
Ethereum (ETH) — -1.29%
$1,858.28 52W: $1,506.51 — $3,446.62
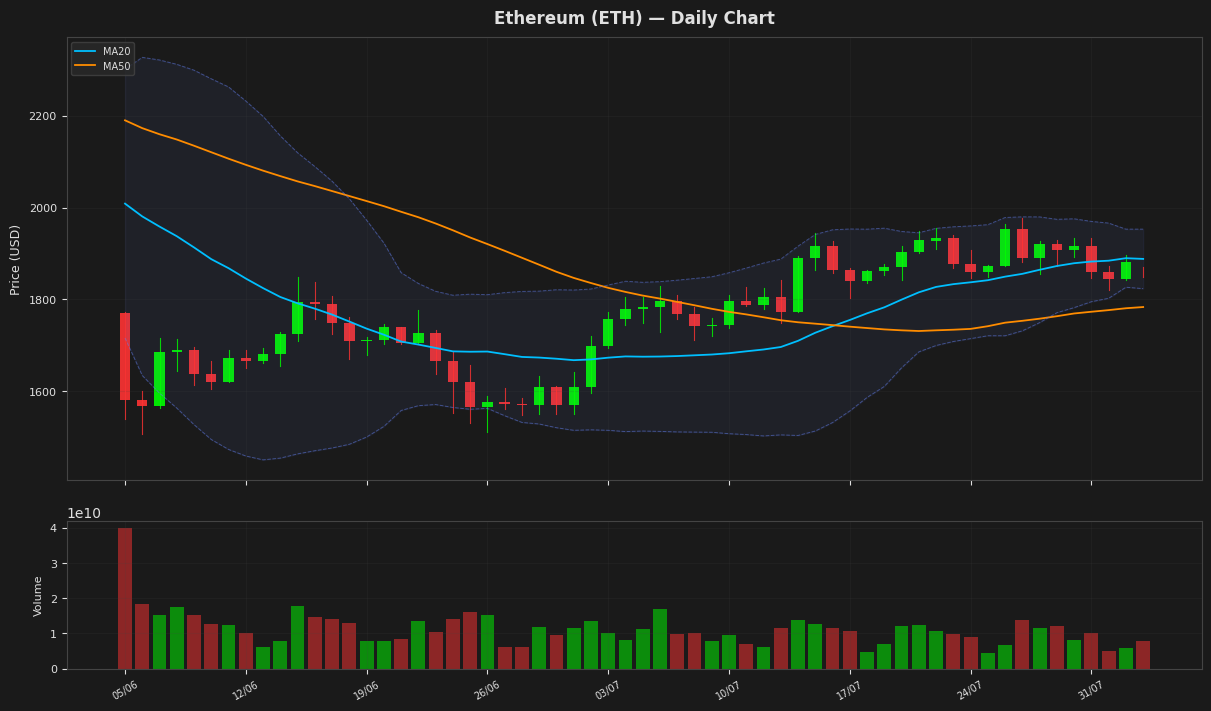
Ethereum is currently trading at $1,858.28, reflecting a daily decline of 1.29%. The price is positioned below the 20-day moving average of $1,888.23, suggesting bearish momentum, while the RSI of 44.90 indicates that ETH is nearing oversold conditions. The Bollinger Bands show potential support at the lower band of $1,823.41, while the MACD indicates a weakening bullish trend. Overall, Ethereum appears to be consolidating within a range, with critical support and resistance levels to monitor.
Ripple (XRP) — -0.95%
$1.0743 52W: $1.0098 — $2.4103
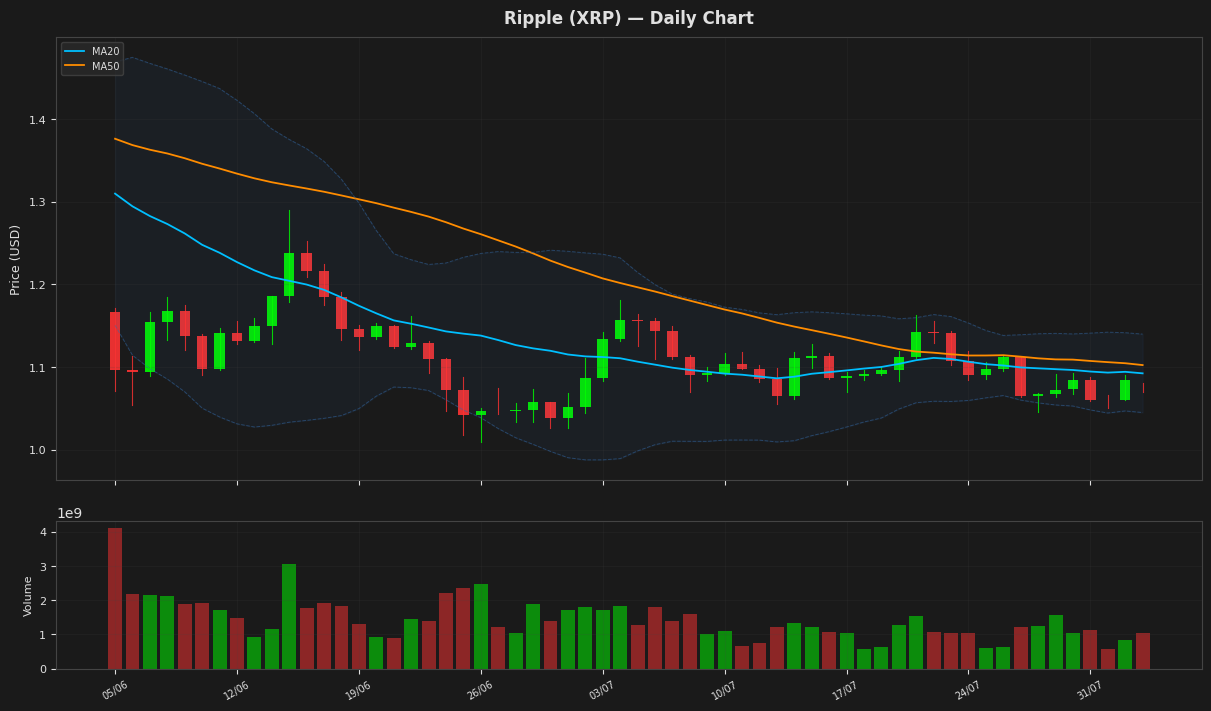
Ripple (XRP) is currently trading at $1.074300, reflecting a daily decline of 0.95%. The price is below both the 20-day and 50-day moving averages, which are at 1.092393 and 1.102384, respectively, indicating a bearish short-term trend. The RSI is at 41.67, suggesting that XRP is approaching oversold conditions, while the MACD remains negative, further confirming the lack of upward momentum. With Bollinger Bands indicating a range between 1.045013 and 1.139774, XRP appears to be consolidating within this band, potentially setting the stage for a breakout or breakdown.
Solana (SOL) — -0.12%
$73.3600 52W: $60.4147 — $148.2160
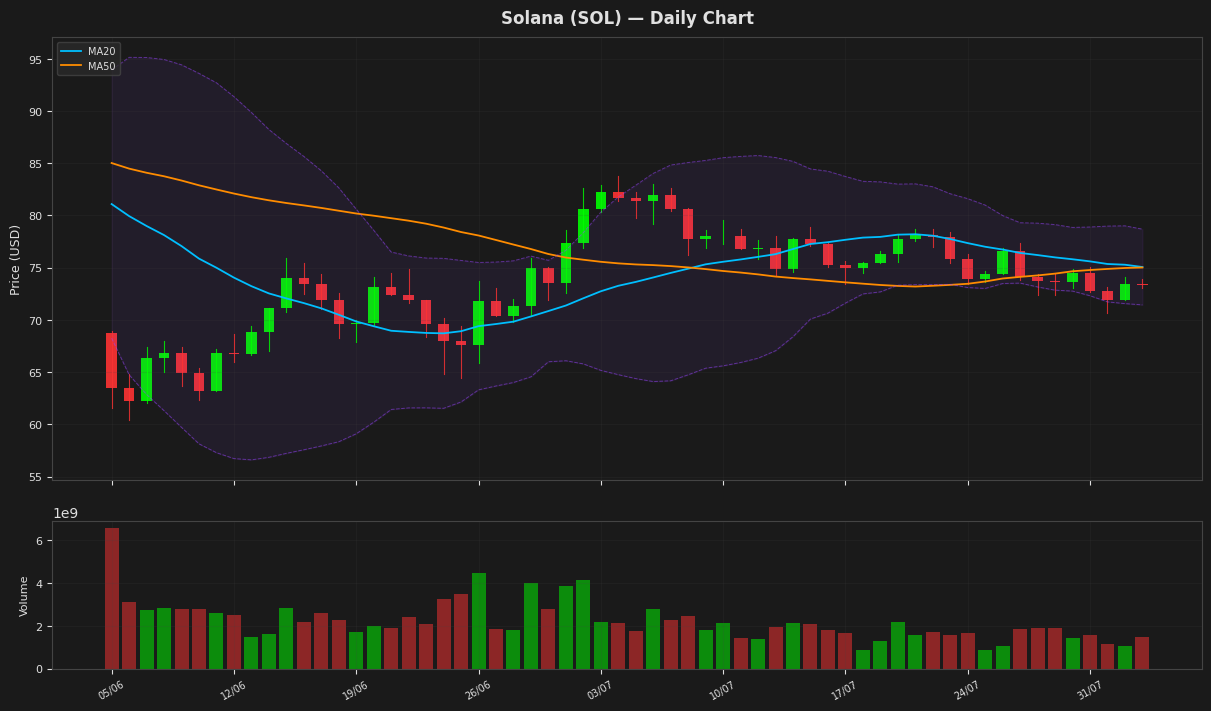
Solana is currently trading at $73.36, reflecting a slight daily decrease of 0.12%. The price is below both the 20-day moving average (MA20) of 75.07 and the 50-day moving average (MA50) of 75.02, indicating a bearish trend. The Relative Strength Index (RSI) at 35.63 suggests that the asset is approaching oversold conditions, while the MACD shows a negative divergence, reinforcing the bearish sentiment. With the Bollinger Bands indicating a range between 71.44 and 78.69, Solana may face resistance near the upper band if it attempts a recovery.
BNB (BNB) — +0.24%
$588.9900 52W: $538.5992 — $954.8583
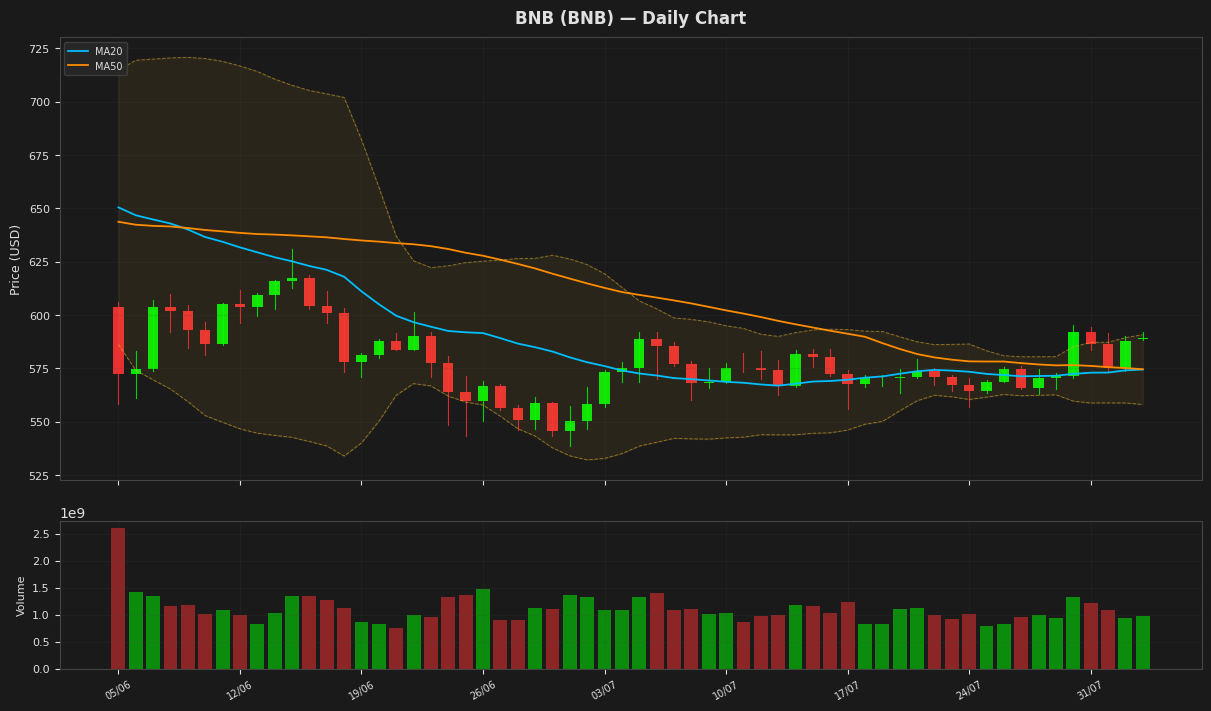
BNB is currently trading at $588.99, reflecting a slight daily increase of 0.24%. The price is above both the 20-day and 50-day moving averages, which are at $574.38 and $574.54, indicating a bullish trend. The RSI is at 60.32, suggesting that BNB is approaching overbought territory, while the MACD shows a positive momentum with a value of 2.31. The Bollinger Bands indicate potential resistance at $590.76 and support at $558.00, providing a range for short-term price movements.
Tron (TRX) — +0.89%
$0.329297 52W: $0.268138 — $0.376332
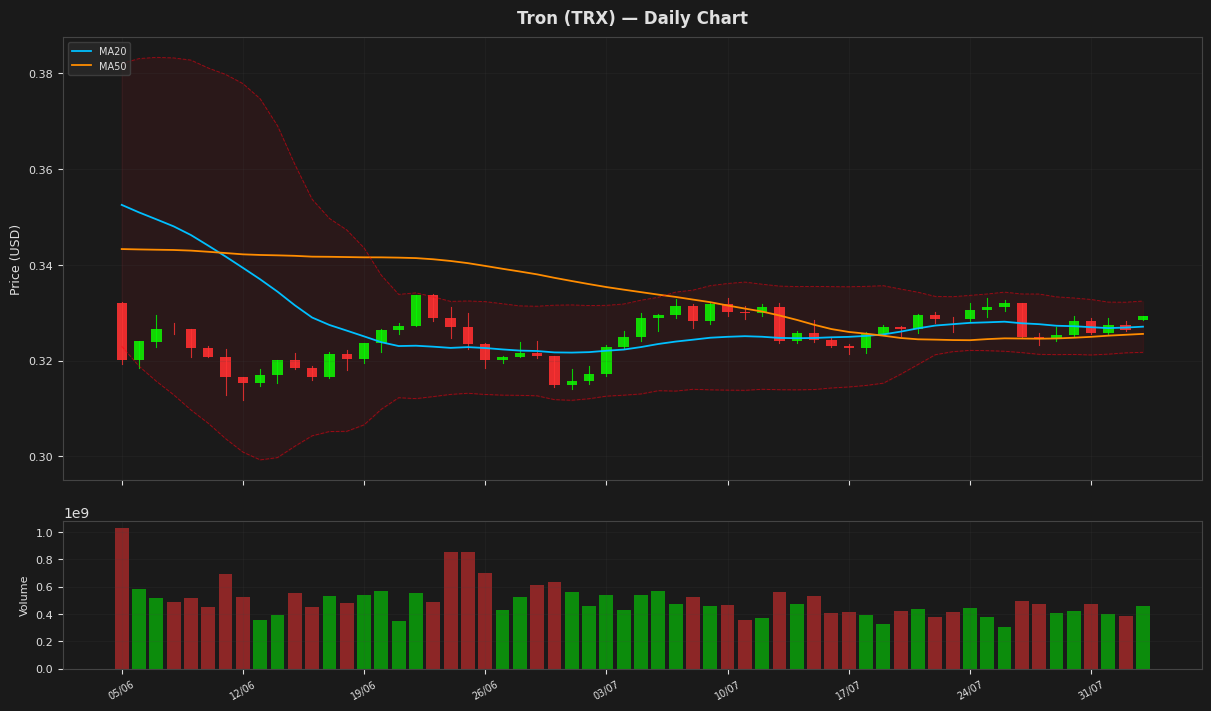
Tron (TRX) is currently trading at $0.329297, reflecting a daily increase of 0.89%. The price is above the 20-day moving average of 0.327094 and the 50-day moving average of 0.325587, indicating a potential bullish trend. The RSI is at 54.90, suggesting that TRX is neither overbought nor oversold, while the MACD is slightly positive, indicating potential upward momentum. With the price approaching the upper Bollinger Band at 0.33245, a breakout above this level could signal further gains.
Dogecoin (DOGE) — -0.81%
$0.070110 52W: $0.067973 — $0.156602
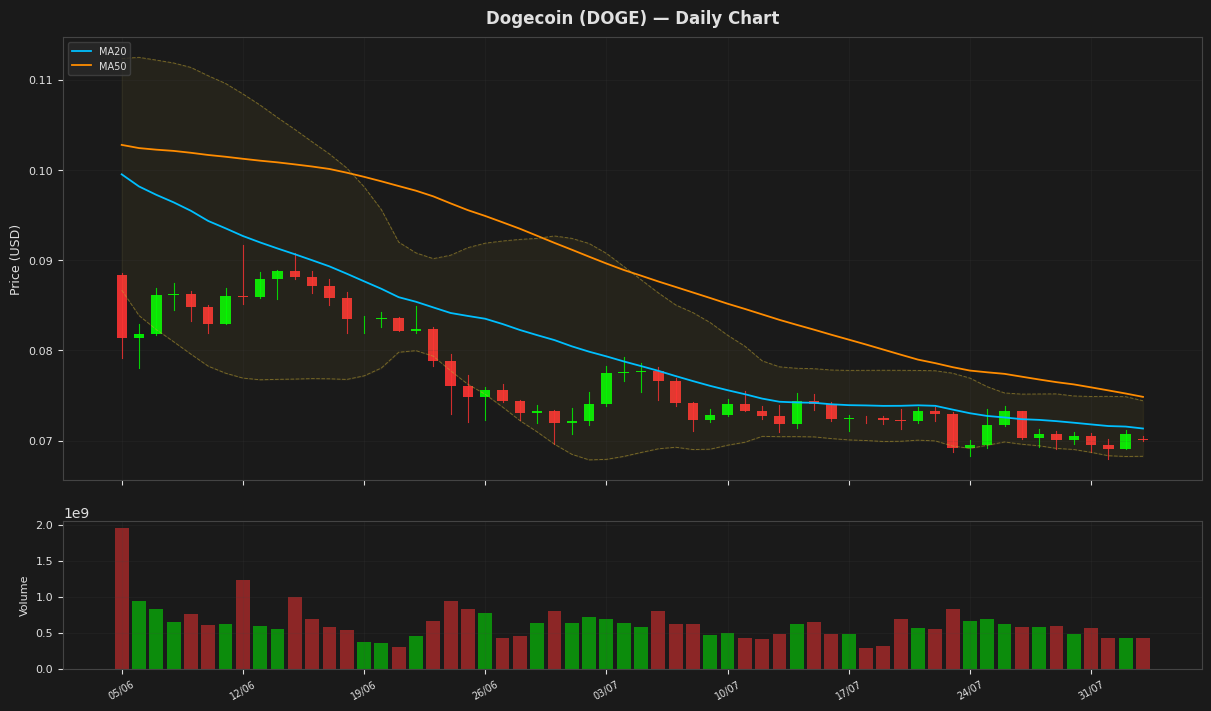
Dogecoin is currently trading at $0.070110, reflecting a daily decrease of 0.81%. The price is below both the 20-day moving average (MA20) of 0.071338 and the 50-day moving average (MA50) of 0.074846, indicating a bearish trend. The RSI is at 44.25, suggesting that the asset is nearing oversold conditions, while the MACD is slightly negative, further confirming the lack of bullish momentum. With the price hovering close to the lower Bollinger Band at 0.06826, a potential support level may be tested if selling pressure continues.
Disclaimer
The content on MarketsFN.com is provided for educational and informational purposes only. It does not constitute financial advice or investment recommendations. All investments involve risk. Past performance does not guarantee future results.