Gold: Down 1.2% to $4505.50 — Testing 50.0% Fibonacci Support
· Commodities · QuoteReporter
Gold: Down 1.2% to $4505.50 — Testing 50.0% Fibonacci Support
Analysis Date: June 01, 2026
📊 Current Market Data
CURRENT PRICE
$4505.50
DAILY CHANGE
-1.21%
WEEKLY CHANGE
-0.34%
52W HIGH
$5586.20
52W LOW
$3253.80
💡 Key Market Factors
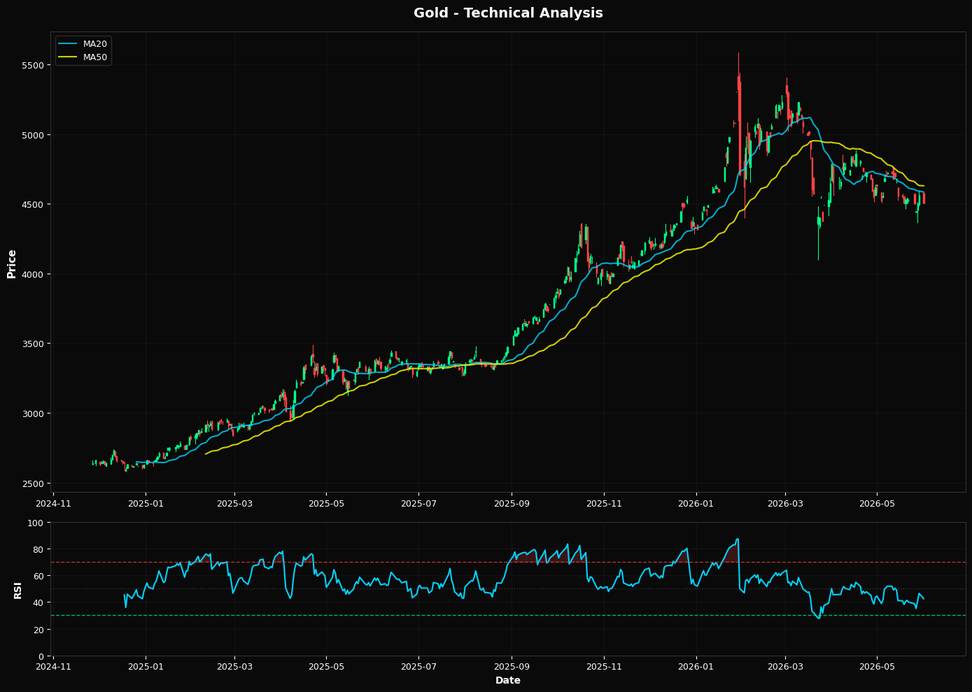
**Gold's Technical Weakness Signals Further Downside Potential Amidst Fed Uncertainty** Gold's current technical setup suggests a bearish outlook, with the price at $4505.50, down 1.21% daily and 0.34% weekly, indicating persistent selling pressure. The Relative Strength Index (RSI) at 42.5 is below the neutral 50 mark, suggesting that momentum is skewed towards the downside. The price is also trading below both the 20-day moving average ($4583.47) and the 50-day moving average ($4628.37), reinforcing a short-term bearish trend. However, it remains above the 200-day moving average ($4376.58), which could act as a longer-term support. The nearest Fibonacci support at the 50.0% retracement level of $4420.00 is crucial; a breach below this could accelerate the decline towards the 200-day moving average. In the current macroeconomic environment, the Federal Reserve's interest rate policy is the most significant driver for gold. With inflationary pressures persisting, the Fed's stance on interest rates remains a critical factor. Higher rates typically strengthen the U.S. dollar, making gold less attractive as it is priced in dollars and yields no interest. The market may be underestimating the Fed's resolve to keep rates elevated to combat inflation, which could further pressure gold prices. The interplay between inflation data and Fed policy decisions will likely dictate gold's trajectory in the near term. A key risk that could alter this bearish outlook is a significant shift in U.S. economic data, particularly inflation figures. Should upcoming inflation data show a marked decrease, it could prompt the Fed to adopt a more dovish stance, potentially weakening the dollar and providing support for gold prices. Conversely, stronger-than-expected inflation data could reinforce the Fed's hawkish position, exacerbating gold's decline. The market may not fully appreciate the potential for inflation surprises, which could lead to abrupt shifts in Fed policy expectations and, consequently, gold prices. Looking ahead, the next U.S. Consumer Price Index (CPI) release will be pivotal. A lower-than-expected CPI could validate a bullish reversal in gold, while a higher reading would likely confirm the current bearish trend. Investors should closely monitor this data point, as it will provide critical insights into the Fed's future policy path and its implications for gold.📈 Technical Indicators Summary
RSI (14)
42.5
50-Day MA
$4628.37
200-Day MA
$4376.58
Fib Level
50.0%
📊 Technical Analysis Chart (18-Month View)
📐 Fibonacci Retracement Analysis
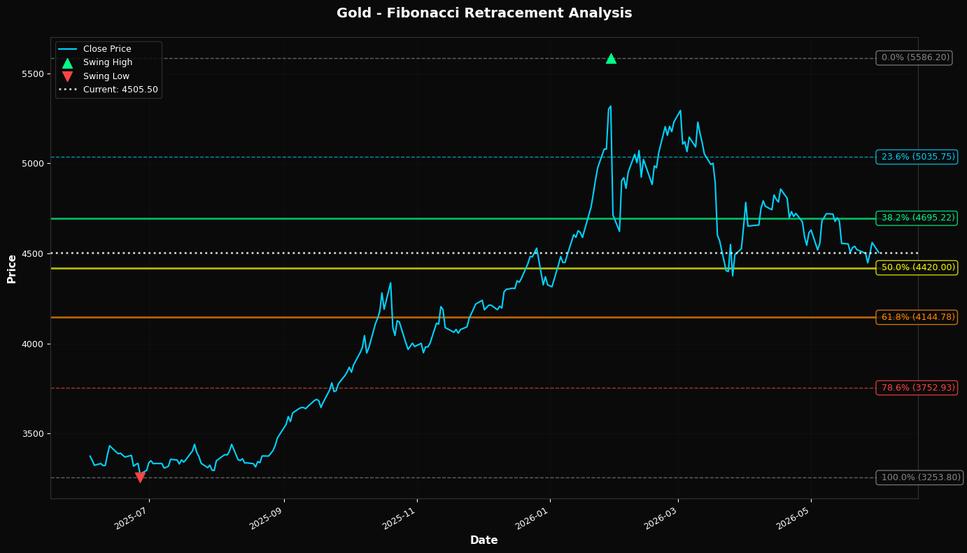
🎯 Key Trading Levels
Key Fibonacci Levels:
- 38.2%: $4695.22
- 50.0%: $4420.00
- 61.8%: $4144.78
Support: $3253.80 (Swing Low), $4628.37 (50-Day MA)
Resistance: $5586.20 (Swing High)
Disclaimer
The content on MarketsFN.com is provided for educational and informational purposes only. It does not constitute financial advice, investment recommendations, or trading guidance. All investments involve risks, and past performance does not guarantee future results. You are solely responsible for your investment decisions and should conduct independent research and consult a qualified financial advisor before acting. MarketsFN.com and its authors are not liable for any losses or damages arising from your use of this information.