Gold: Up 0.4% to $4039.90 — Bearish — Below MA50 & MA200
· Commodities · QuoteReporter
Gold: Up 0.4% to $4039.90 — Bearish — Below MA50 & MA200
Analysis Date: July 01, 2026
📊 Current Market Data
CURRENT PRICE
$4039.90
DAILY CHANGE
+0.42%
WEEKLY CHANGE
+1.24%
52W HIGH
$5586.20
52W LOW
$3263.90
💡 Key Market Factors
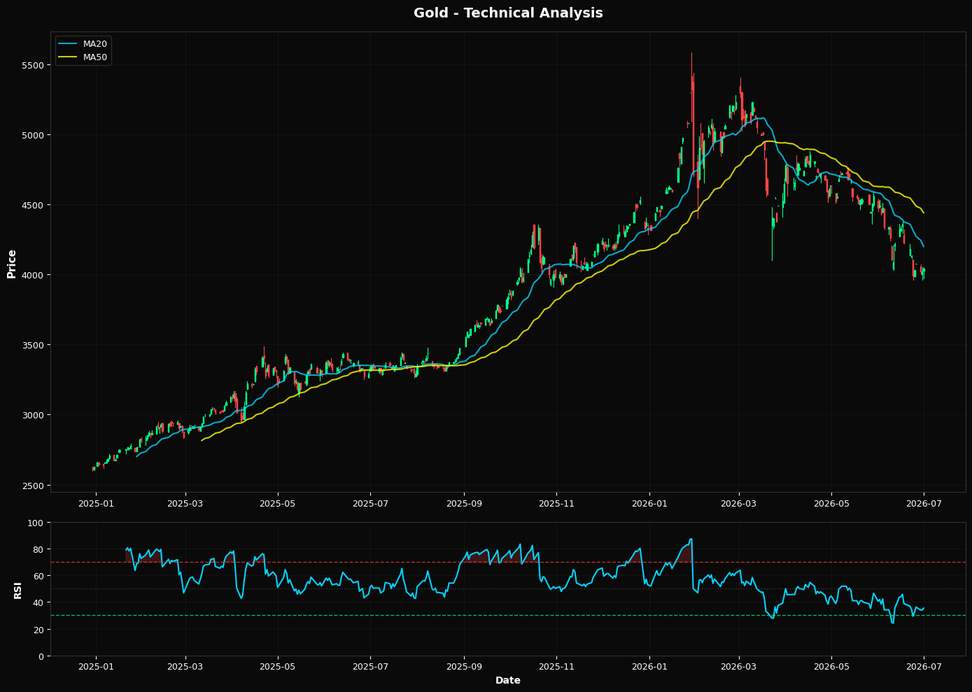
Gold's current price action suggests a potential rebound, but macroeconomic headwinds, particularly the strength of the U.S. dollar, remain a formidable barrier. With gold priced at $4039.90, the metal has seen a modest daily increase of +0.42% and a weekly gain of +1.24%. However, the broader macro environment, dominated by a robust dollar, continues to exert downward pressure. The Federal Reserve's hawkish stance on interest rates, aimed at curbing inflation, has bolstered the dollar, making gold less attractive as a non-yielding asset. This dynamic is crucial as it directly impacts gold's appeal as a safe-haven investment, potentially limiting upside momentum despite recent gains. From a technical perspective, gold's Relative Strength Index (RSI) of 35.4 indicates that it is approaching oversold territory, suggesting a possible buying opportunity. However, the price remains below key moving averages, with the MA20 at $4199.86, MA50 at $4440.81, and MA200 at $4453.98. This bearish alignment underscores the prevailing downtrend. The nearest Fibonacci support level at 61.8% is $4151.02, which gold has yet to reclaim, further emphasizing the technical resistance it faces. The market may be underestimating the potential for a technical bounce if gold can decisively break above this Fibonacci level, which could trigger a short-term rally. A key risk that could alter the current landscape for gold is a shift in Federal Reserve policy. Should upcoming economic data, such as a significant drop in inflation or a slowdown in economic growth, prompt the Fed to signal a pause or cut in interest rates, the dollar could weaken, providing a tailwind for gold prices. This scenario would likely lead to a reassessment of gold's value proposition as a hedge against currency devaluation and inflation, potentially catalyzing a more sustained upward move. Looking ahead, the next Federal Reserve meeting and subsequent commentary will be pivotal. Any indication of a dovish pivot could validate a bullish outlook for gold, as it would likely lead to a softer dollar and increased demand for gold as a safe-haven asset. Conversely, continued hawkish rhetoric could reinforce the current bearish technical setup, keeping gold under pressure. Investors should closely monitor these developments, as they will be critical in determining the next directional move for gold.📈 Technical Indicators Summary
RSI (14)
35.4
50-Day MA
$4440.81
200-Day MA
$4453.98
Fib Level
61.8%
📊 Technical Analysis Chart (18-Month View)
📐 Fibonacci Retracement Analysis
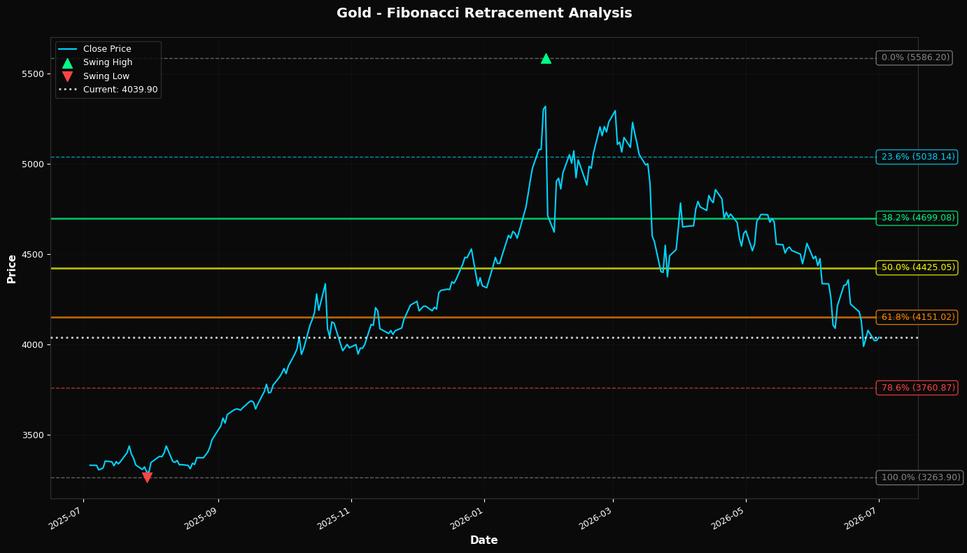
🎯 Key Trading Levels
Key Fibonacci Levels:
- 38.2%: $4699.08
- 50.0%: $4425.05
- 61.8%: $4151.02
Support: $3263.90 (Swing Low), $4440.81 (50-Day MA)
Resistance: $5586.20 (Swing High)
Disclaimer
The content on MarketsFN.com is provided for educational and informational purposes only. It does not constitute financial advice, investment recommendations, or trading guidance. All investments involve risks, and past performance does not guarantee future results. You are solely responsible for your investment decisions and should conduct independent research and consult a qualified financial advisor before acting. MarketsFN.com and its authors are not liable for any losses or damages arising from your use of this information.