Nasdaq 100 2026 YTD Highs & Lows Radar: ASML Holding NV (ASML), T-Mobile US (TMUS) and more
· Stocks · MarketsFN Team
Nasdaq 100 2026 YTD Highs & Lows Radar: ASML Holding NV (ASML), T-Mobile US (TMUS) and more
Screening all 101 Nasdaq 100 constituents for stocks nearest to their 2026 year-to-date high and their 2026 YTD low. Data as of July 01, 2026. % Realized = total return since Jan 1 2026.
Legend: RSI > 70 = overbought · RSI < 30 = oversold · Green % Realized = positive YTD return · Red = negative.
📈 Nearest to 2026 High
Sectors represented: Technology (5)
| Ticker | Company | Sector | Price Last | % Realized | 2026 YTD High Date | RSI | % above MA200 | Trend |
|---|---|---|---|---|---|---|---|---|
| ASML | ASML Holding NV | Technology | $1989.44 | +70.95% | 2026-06-30 | 58.3 | +51.8% | Above MA20, MA50, MA200 |
| AMD | Advanced Micro Devices Inc | Technology | $580.91 | +159.95% | 2026-06-30 | 58.7 | +110.1% | Above MA20, MA50, MA200 |
| PANW | Palo Alto Networks Inc | Technology | $341.02 | +90.12% | 2026-06-30 | 80.4 | +69.9% | Above MA20, MA50, MA200 |
| AMAT | Applied Materials Inc | Technology | $723.00 | +168.90% | 2026-06-30 | 63.6 | +114.3% | Above MA20, MA50, MA200 |
| LRCX | Lam Research Corp | Technology | $433.33 | +134.16% | 2026-06-30 | 58.4 | +95.4% | Above MA20, MA50, MA200 |
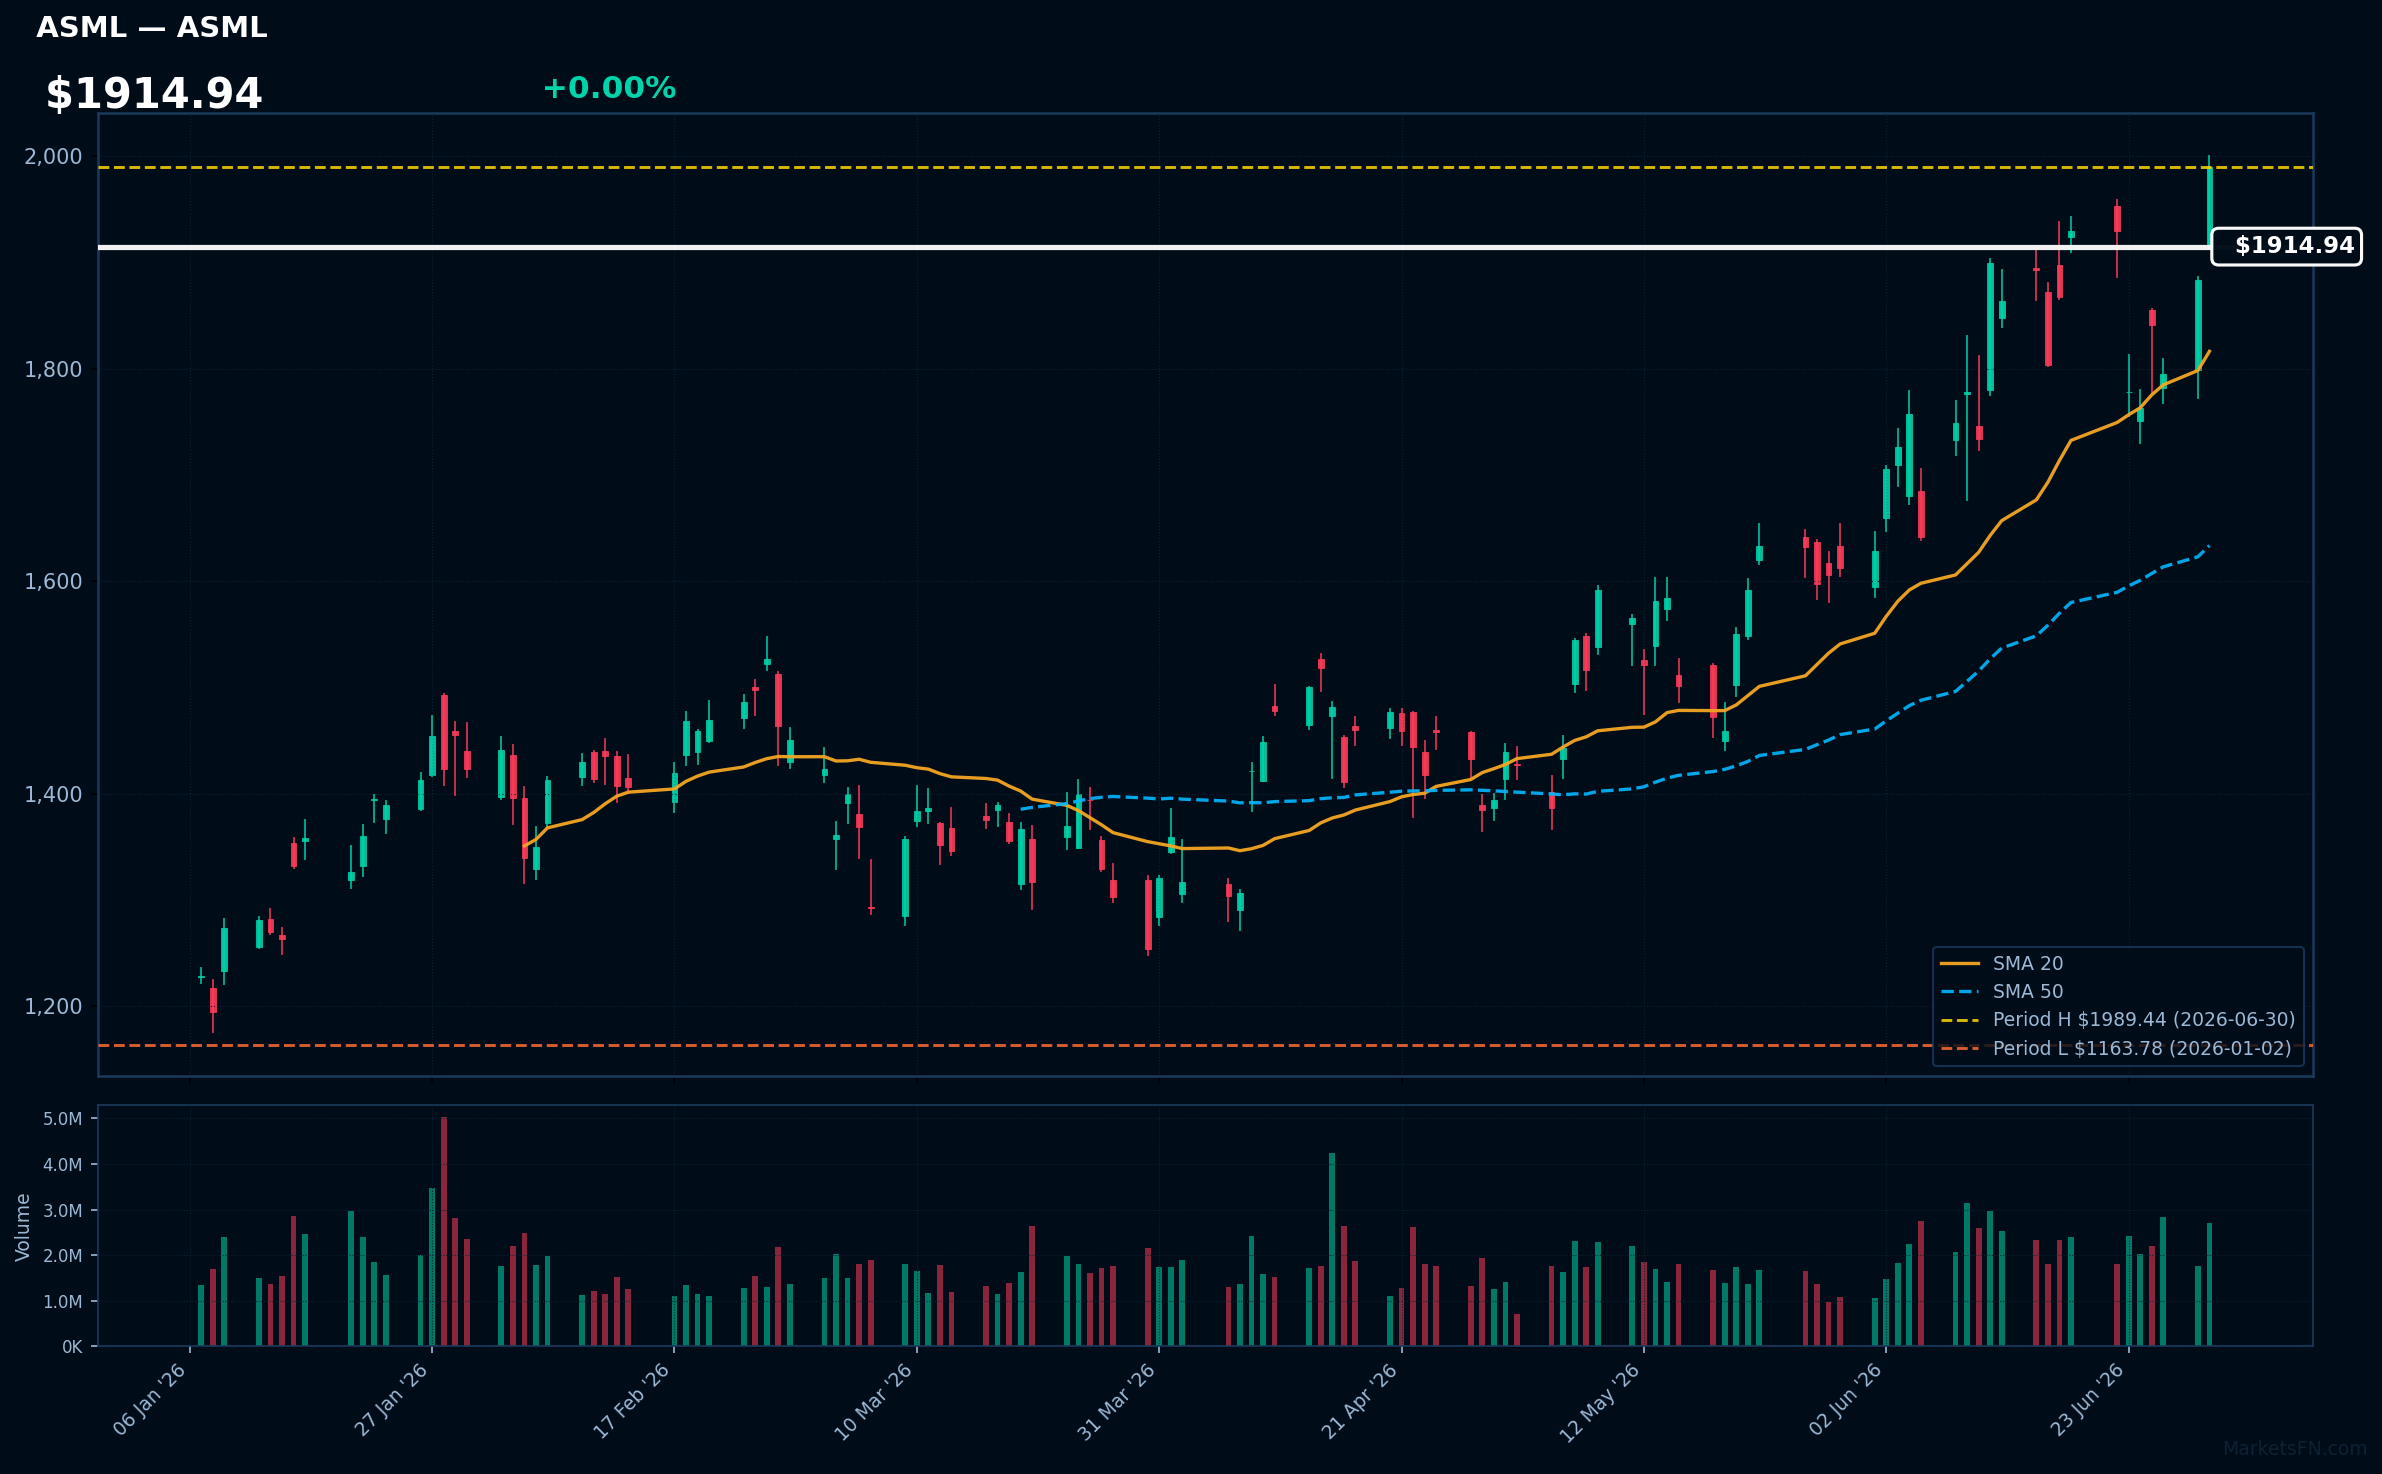
ASML | ASML Holding NV | Technology | Price Last: $1989.44 | % Realized: +70.95% | RSI: 58.3 | % above MA200: +51.8% | Trend: Above MA20, MA50, MA200
ASML Holding NV is a lithography equipment manufacturer crucial for semiconductor production. Investors should care because its technology enables cutting-edge chip manufacturing, driving growth in AI, 5G, and other emerging tech sectors.
ASML's technicals indicate sustained uptrend with price > MA20 > MA50 > MA200, RSI(14) at 58.3, and 0.0% below 2026 YTD high, suggesting momentum near a potential breakout level, with 70.9% 2026 YTD return.
Related headlines
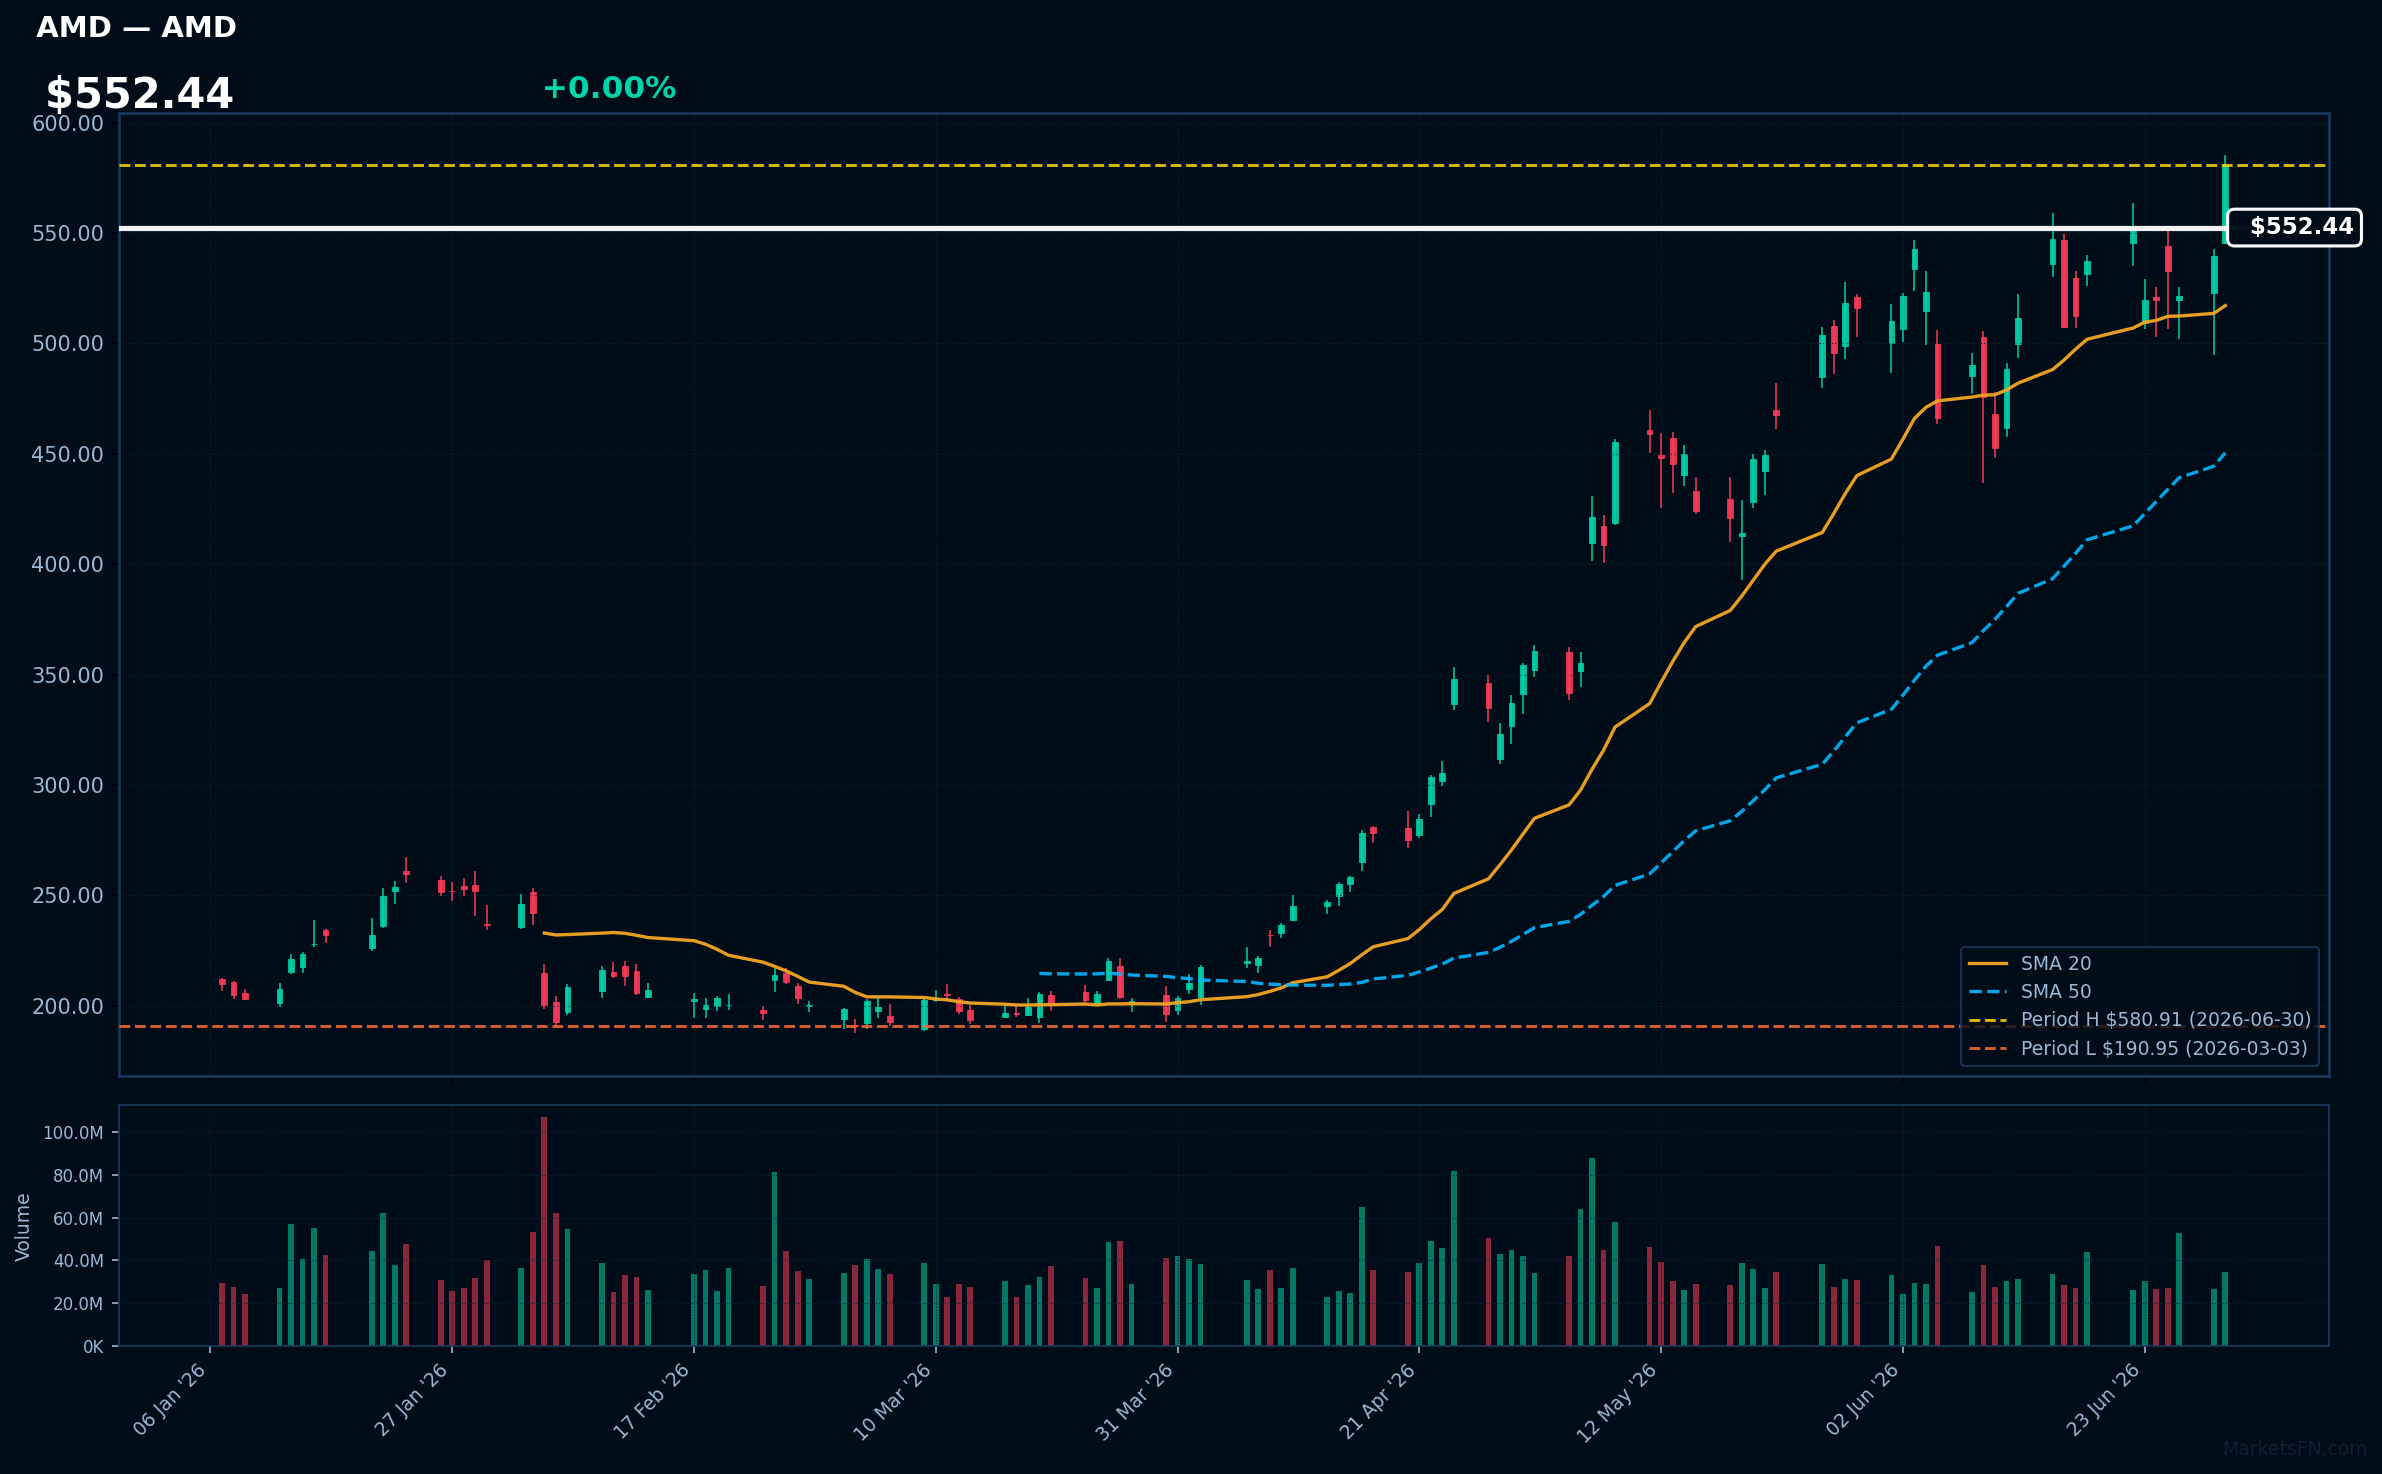
AMD | Advanced Micro Devices Inc | Technology | Price Last: $580.91 | % Realized: +159.95% | RSI: 58.7 | % above MA200: +110.1% | Trend: Above MA20, MA50, MA200
Advanced Micro Devices Inc (AMD) is a semiconductor company designing and manufacturing high-performance CPUs, GPUs, and other processing units for gaming PCs, data centers, and AI applications, making it a key player in the rapidly evolving tech industry.
AMD's current technical situation indicates sustained uptrend with bullish MA alignment (price > MA20 > MA50 > MA200) and RSI(14) at 58.7, near a potential breakout level as it's 0.0% below its 2026 YTD high, suggesting momentum.
Related headlines
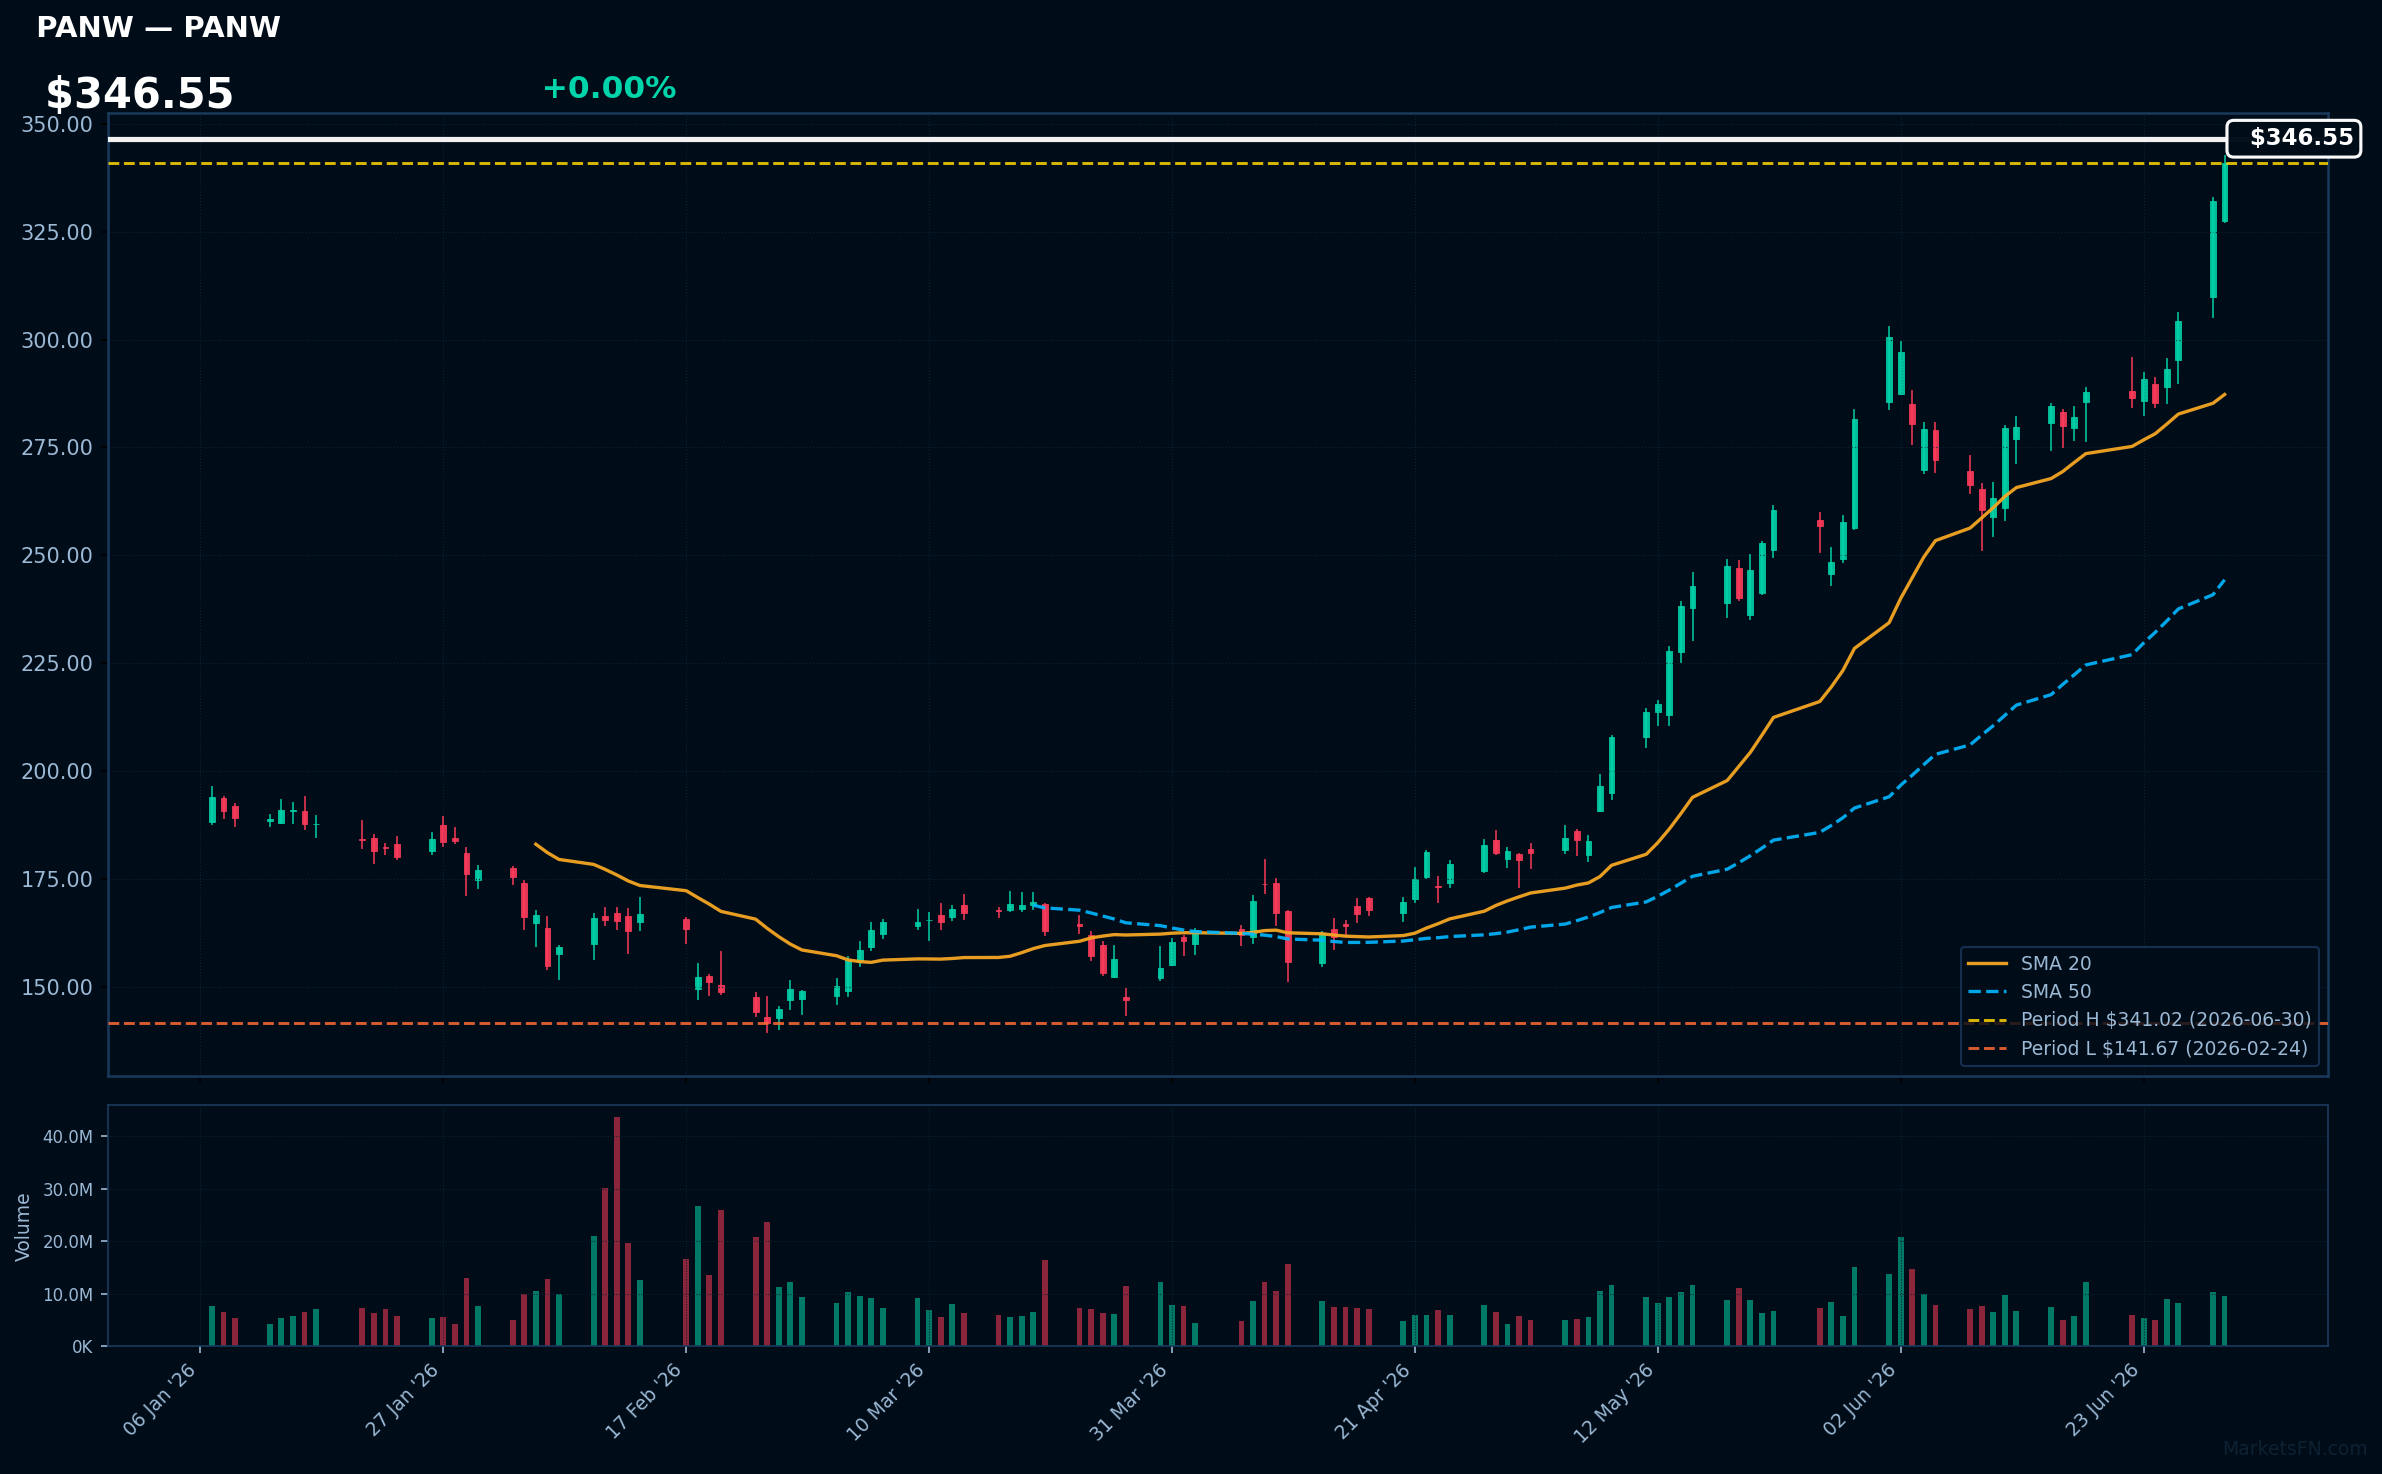
PANW | Palo Alto Networks Inc | Technology | Price Last: $341.02 | % Realized: +90.12% | RSI: 80.4 | % above MA200: +69.9% | Trend: Above MA20, MA50, MA200
Palo Alto Networks Inc is a cybersecurity company providing advanced threat prevention and security solutions. Investors should care because its innovative products and strong market position drive growth, making it a significant player in the rapidly expanding cybersecurity market.
Palo Alto Networks Inc exhibits strong technical momentum with an RSI(14) of 80.4, indicating overbought conditions. The bullish MA alignment (price > MA20 > MA50 > MA200) and 0.0% proximity to its 2026 YTD high suggest a potential breakout, with a 90.1% return over the 2026 YTD period.
Related headlines
- The Old-School Signal That Lit Up Palo Alto Networks Stock
- Is the Market Totally Wrong About PANW Stock?
- PANW vs CRWD vs AVGO: Morningstar Has A 'Top Pick' Trading At A 40% Discount After Earnings
- Palo Alto Networks and Deutsche Telekom Bring AI-Driven Security with Advanced Sovereignty Controls for European Regulated Industries
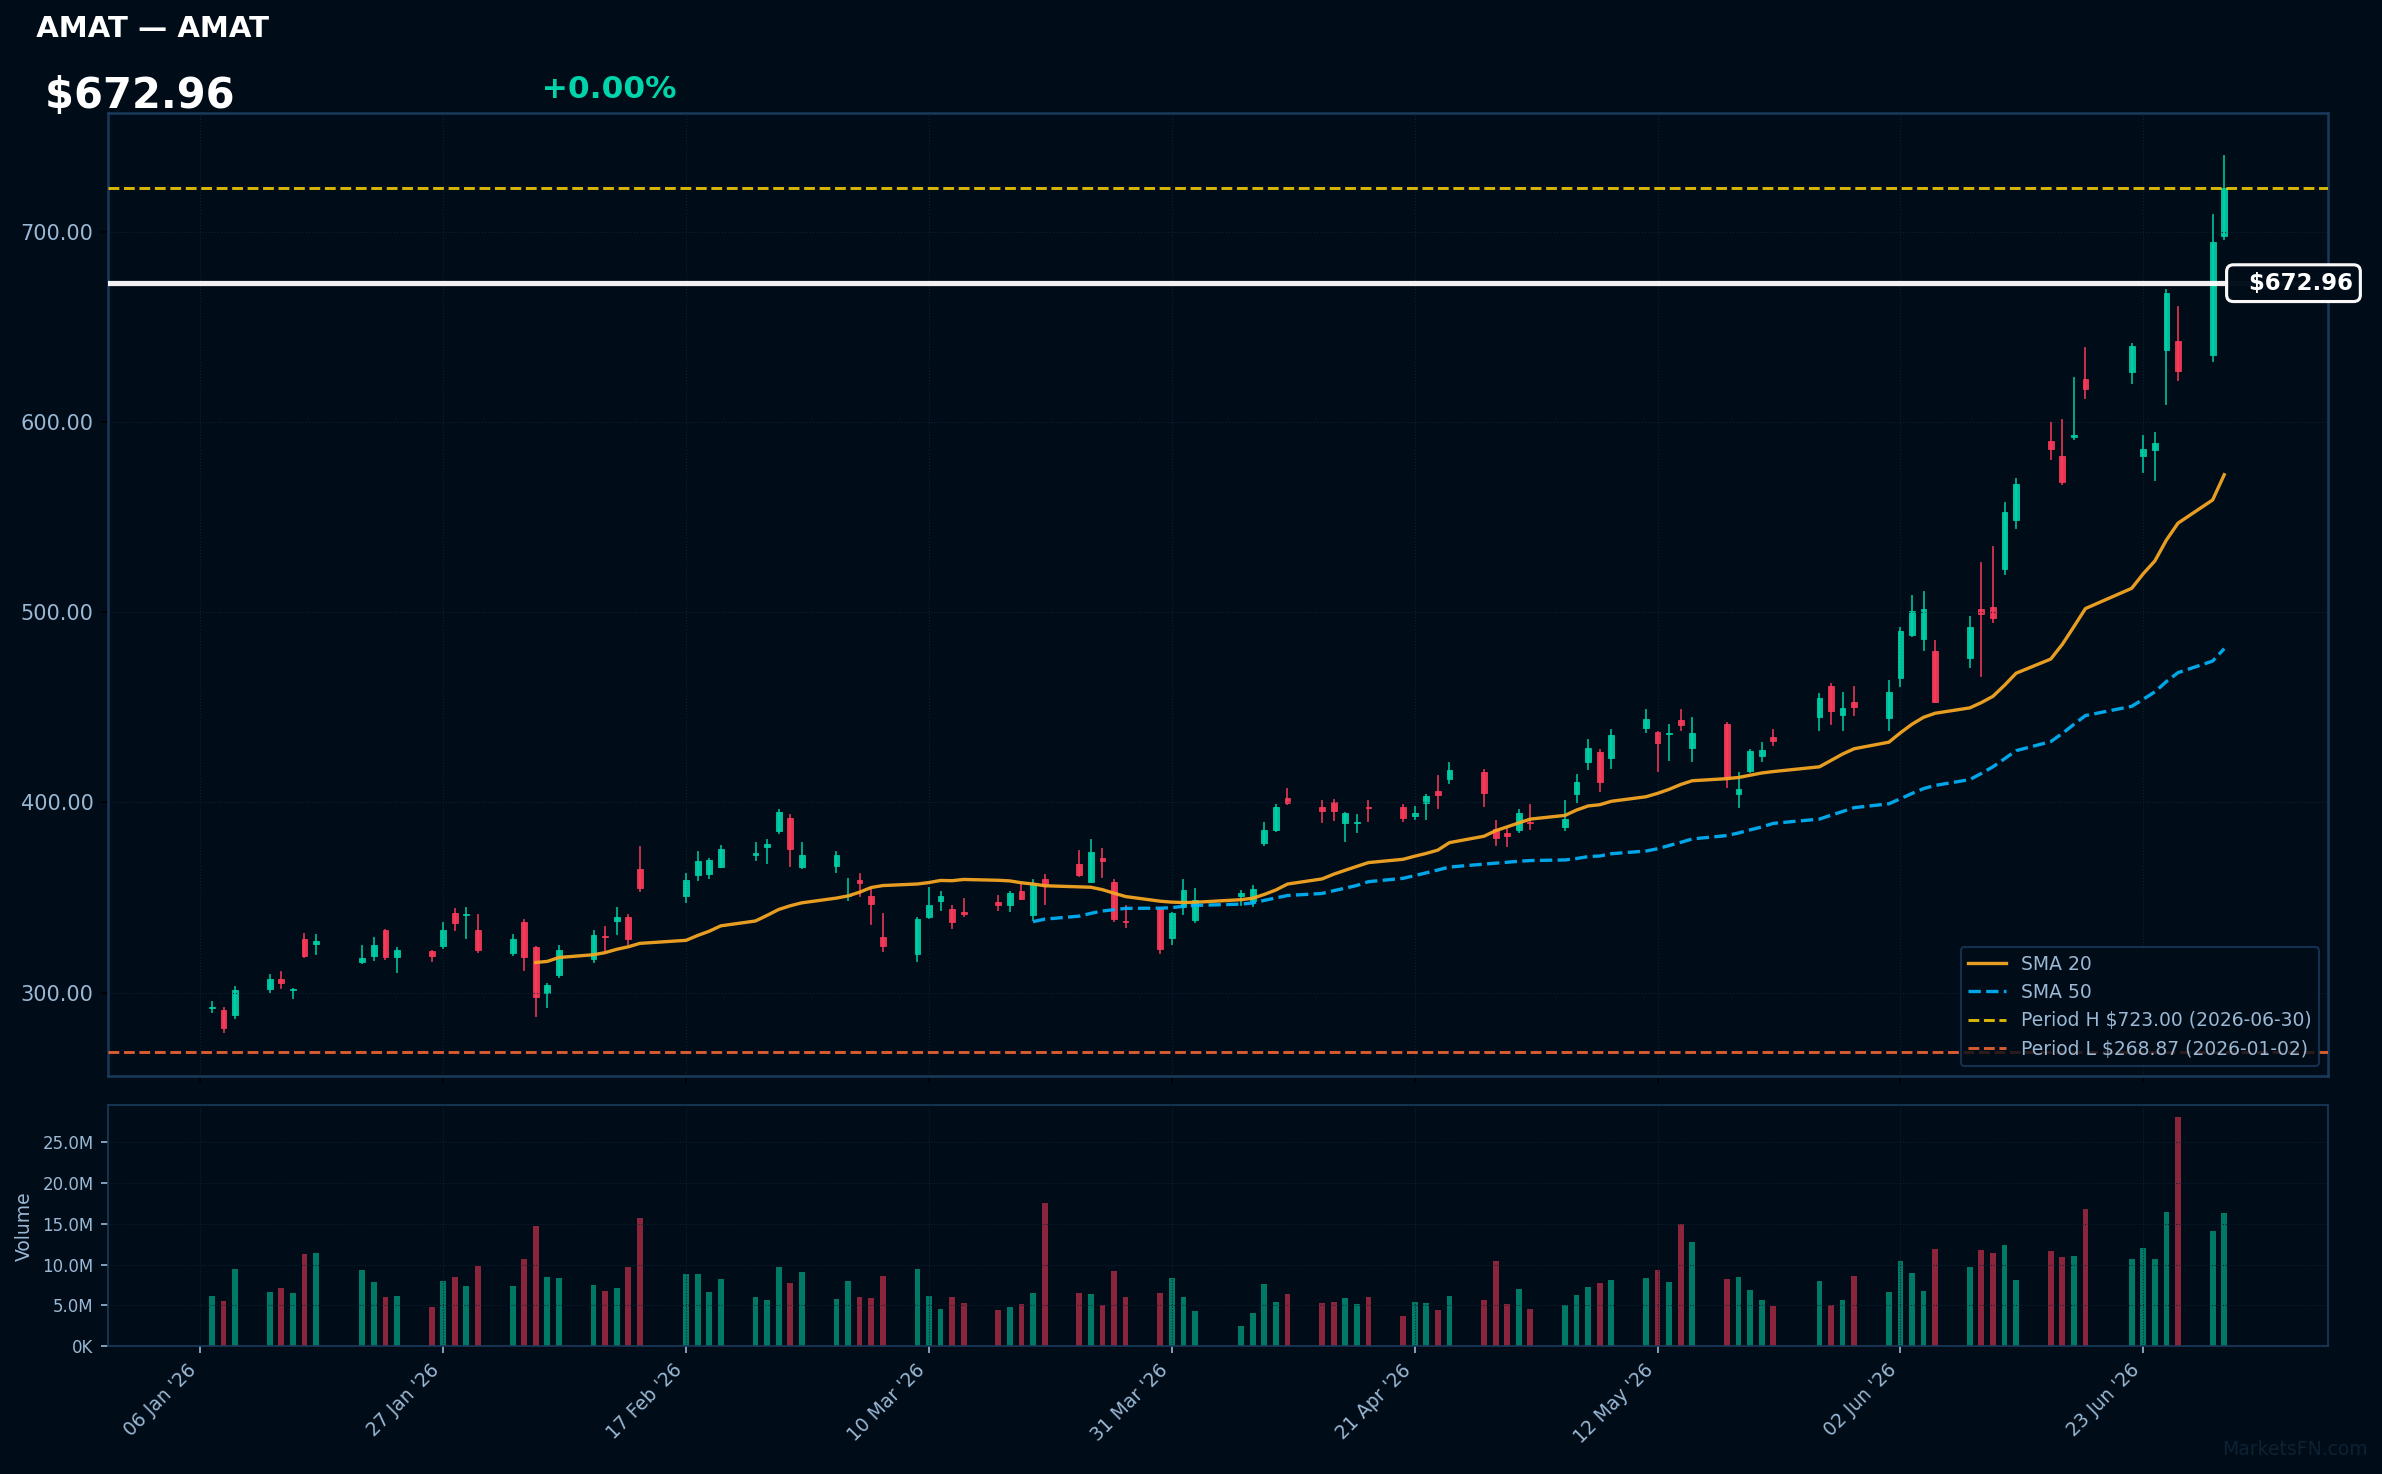
AMAT | Applied Materials Inc | Technology | Price Last: $723.00 | % Realized: +168.90% | RSI: 63.6 | % above MA200: +114.3% | Trend: Above MA20, MA50, MA200
Applied Materials Inc is a leading manufacturer of semiconductor fabrication equipment, providing critical technology for chip production. Investors should care because its products enable advancements in AI, 5G, and other emerging technologies, driving growth in the semiconductor industry.
AMAT's technical situation indicates strong momentum: RSI(14) is 63.6, and the stock is in a sustained uptrend with price > MA20 > MA50 > MA200. It's 0.0% below its 2026 YTD high, suggesting a potential breakout.
Related headlines
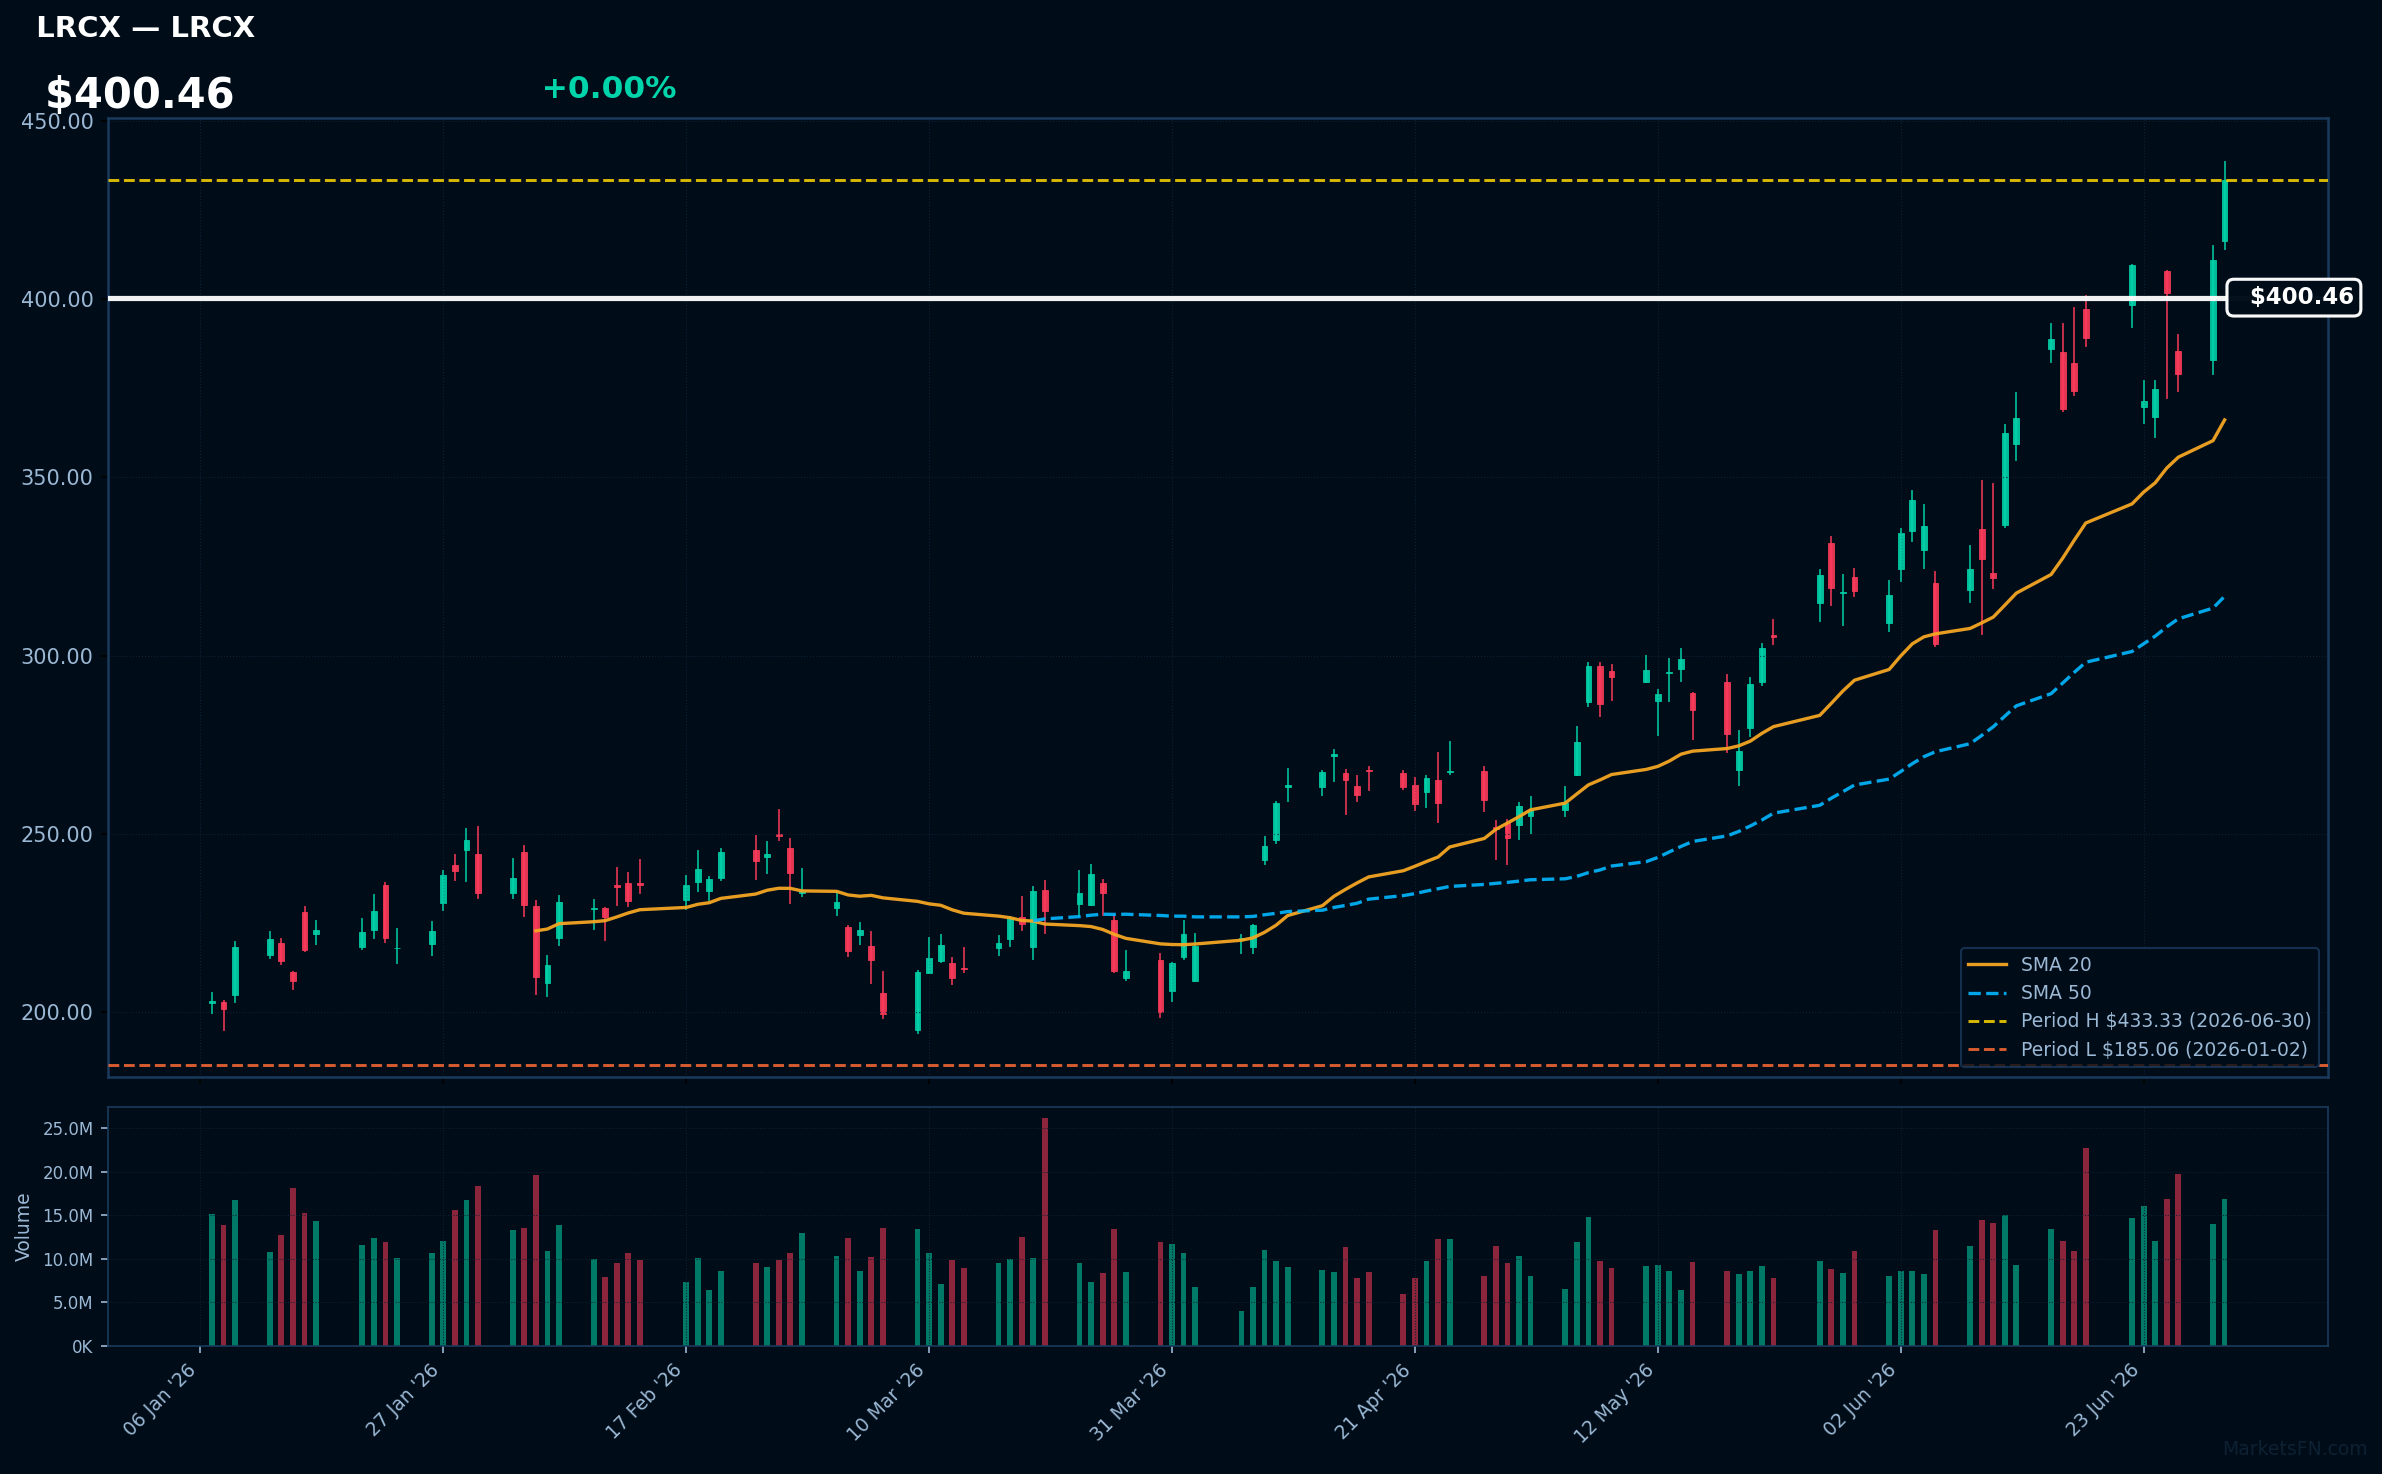
LRCX | Lam Research Corp | Technology | Price Last: $433.33 | % Realized: +134.16% | RSI: 58.4 | % above MA200: +95.4% | Trend: Above MA20, MA50, MA200
Lam Research Corp is a leading supplier of wafer fabrication equipment and services to the semiconductor industry. Investors should care because its products are crucial for chip manufacturing, driving growth in AI, 5G, and other emerging technologies.
Lam Research Corp is in a sustained uptrend with price > MA20 > MA50 > MA200, RSI(14) at 58.4, and is 0.0% below its 2026 YTD high, indicating strong momentum with no immediate signs of reversal.
Related headlines
📉 Nearest to 2026 Low
Sectors represented: Healthcare (2), Communication Services (1), Consumer Defensive (1), Real Estate (1)
| Ticker | Company | Sector | Price Last | % Realized | 2026 YTD Low Date | RSI | % above MA200 | Trend |
|---|---|---|---|---|---|---|---|---|
| TMUS | T-Mobile US Inc | Communication Services | $167.73 | -15.96% | 2026-06-30 | 37.0 | -17.9% | Below MA20, MA50, MA200 |
| PEP | PepsiCo Inc | Consumer Defensive | $135.40 | -4.80% | 2026-06-30 | 42.4 | -9.8% | Below MA20, MA50, MA200 |
| ISRG | Intuitive Surgical Inc | Healthcare | $397.68 | -29.24% | 2026-06-30 | 41.1 | -18.6% | Below MA20, MA50, MA200 |
| IDXX | Idexx Laboratories, Inc | Healthcare | $526.44 | -21.43% | 2026-06-30 | 41.6 | -16.2% | Below MA20, MA50, MA200 |
| CSGP | Costar Group, Inc | Real Estate | $28.32 | -56.89% | 2026-06-30 | 38.8 | -48.1% | Below MA20, MA50, MA200 |
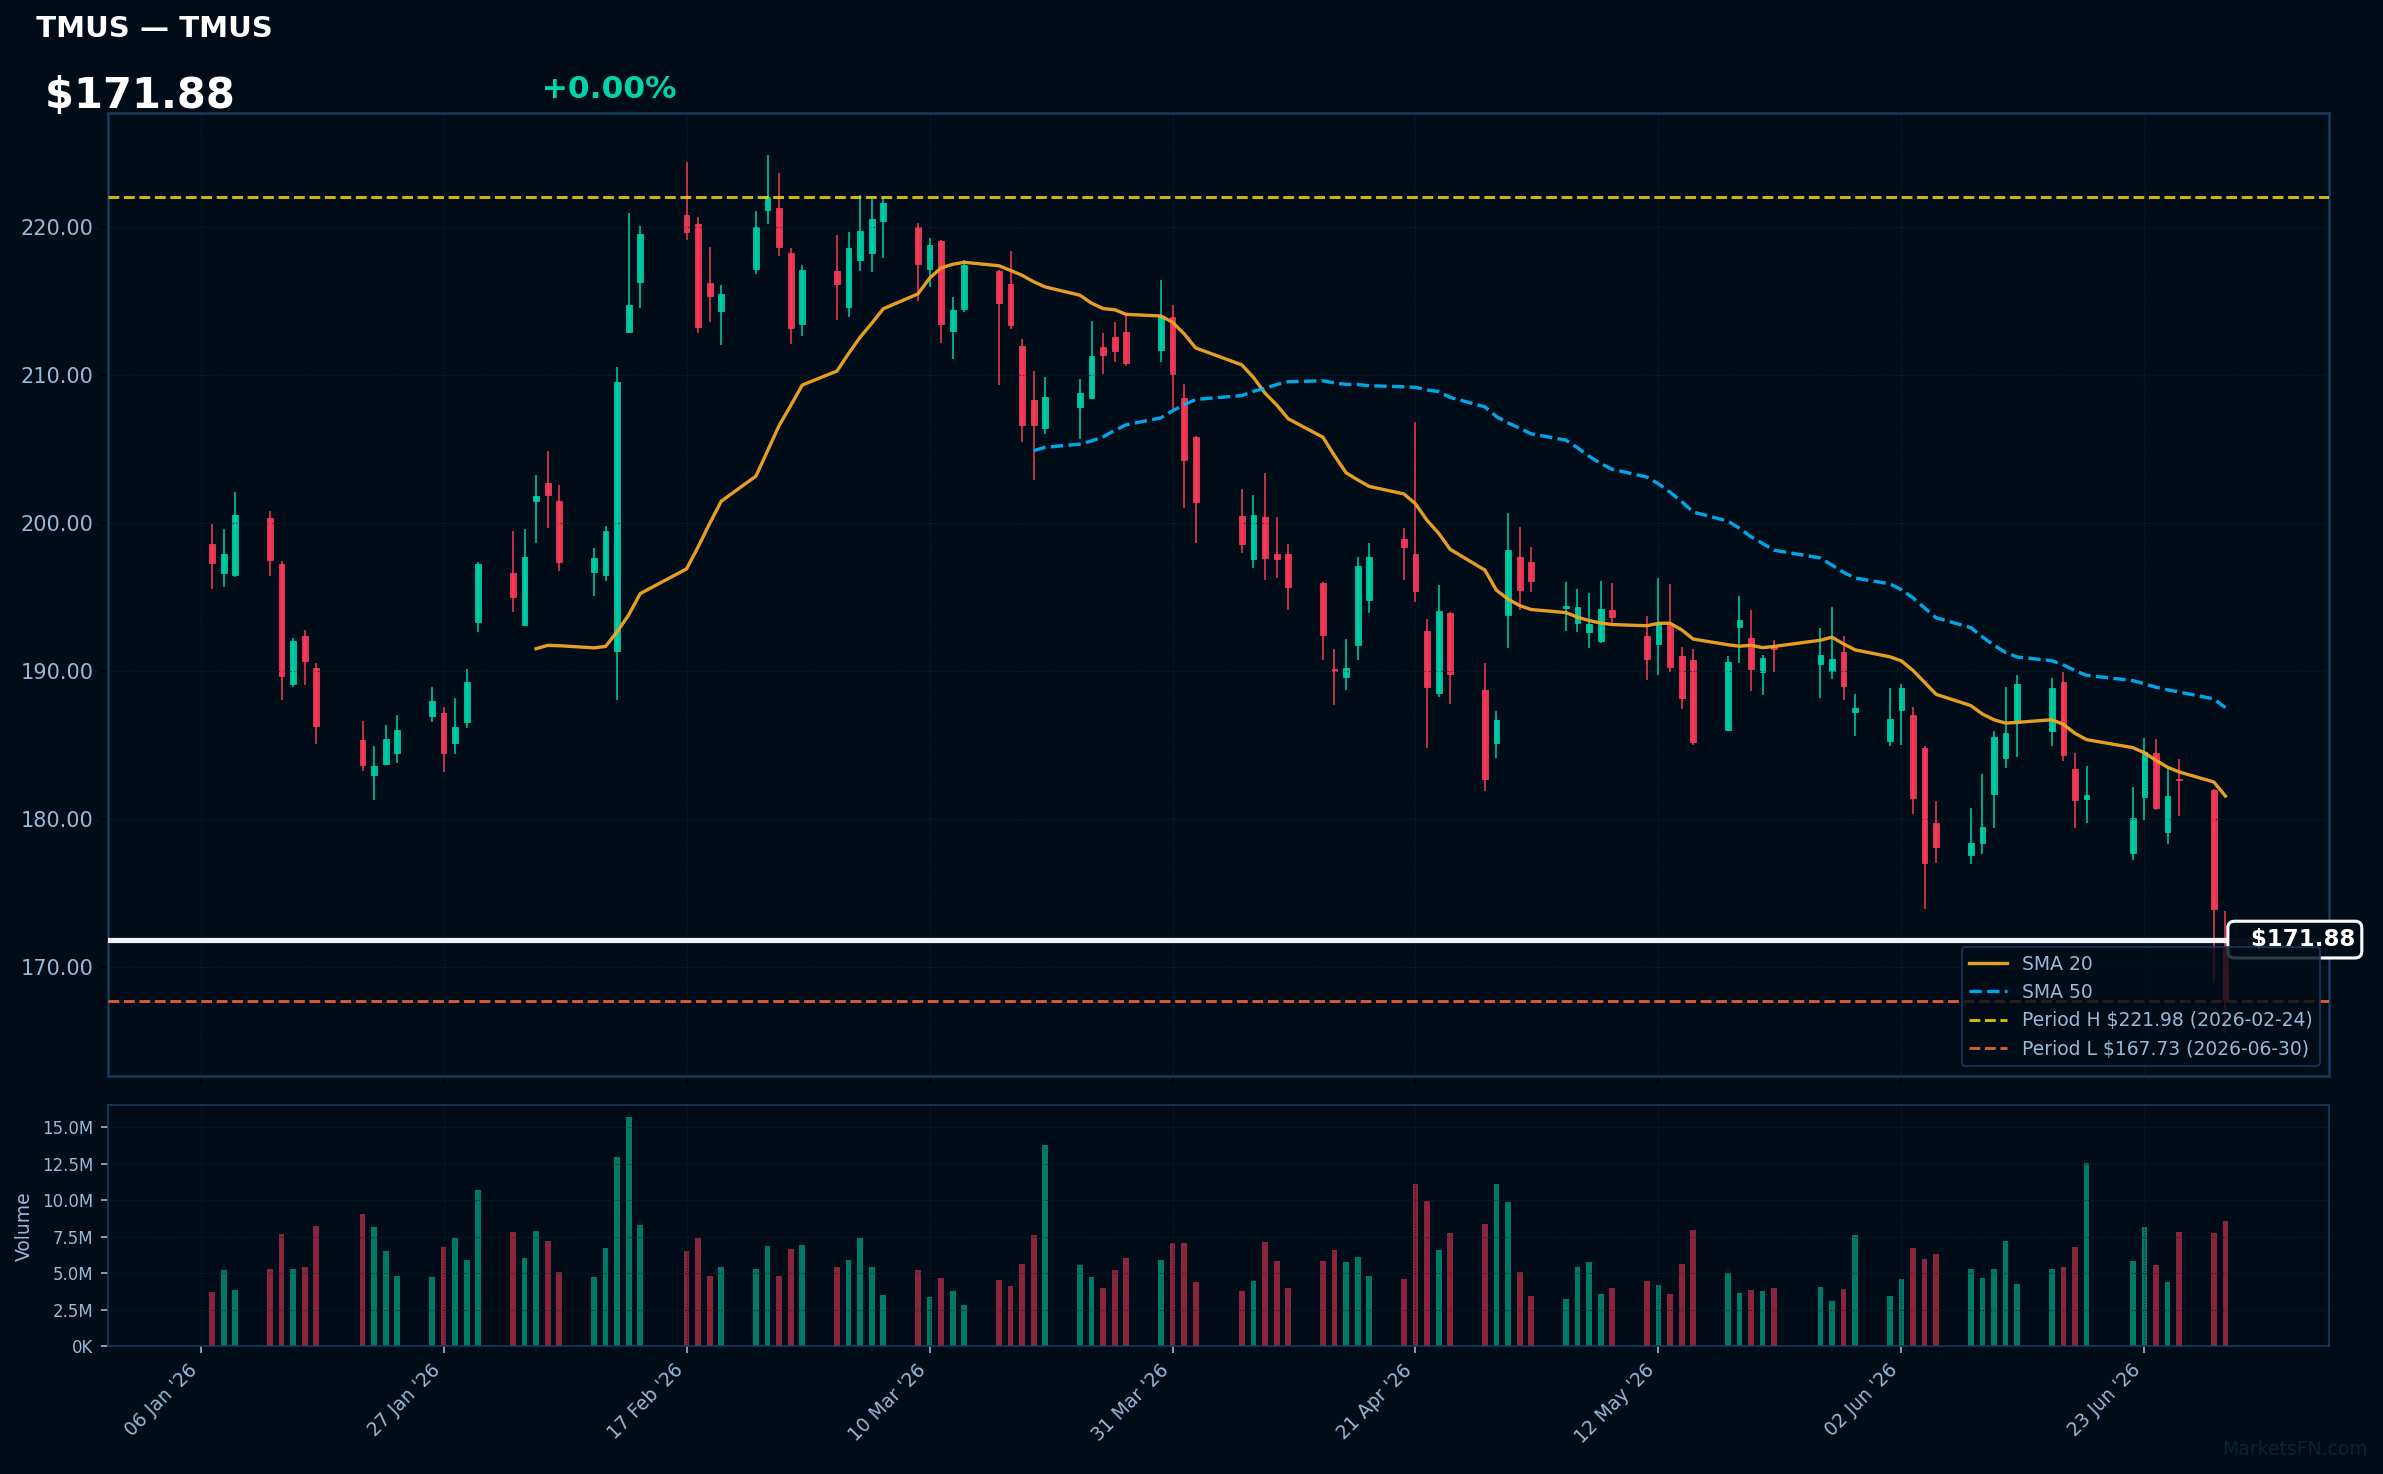
TMUS | T-Mobile US Inc | Communication Services | Price Last: $167.73 | % Realized: -15.96% | RSI: 37.0 | % above MA200: -17.9% | Trend: Below MA20, MA50, MA200
T-Mobile US Inc is a wireless network operator providing mobile services. Investors should care about its competitive positioning and growth prospects in the US telecom market.
T-Mobile US Inc is in a sustained downtrend with price ($171.88) below MA20, MA50, and MA200. RSI(14) is 37.0, nearing oversold territory. The stock is testing major support at its 2026 YTD low, having fallen -16.0% YTD.
Related headlines
- VZ, T, TMUS Shares Under Pressure SpaceX's Starlink Mobile Service Push Rattles Telecom Stocks
- SpaceX Might Bring Mobile Phone to Market, and Verizon, AT&T, and T-Mobile Are Down
- SPCX Stock: SpaceX's Wireless Ambitions Fuel T-Mobile Acquisition Speculation
- T-Mobile to Host Q2 2026 Earnings Call on July 23, 2026
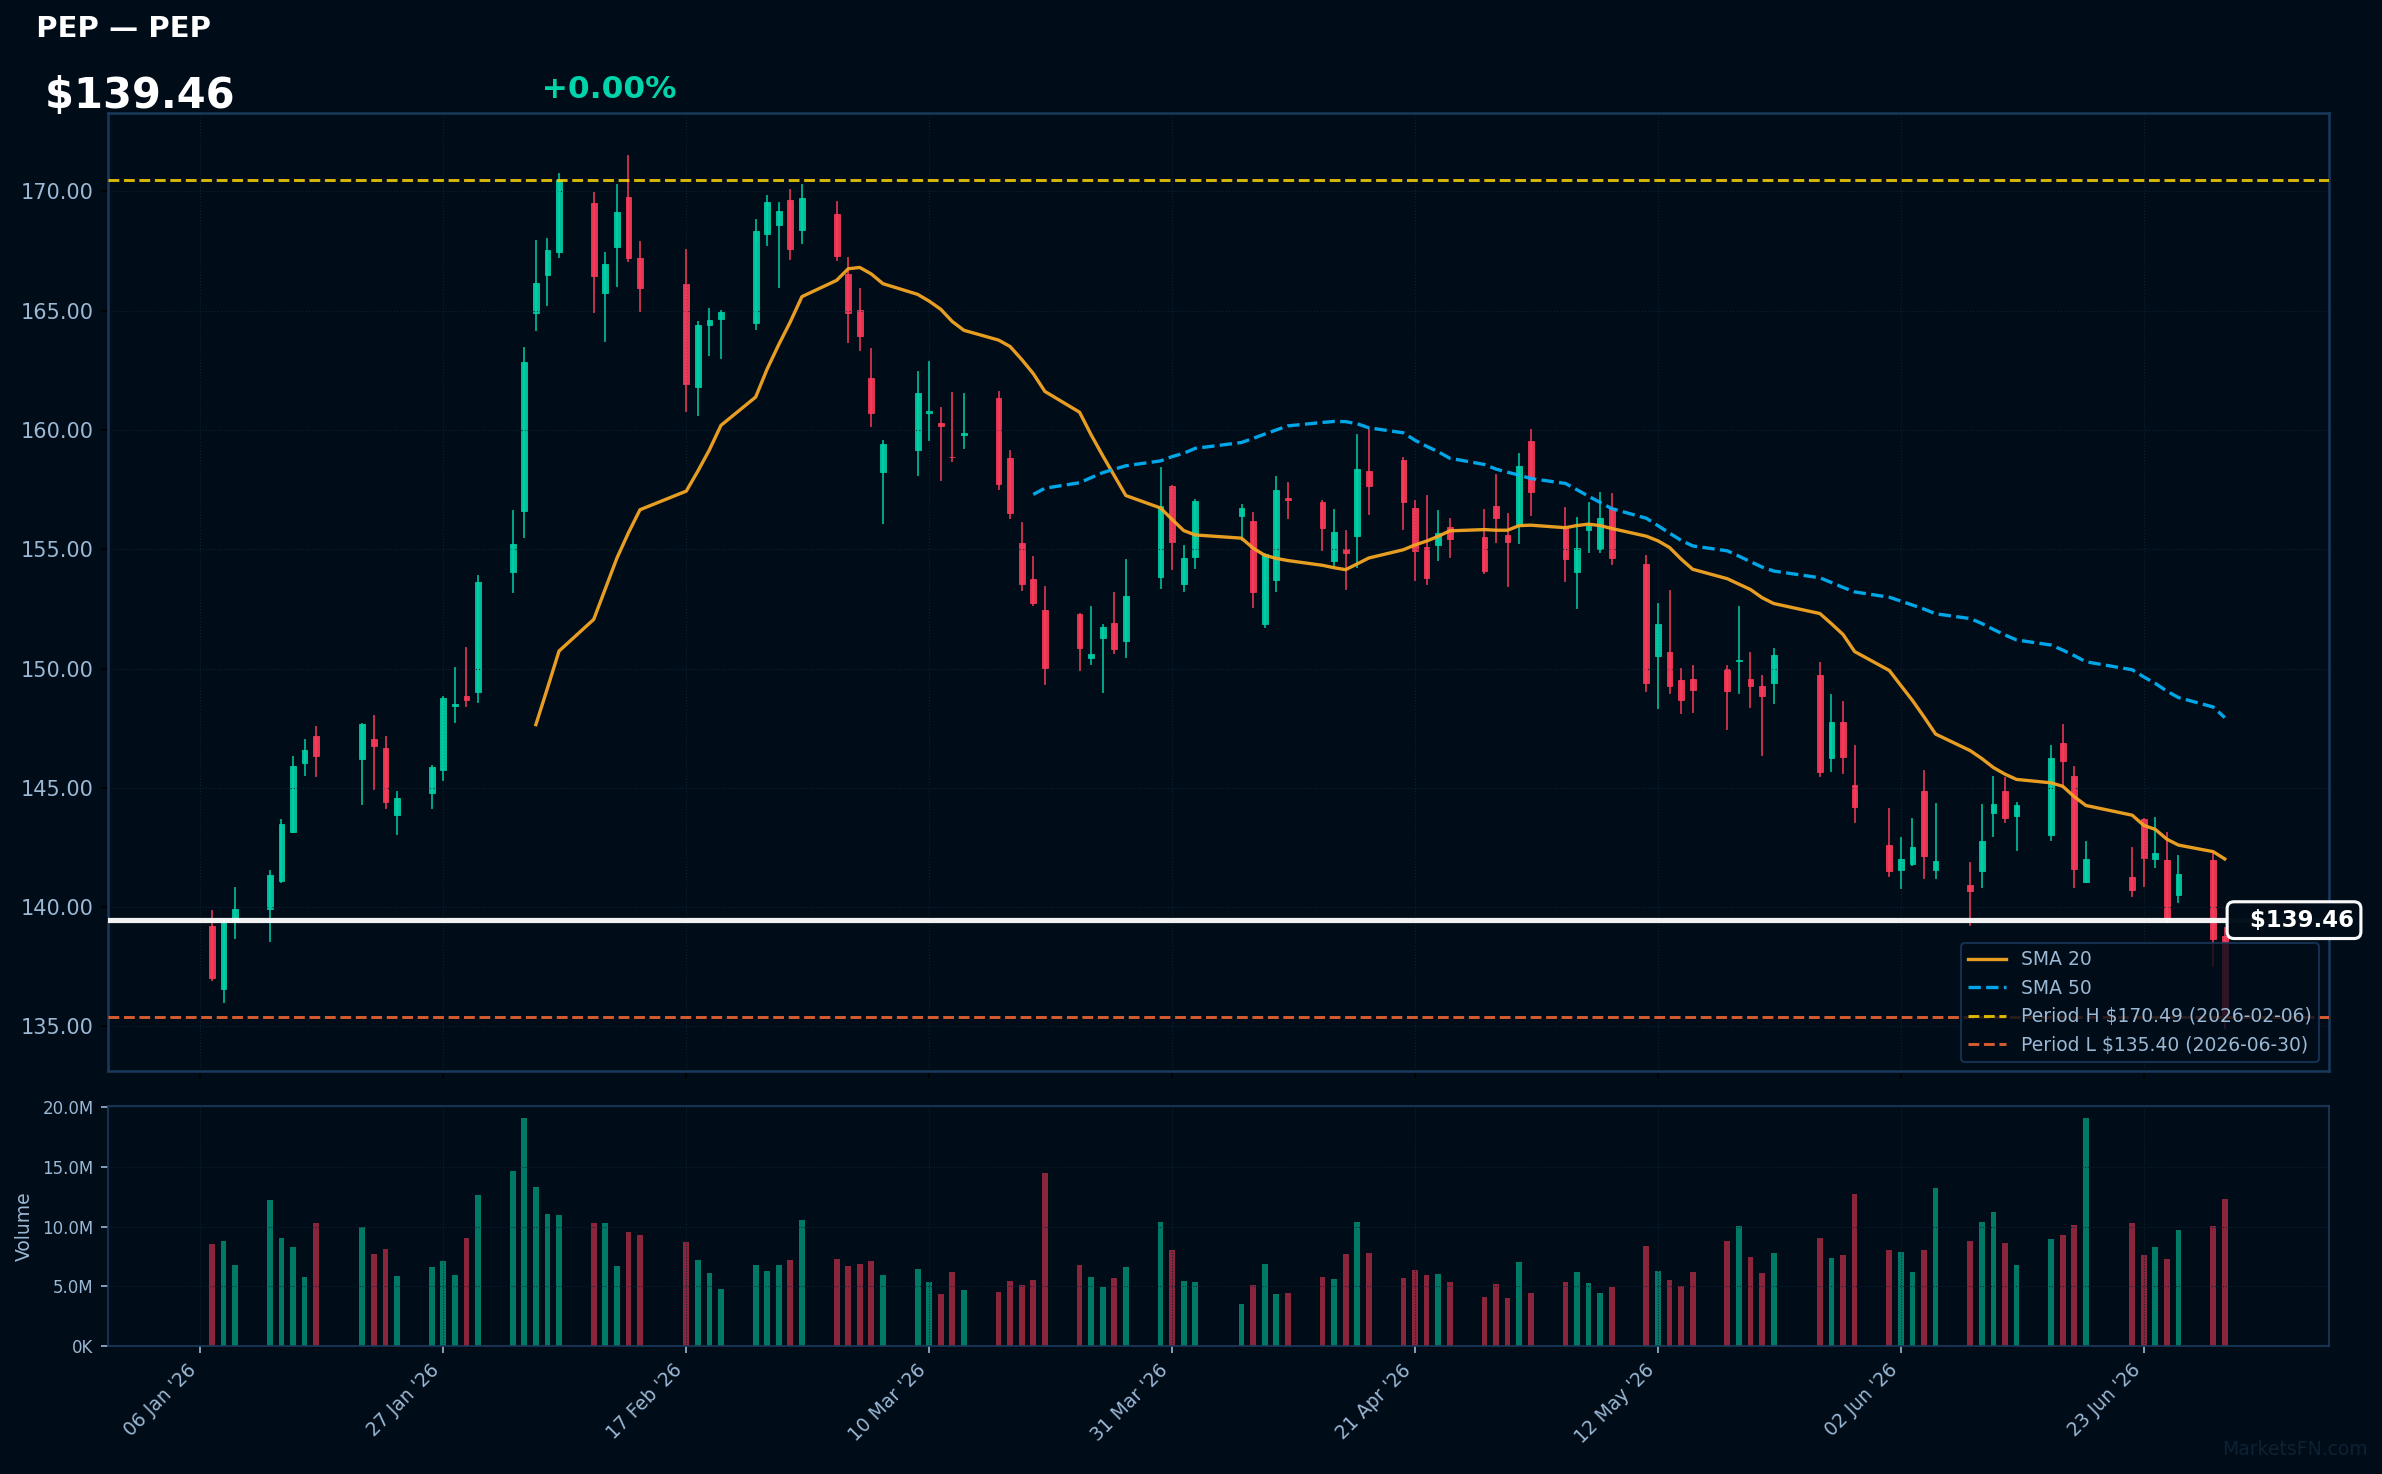
PEP | PepsiCo Inc | Consumer Defensive | Price Last: $135.40 | % Realized: -4.80% | RSI: 42.4 | % above MA200: -9.8% | Trend: Below MA20, MA50, MA200
PepsiCo Inc is a multinational food and beverage corporation with a diverse portfolio of brands including Pepsi, Lay's, and Gatorade, generating revenue through beverage sales, snack foods, and other consumer products, making it a significant player in the consumer staples sector.
PepsiCo Inc's current technical situation indicates a sustained downtrend with price ($139.46) below MA20, MA50, and MA200, and an RSI(14) of 42.4, suggesting a lack of momentum; the stock is testing major support at its 2026 YTD low.
Related headlines
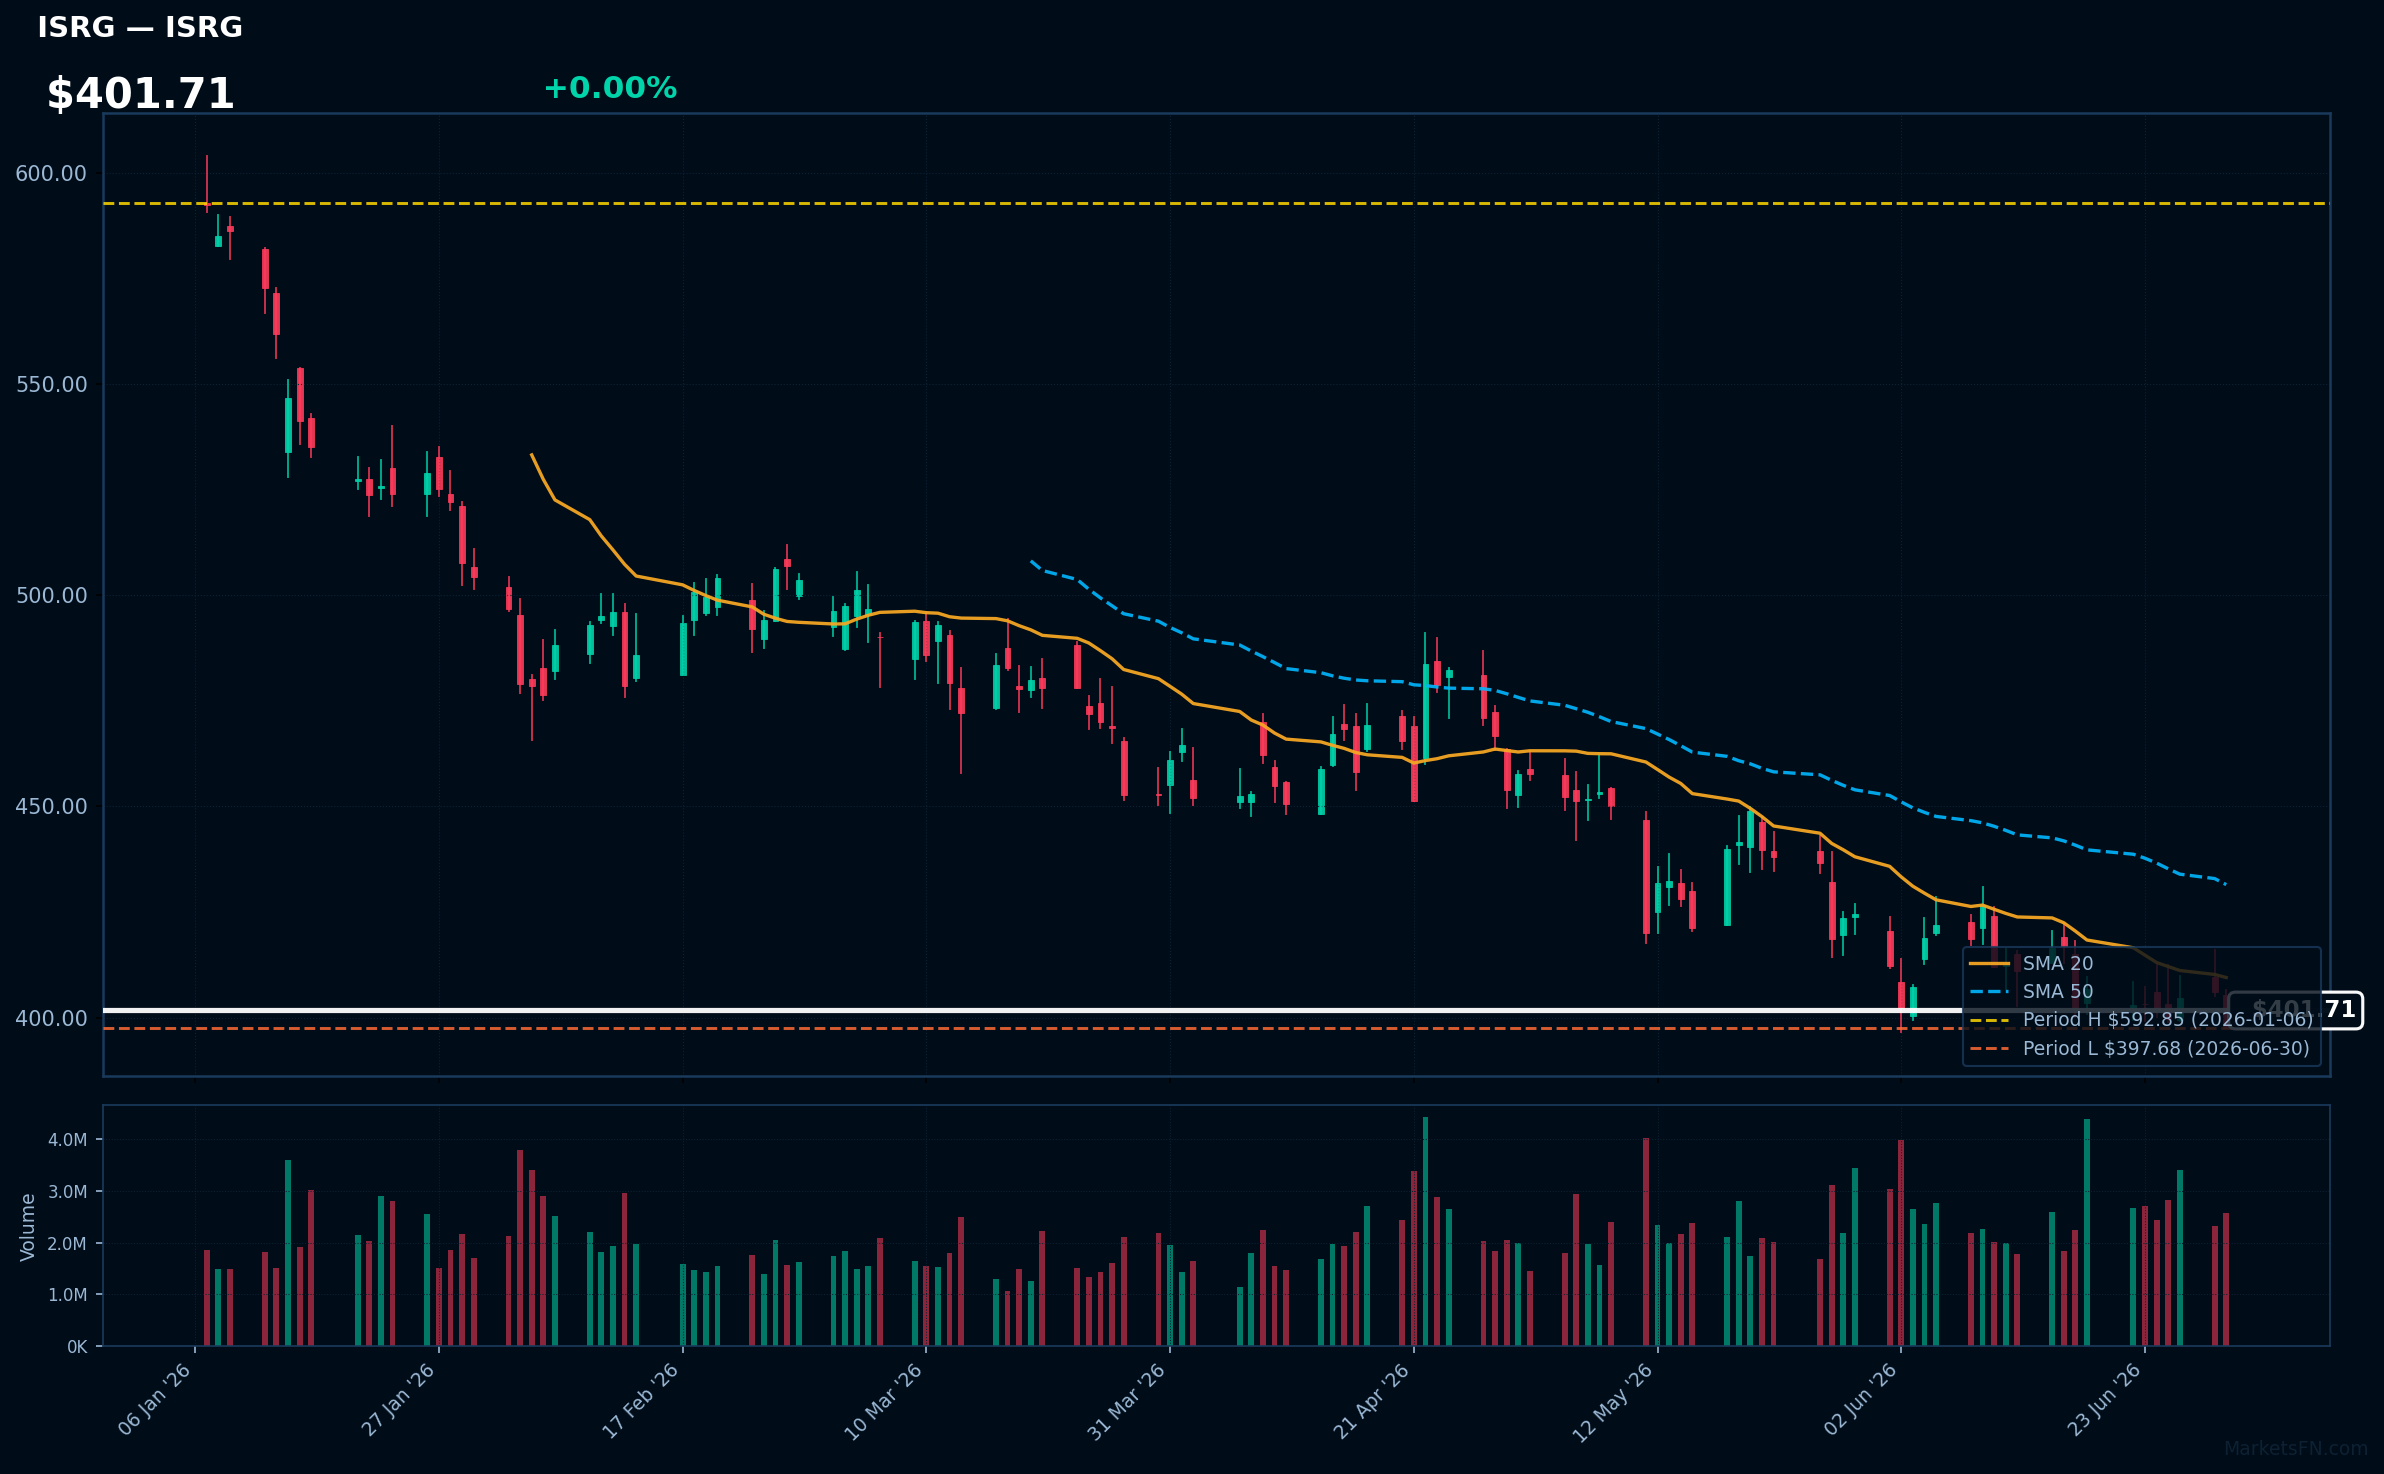
ISRG | Intuitive Surgical Inc | Healthcare | Price Last: $397.68 | % Realized: -29.24% | RSI: 41.1 | % above MA200: -18.6% | Trend: Below MA20, MA50, MA200
Intuitive Surgical Inc develops and markets robotic-assisted surgical systems, primarily the da Vinci Surgical System, enhancing precision and minimally invasive procedures. Investors should care as its technology adoption drives growth in surgical procedures and healthcare innovation.
ISRG's technical situation indicates a sustained downtrend with price ($401.71) below MA20, MA50, and MA200. RSI(14) at 41.1 suggests bearish momentum. Testing major support at its 2026 YTD low, a -29.2% YTD return reinforces the warning sign.
Related headlines
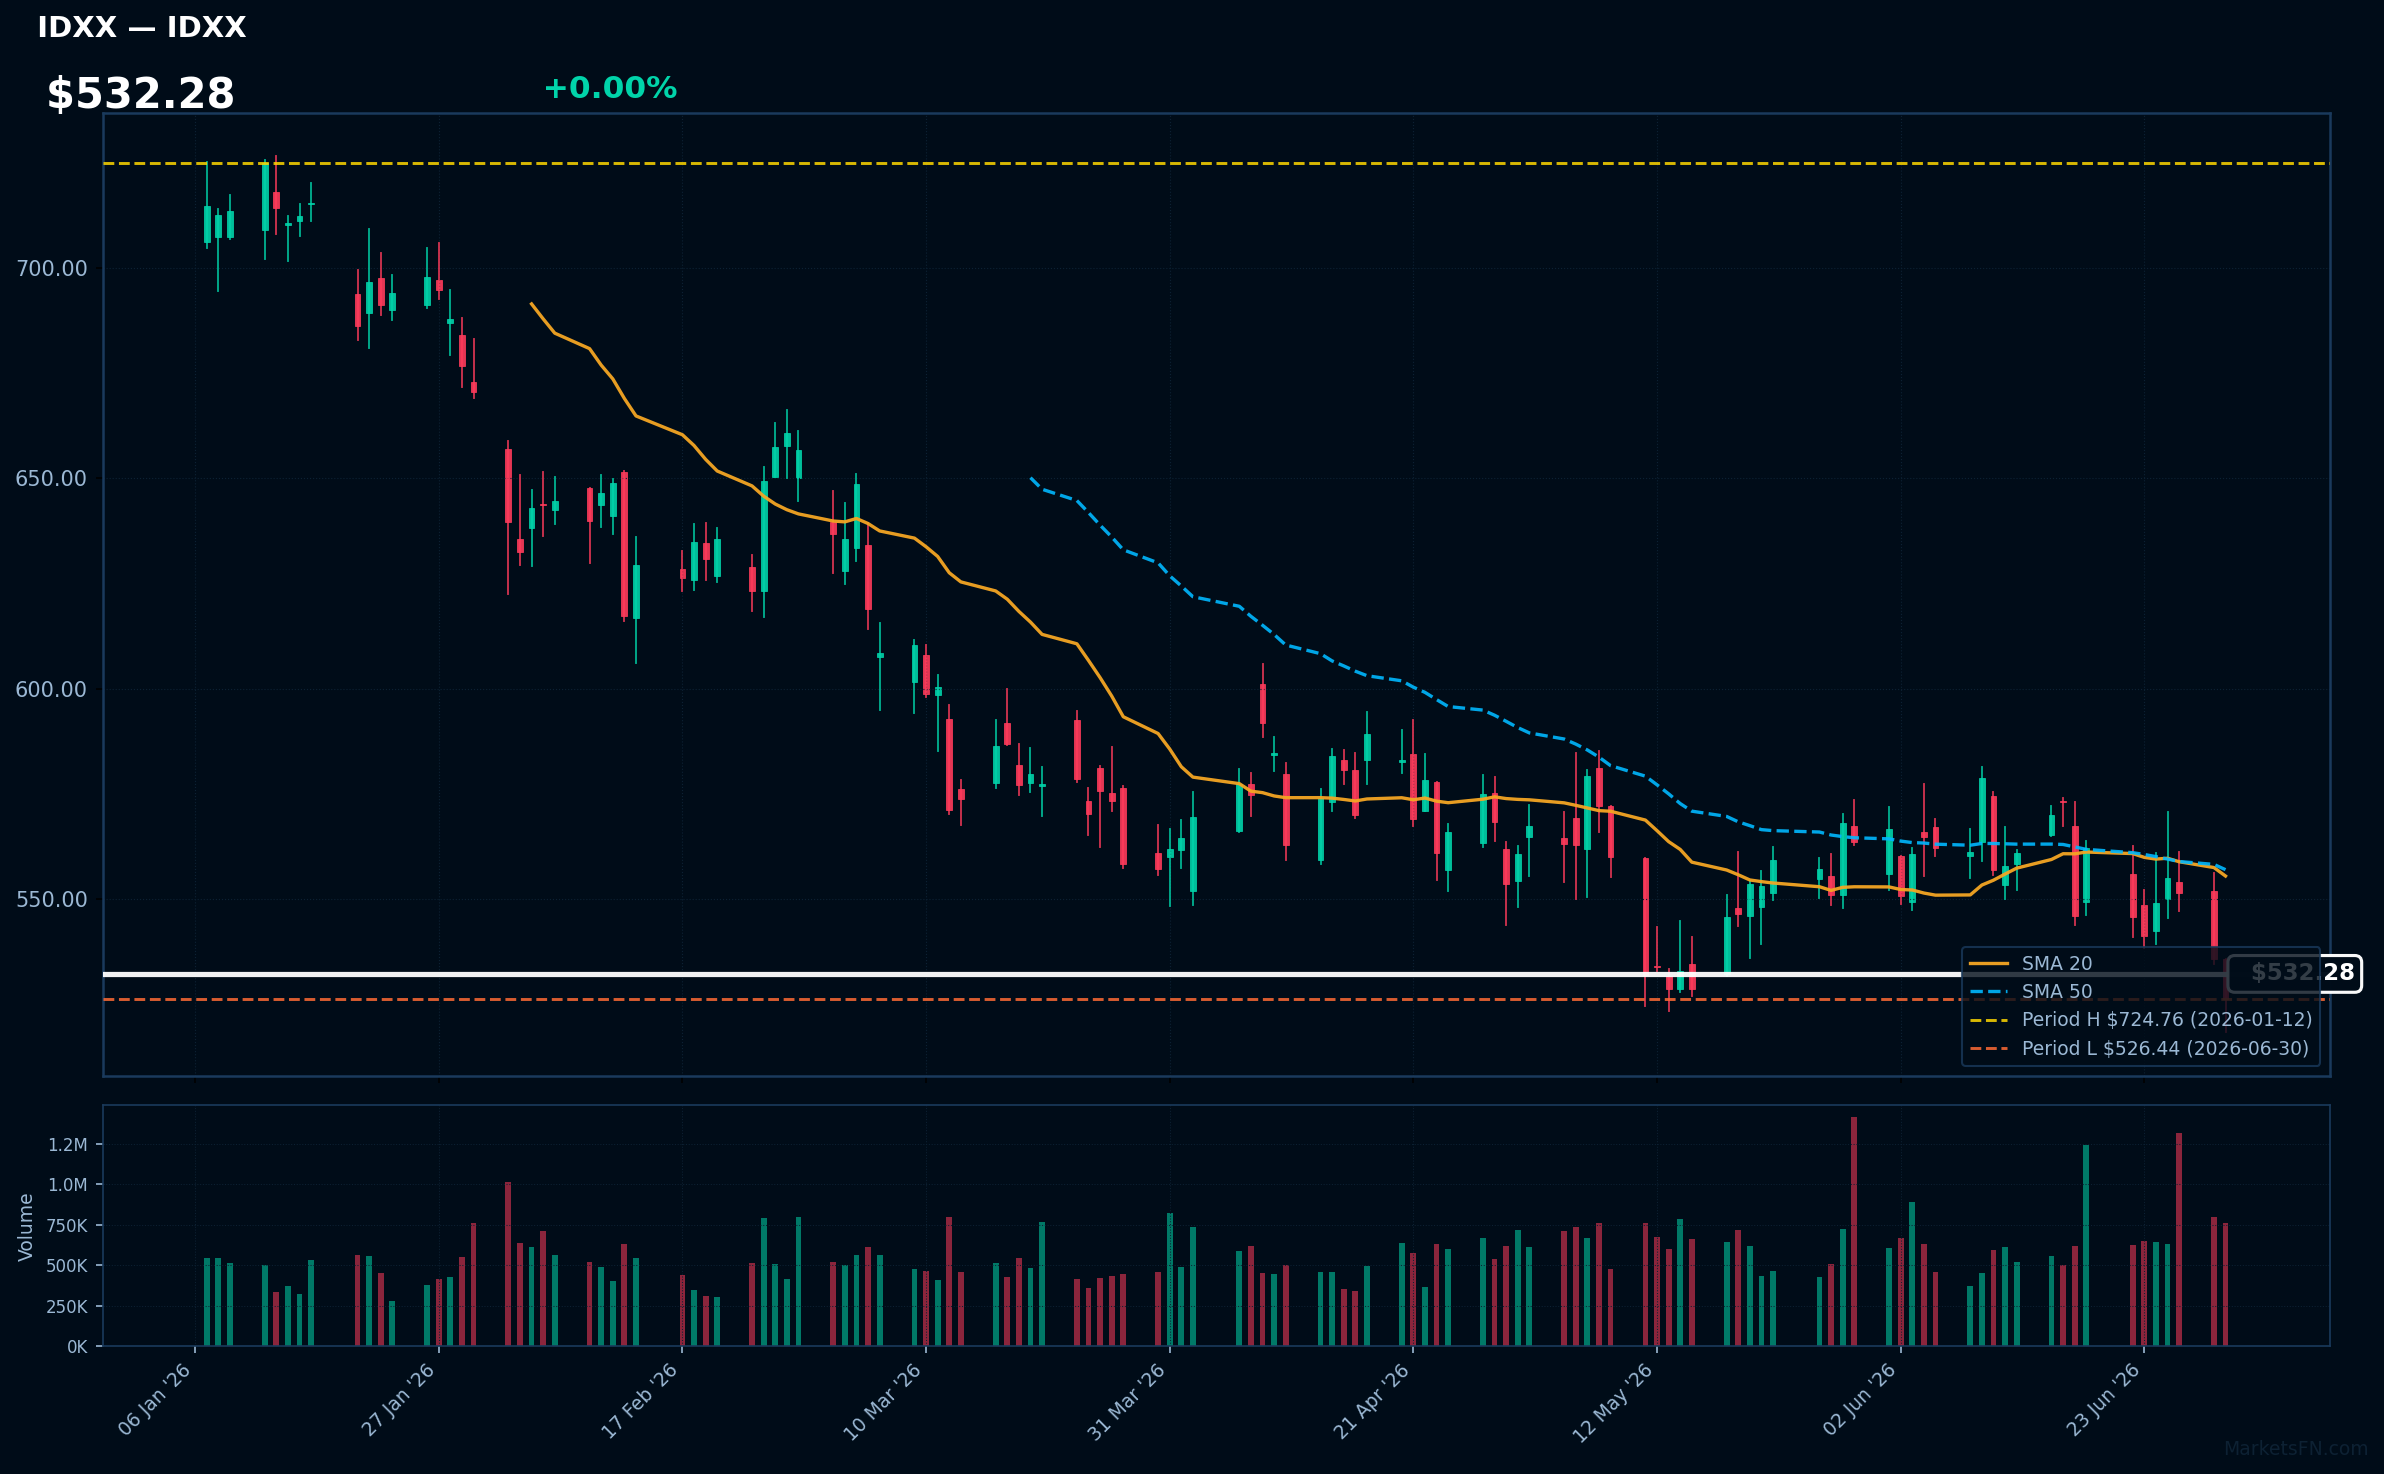
IDXX | Idexx Laboratories, Inc | Healthcare | Price Last: $526.44 | % Realized: -21.43% | RSI: 41.6 | % above MA200: -16.2% | Trend: Below MA20, MA50, MA200
Idexx Laboratories, Inc is a leading provider of veterinary diagnostic and software solutions. Investors should care due to its dominant position in the $7.5 billion global veterinary diagnostics market and growing recurring revenue from subscription-based services.
IDXX is testing major support at its 2026 YTD low with an RSI(14) of 41.6, indicating oversold conditions, and a bearish MA alignment: price ($532.28) < MA20 < MA50 < MA200, signaling a sustained downtrend and potential further downside.
Related headlines
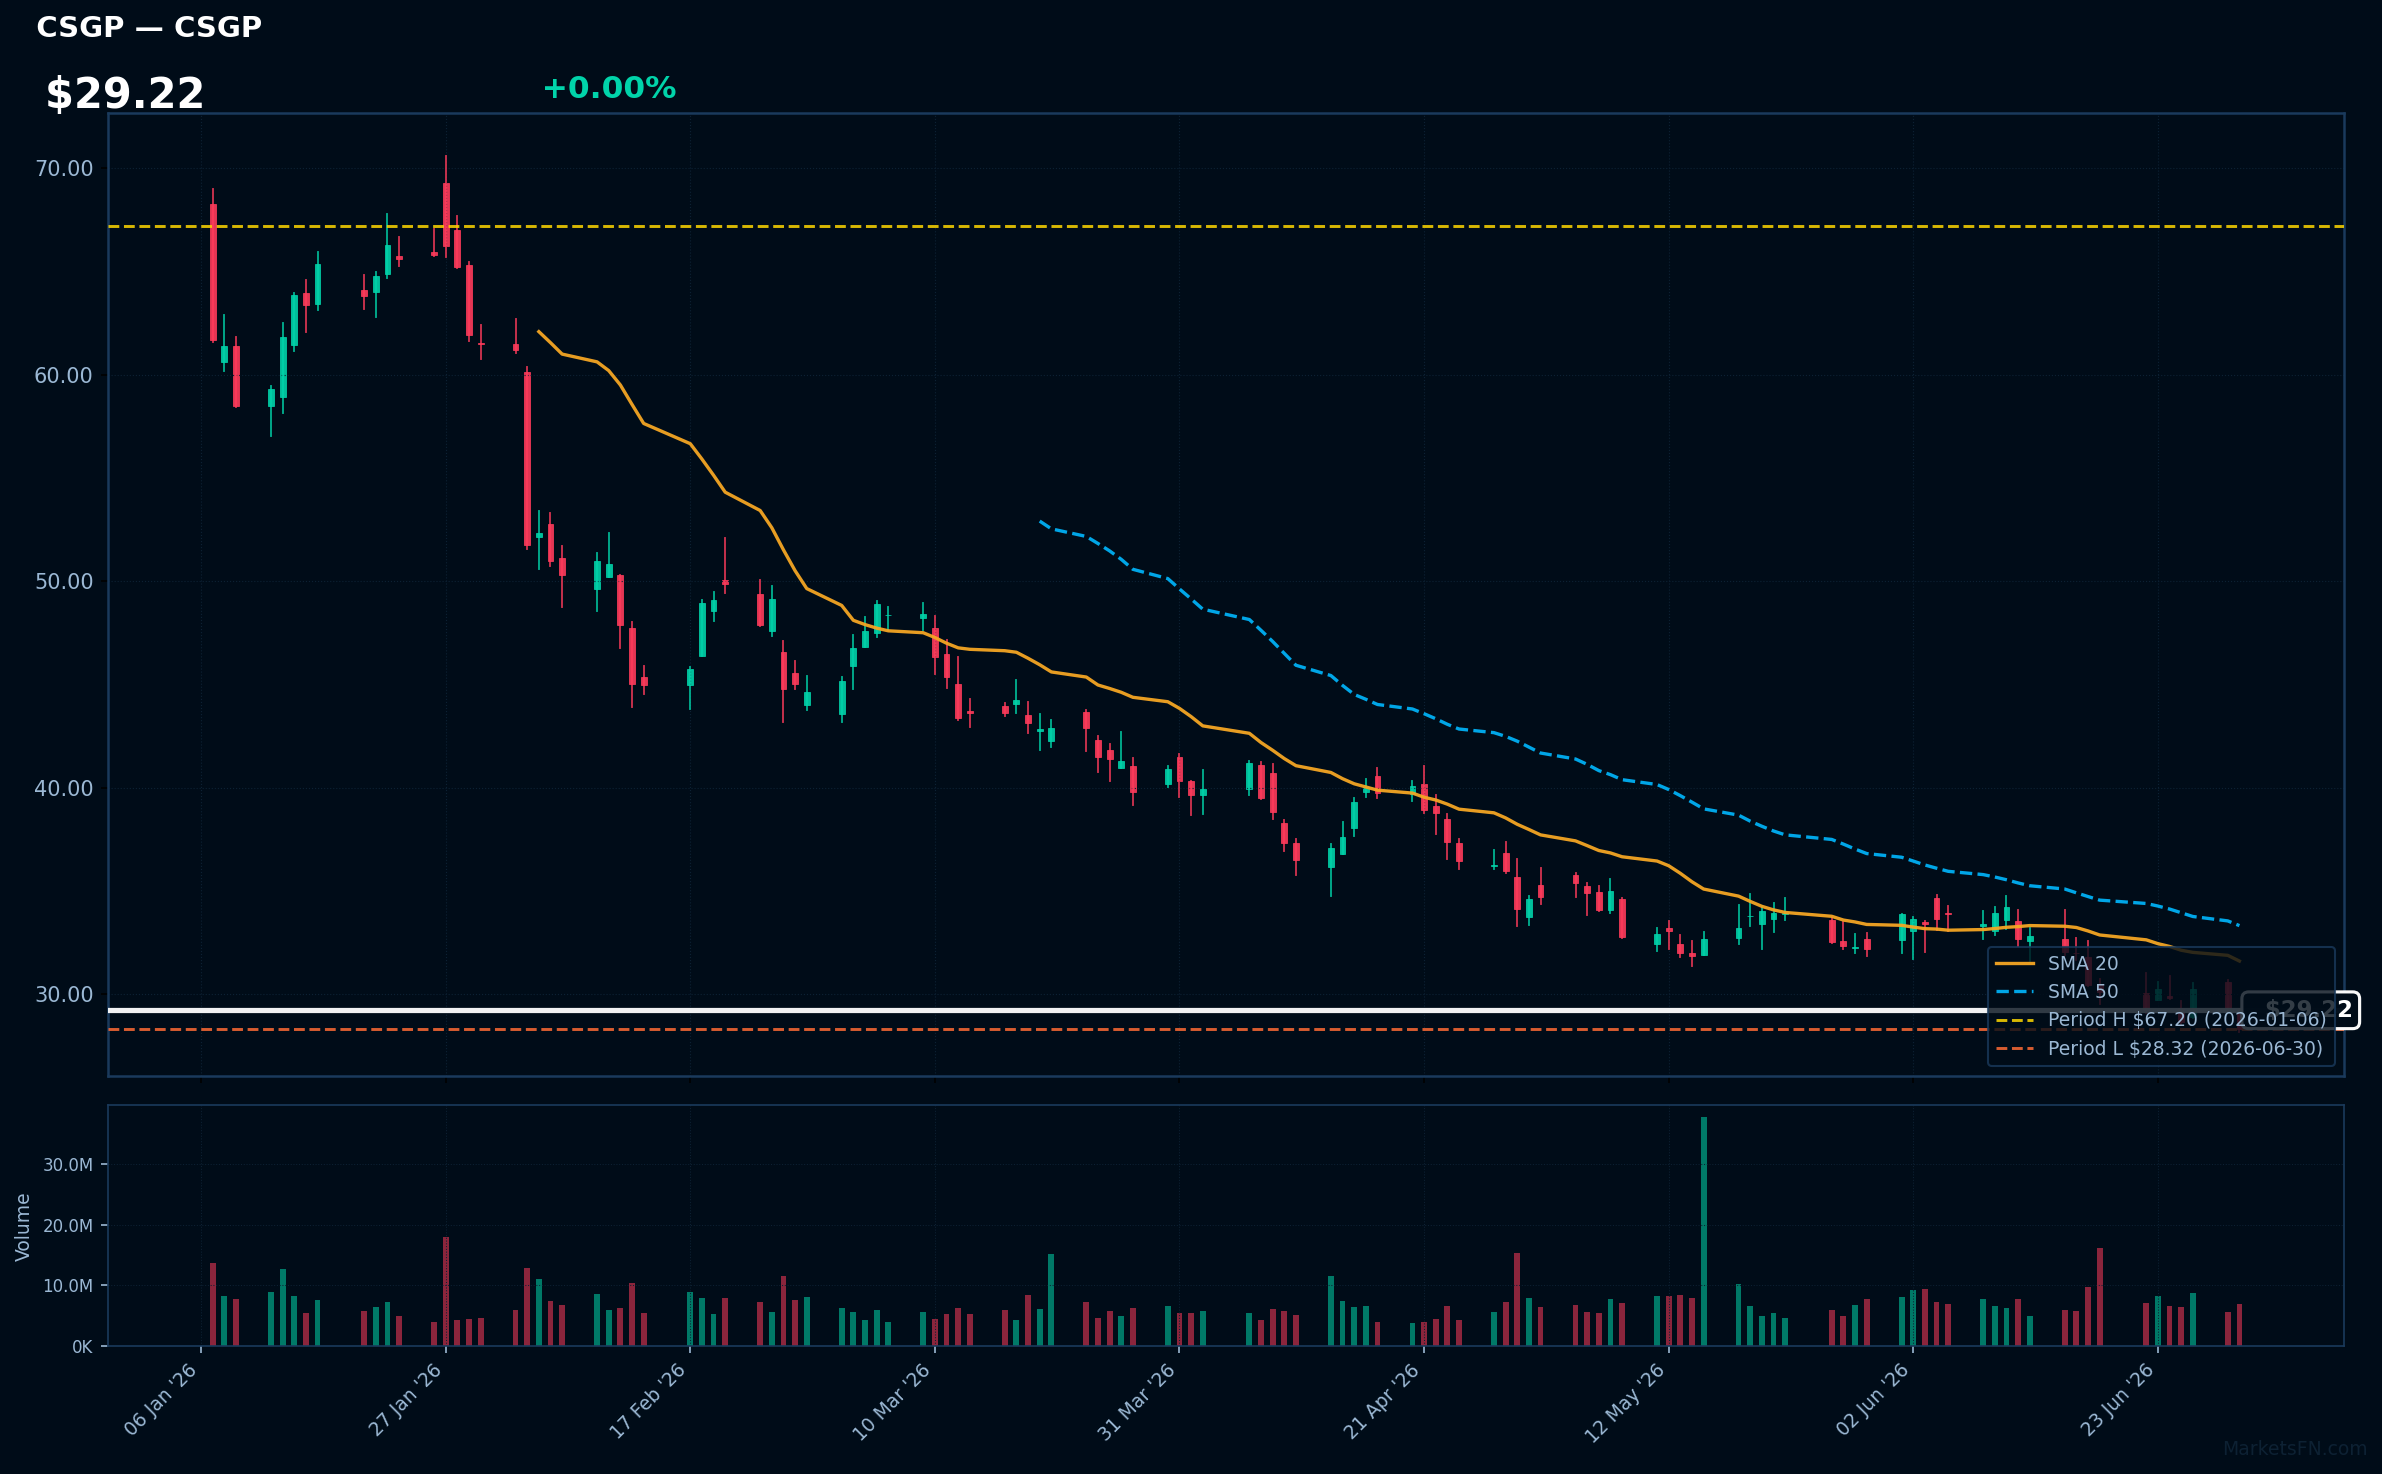
CSGP | Costar Group, Inc | Real Estate | Price Last: $28.32 | % Realized: -56.89% | RSI: 38.8 | % above MA200: -48.1% | Trend: Below MA20, MA50, MA200
Costar Group, Inc provides commercial real estate information, analytics, and marketing services. Investors should care because its data and platform influence property market dynamics, making it a key player in the $1.4 trillion US commercial real estate market.
CSGP is in a sustained downtrend with price ($29.22) below MA20, MA50, and MA200. RSI(14) is 38.8, near oversold territory. Testing its 2026 YTD low, the stock has lost 56.9% YTD, indicating significant technical weakness.
Related headlines
- CoStar Group Invests in Wikicasa, Italys Agent-Backed Real Estate Marketplace
- CoStar Group Stockholders Overwhelmingly Reelect Director Nominees and Support Say-on-Pay at Annual Meeting of Stockholders
- Austin, San Jose Lead Apartments.com and CoStars U.S. Multifamily Momentum Index
- CoStar Group Launches Apartments.com Ai, Redefining the Future of Apartment Search
Market Commentary
The Nasdaq 100 stocks listed are currently trading near their 2026 year-to-date (YTD) extremes, with some at their highs and others at their lows. Specifically, ASML, AMD, PANW, AMAT, and LRCX are at their 2026 YTD highs, while TMUS, PEP, ISRG, IDXX, and CSGP are at their 2026 YTD lows.
The technology sector themes driving these moves include semiconductor and cybersecurity trends, as evidenced by the presence of ASML, AMD, AMAT, LRCX, and PANW at their YTD highs. Macro conditions such as investor sentiment and market volatility likely play a role in the performance of these stocks. The presence of PEP and TMUS at their YTD lows may indicate a shift in consumer and telecom trends.
Investors and traders should watch the next data releases and earnings reports from these companies to gauge the sustainability of their current trends. Monitoring the overall market conditions and sector rotation will also be crucial in understanding the future direction of these stocks. The current extremes in these Nasdaq 100 stocks may indicate a turning point or a continuation of the existing trends.
Methodology: All 101 Nasdaq 100 constituents screened. Close prices downloaded from 2026-01-01. Period high = highest close since Jan 1 2026; period low = lowest close since Jan 1 2026. Distance = (current price / period extreme − 1) × 100. Technical indicators computed on up to 1 year of daily OHLCV data.
Disclaimer: For informational purposes only. Not investment advice. Past performance is not indicative of future results.