Nasdaq 100 Bull & Bear Radar — July 01, 2026
· Stocks · QuoteReporter
Nasdaq 100 Bull & Bear Radar — July 01, 2026
A daily technical sweep of 101 Nasdaq 100 constituents ranked by session performance, enriched with RSI, MA20/MA50/MA200 trend signals, Bloomberg-style charts, and recent news.
Index-Wide Breadth
| Constituents tracked | 101 |
| Advancing | 70 (69.3%) |
| Declining | 31 (30.7%) |
| Average daily change | +1.23% |
| Above MA200 | 13 (12.9%) |
Top 10 Gainers
Today's strongest Nasdaq 100 performers. Sector leadership: Technology (5), Communication Services (2), Consumer Defensive (1), Industrials (1), Consumer Cyclical (1).
| Ticker | Company | Sector | Price | Day % | 1W % | 1M % | RSI | vs MA200 | Trend |
|---|---|---|---|---|---|---|---|---|---|
| CRWD | Crowdstrike Holdings Inc | Technology | $778.47 | +11.04% | +15.28% | +16.04% | 71.8 | +56.4% | Above MA20, MA50, MA200 |
| MSTR | Strategy Inc | Technology | $95.58 | +9.95% | +1.44% | -36.25% | 36.8 | -47.6% | Below MA20, MA50, MA200 |
| META | Meta Platforms Inc | Communication Services | $611.14 | +8.49% | +9.63% | +1.81% | 58.1 | -5.6% | Above MA20, MA50 · Below MA200 |
| APP | Applovin Corp | Communication Services | $555.56 | +7.83% | +19.49% | -9.47% | 61.0 | +2.8% | Above MA20, MA50, MA200 |
| PLTR | Palantir Technologies Inc | Technology | $125.14 | +7.26% | +10.30% | -22.07% | 47.9 | -20.9% | Below MA20, MA50, MA200 |
| TEAM | Atlassian Corporation | Technology | $83.29 | +7.07% | +2.13% | -28.17% | 47.4 | -28.3% | Below MA20, MA50, MA200 |
| KHC | Kraft Heinz Co | Consumer Defensive | $25.03 | +5.97% | +9.11% | +5.92% | 62.7 | +4.4% | Above MA20, MA50, MA200 |
| AXON | Axon Enterprise Inc | Industrials | $593.68 | +5.90% | +29.98% | +24.49% | 76.6 | +11.1% | Above MA20, MA50, MA200 |
| PDD | PDD Holdings Inc ADR | Consumer Cyclical | $80.40 | +5.40% | +6.15% | -7.84% | 45.2 | -26.0% | Above MA20 · Below MA50, MA200 |
| SHOP | Shopify Inc | Technology | $120.32 | +5.38% | +5.36% | -3.09% | 59.6 | -11.8% | Above MA20, MA50 · Below MA200 |
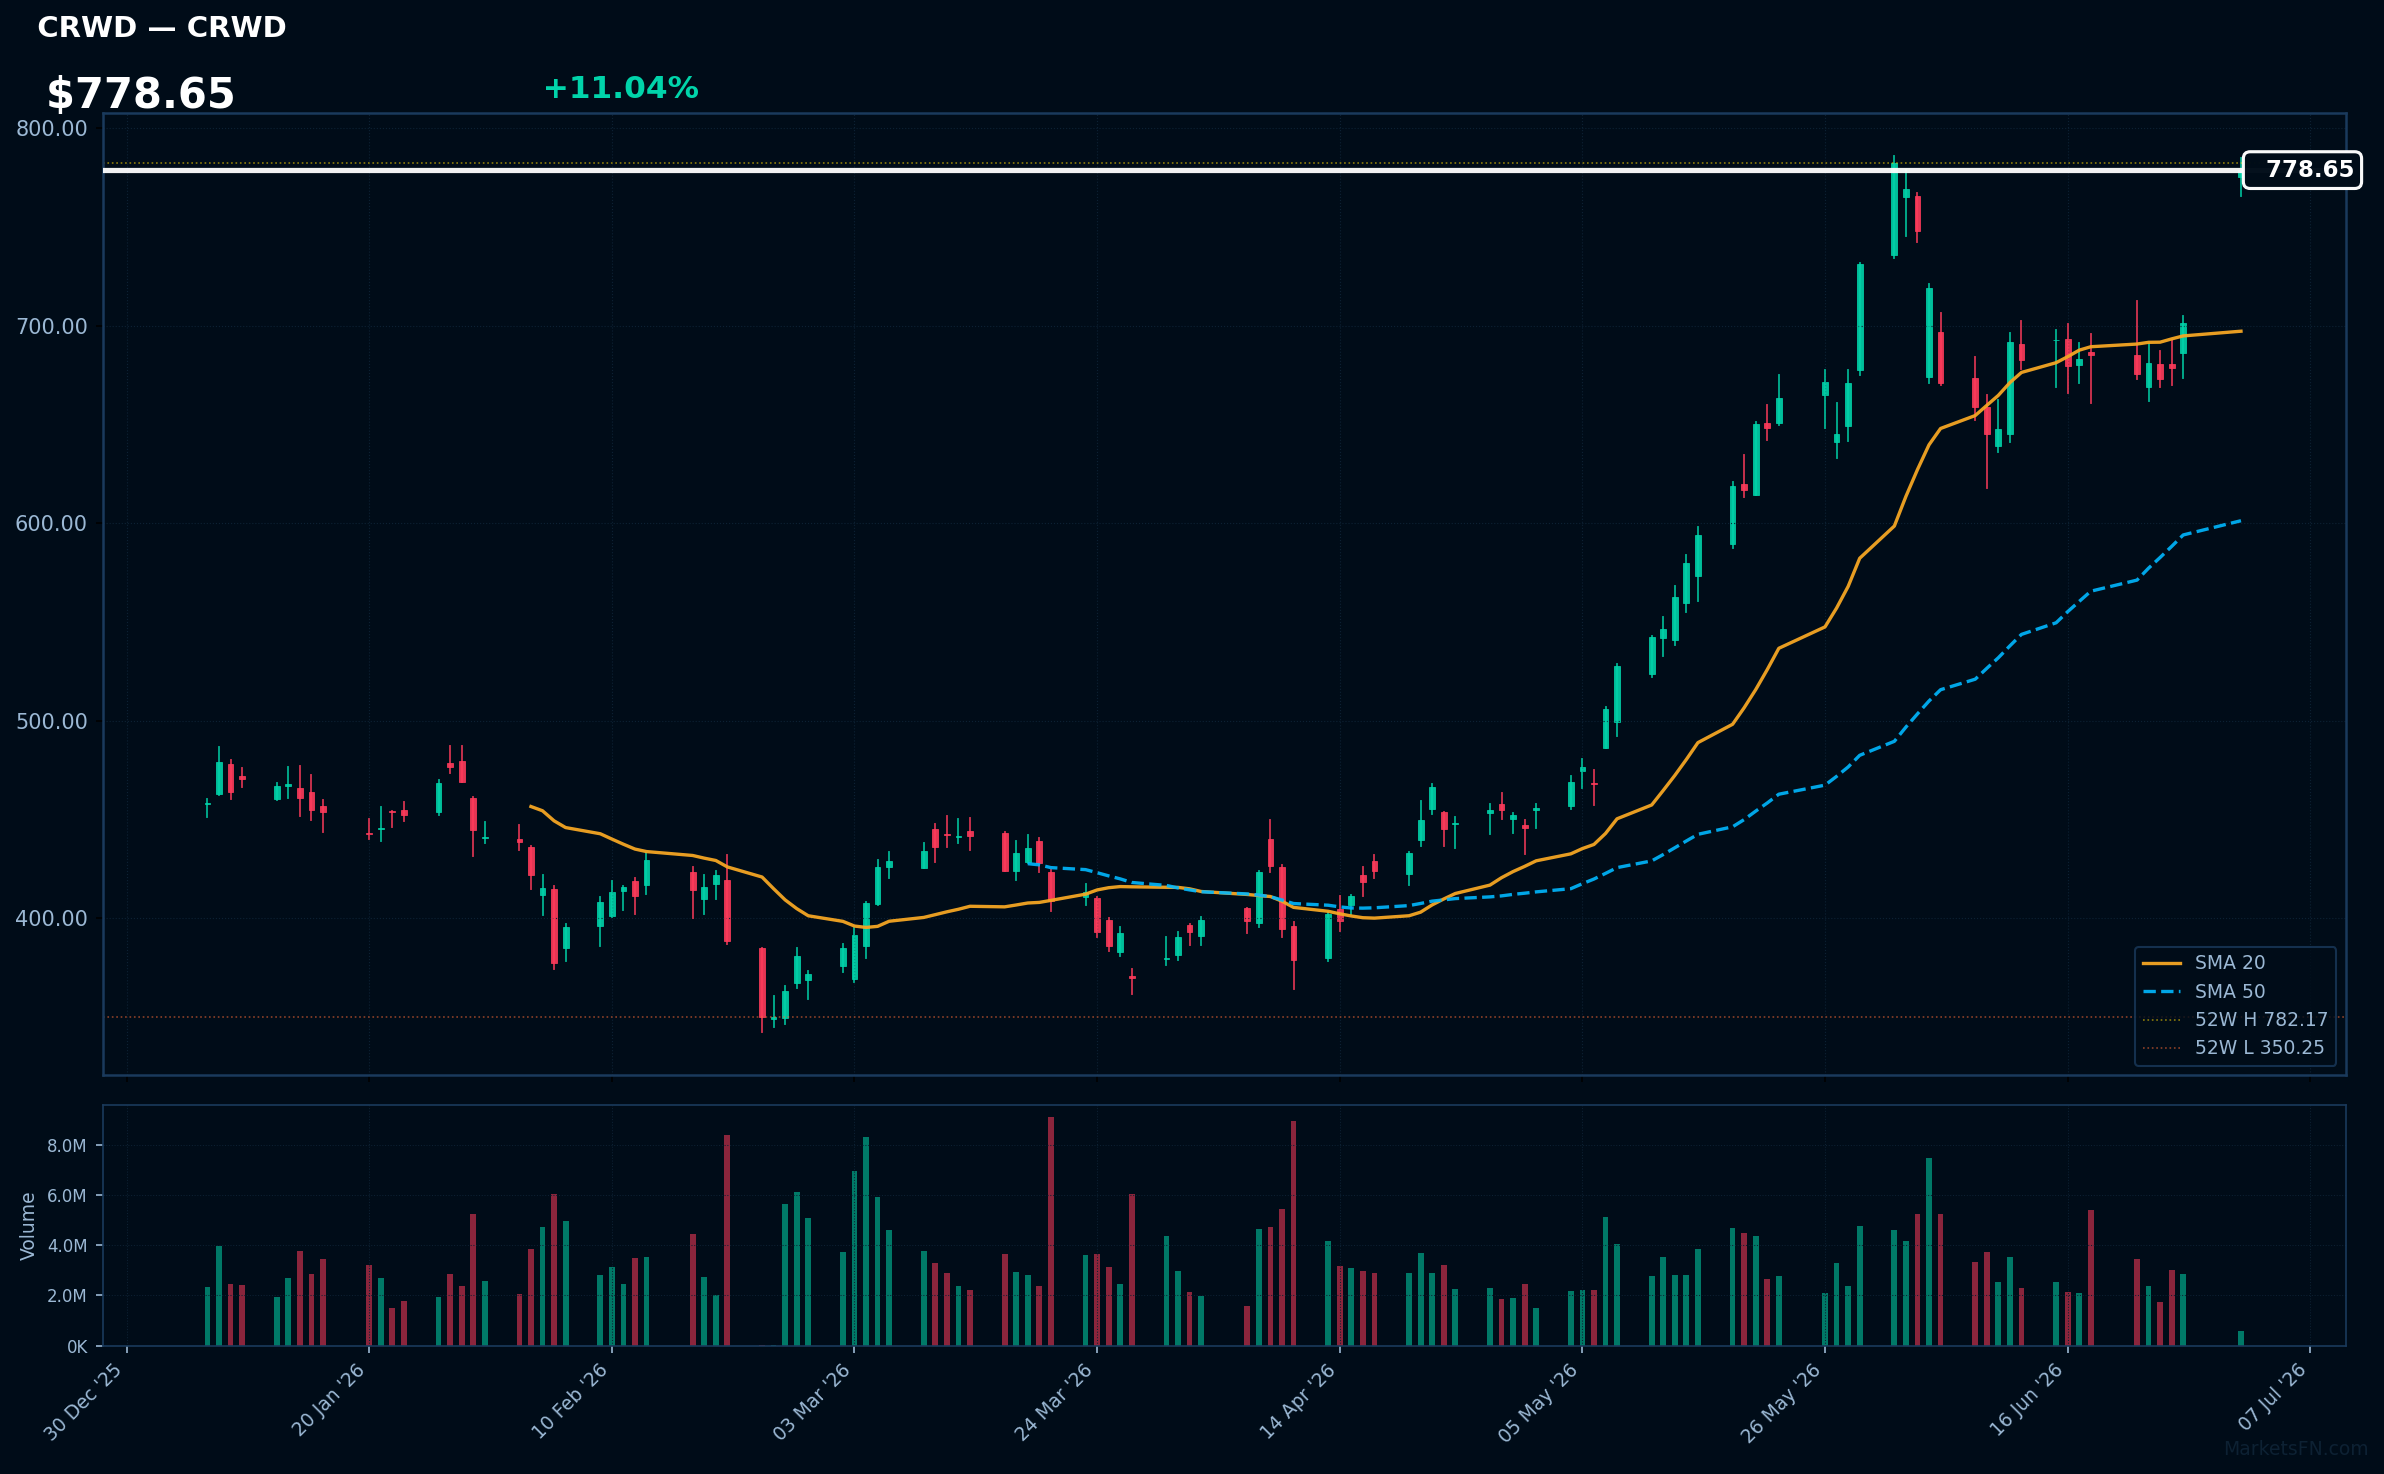
CRWD | Crowdstrike Holdings Inc | Technology | Price: $778.47 | Day: +11.04% | 1W: +15.28% | 1M: +16.04% | RSI: 71.8 | vs MA200: +56.4% | Trend: Above MA20, MA50, MA200
Recent headlines (last 12h)
- Data Shows Why This Software ETF is Poised to Rally
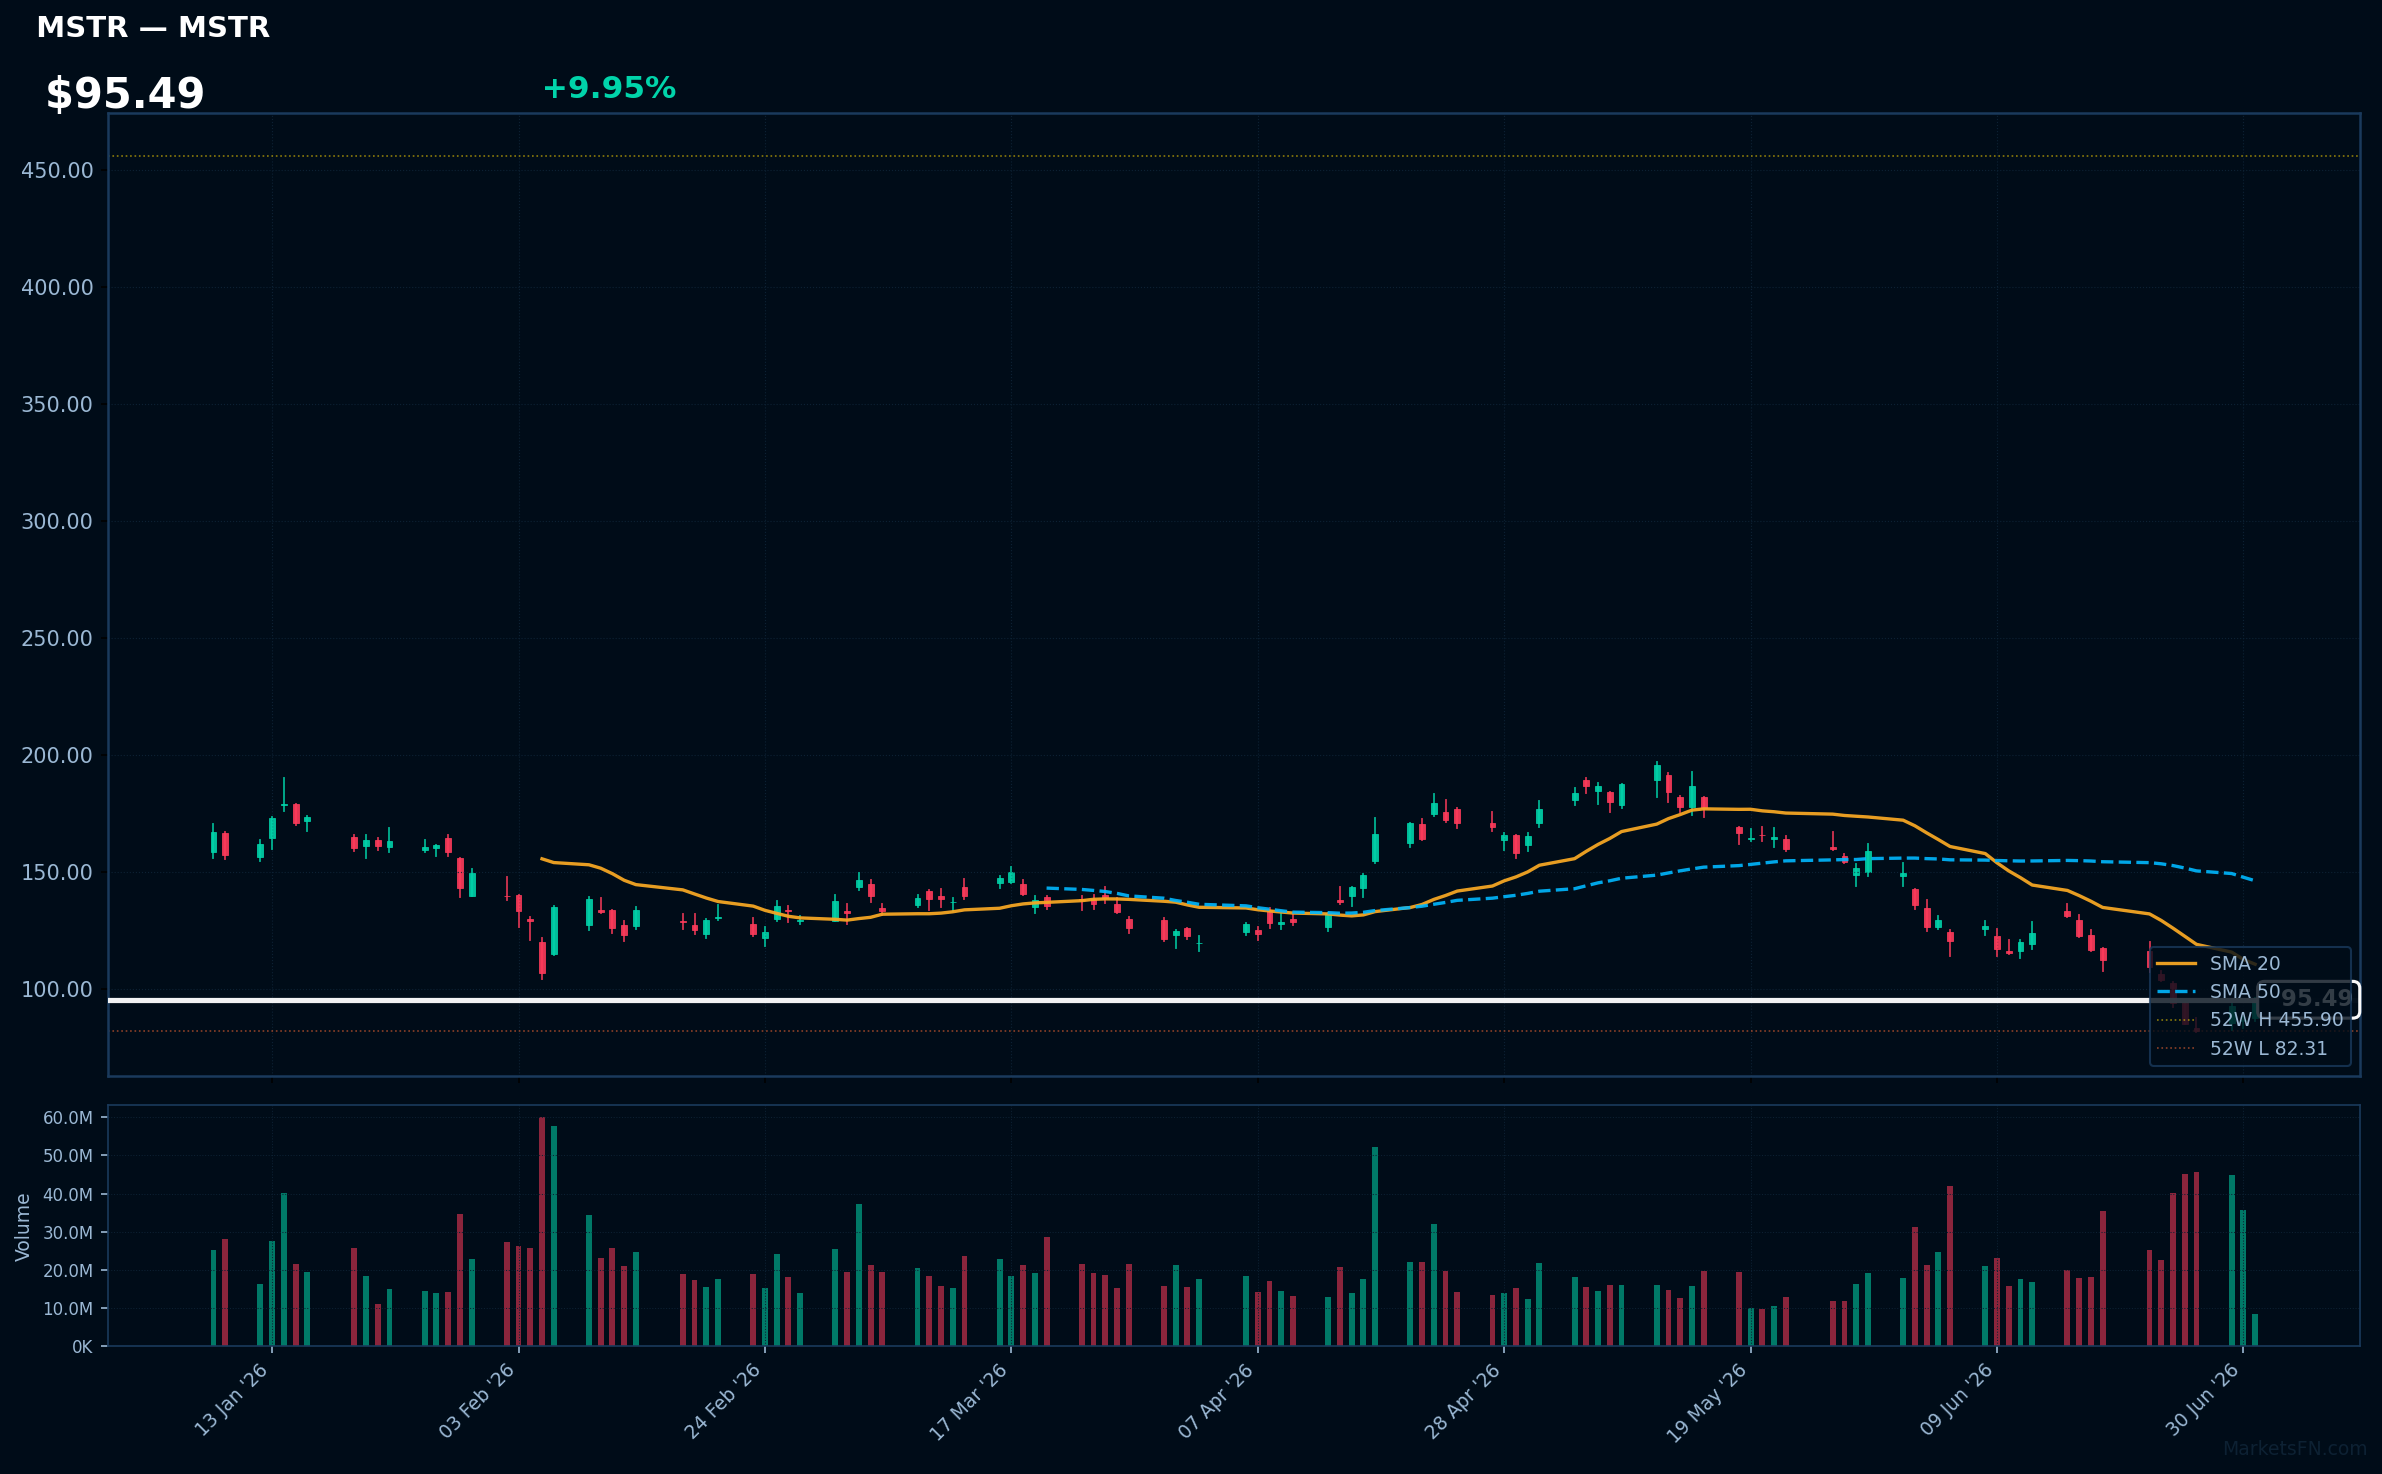
MSTR | Strategy Inc | Technology | Price: $95.58 | Day: +9.95% | 1W: +1.44% | 1M: -36.25% | RSI: 36.8 | vs MA200: -47.6% | Trend: Below MA20, MA50, MA200
Recent headlines (last 12h)
- Citi cuts Strategy target as Bitcoin forecast revised lower
- Bitcoin Price Could Fall To $1,000, Claims Peter Schiff, as Citi Cuts Its 12-Month BTC Prediction
- Data Shows Why This Software ETF is Poised to Rally
- Stock Markets Enter a Crucial Period as Investors Play Defense to Inflation Risks
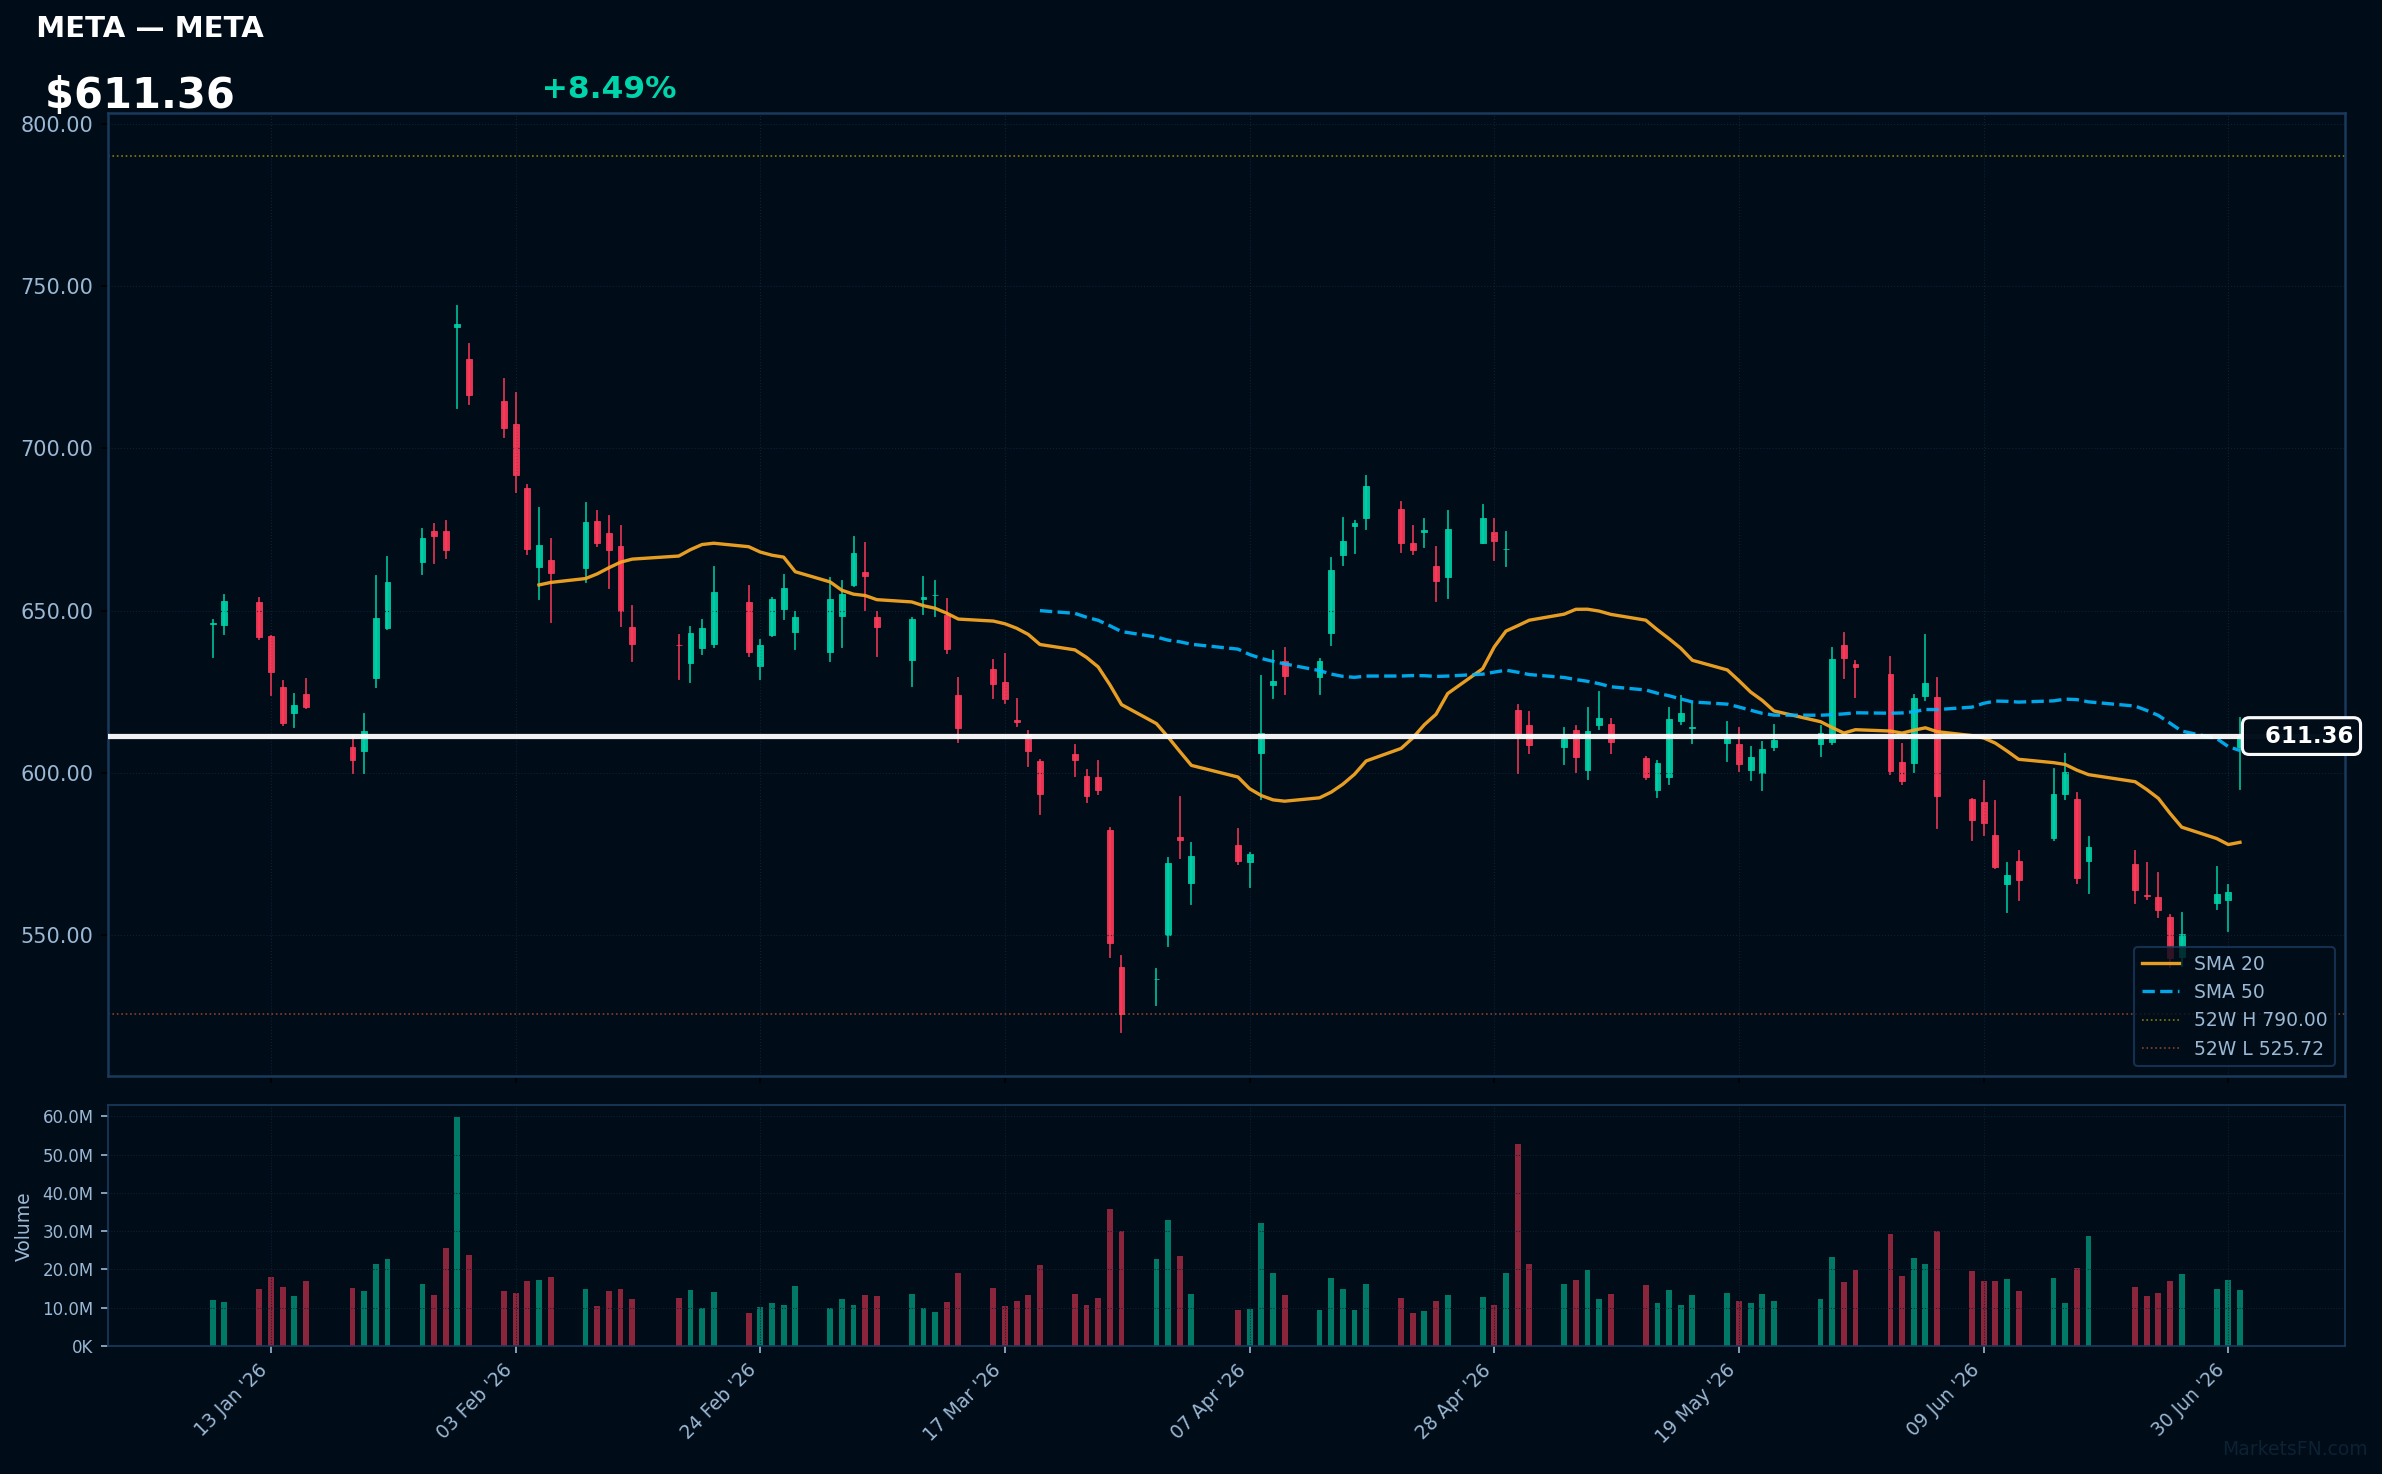
META | Meta Platforms Inc | Communication Services | Price: $611.14 | Day: +8.49% | 1W: +9.63% | 1M: +1.81% | RSI: 58.1 | vs MA200: -5.6% | Trend: Above MA20, MA50 · Below MA200
Recent headlines (last 12h)
- Meta stock pops on news it will reportedly start a cloud computing business
- Scared of an AI stock bubble? Then don't look at this chart.
- Meta shares jump on plans to commercialise excess AI computing capacity
- Meta turns its AI spending spree into a business of its own
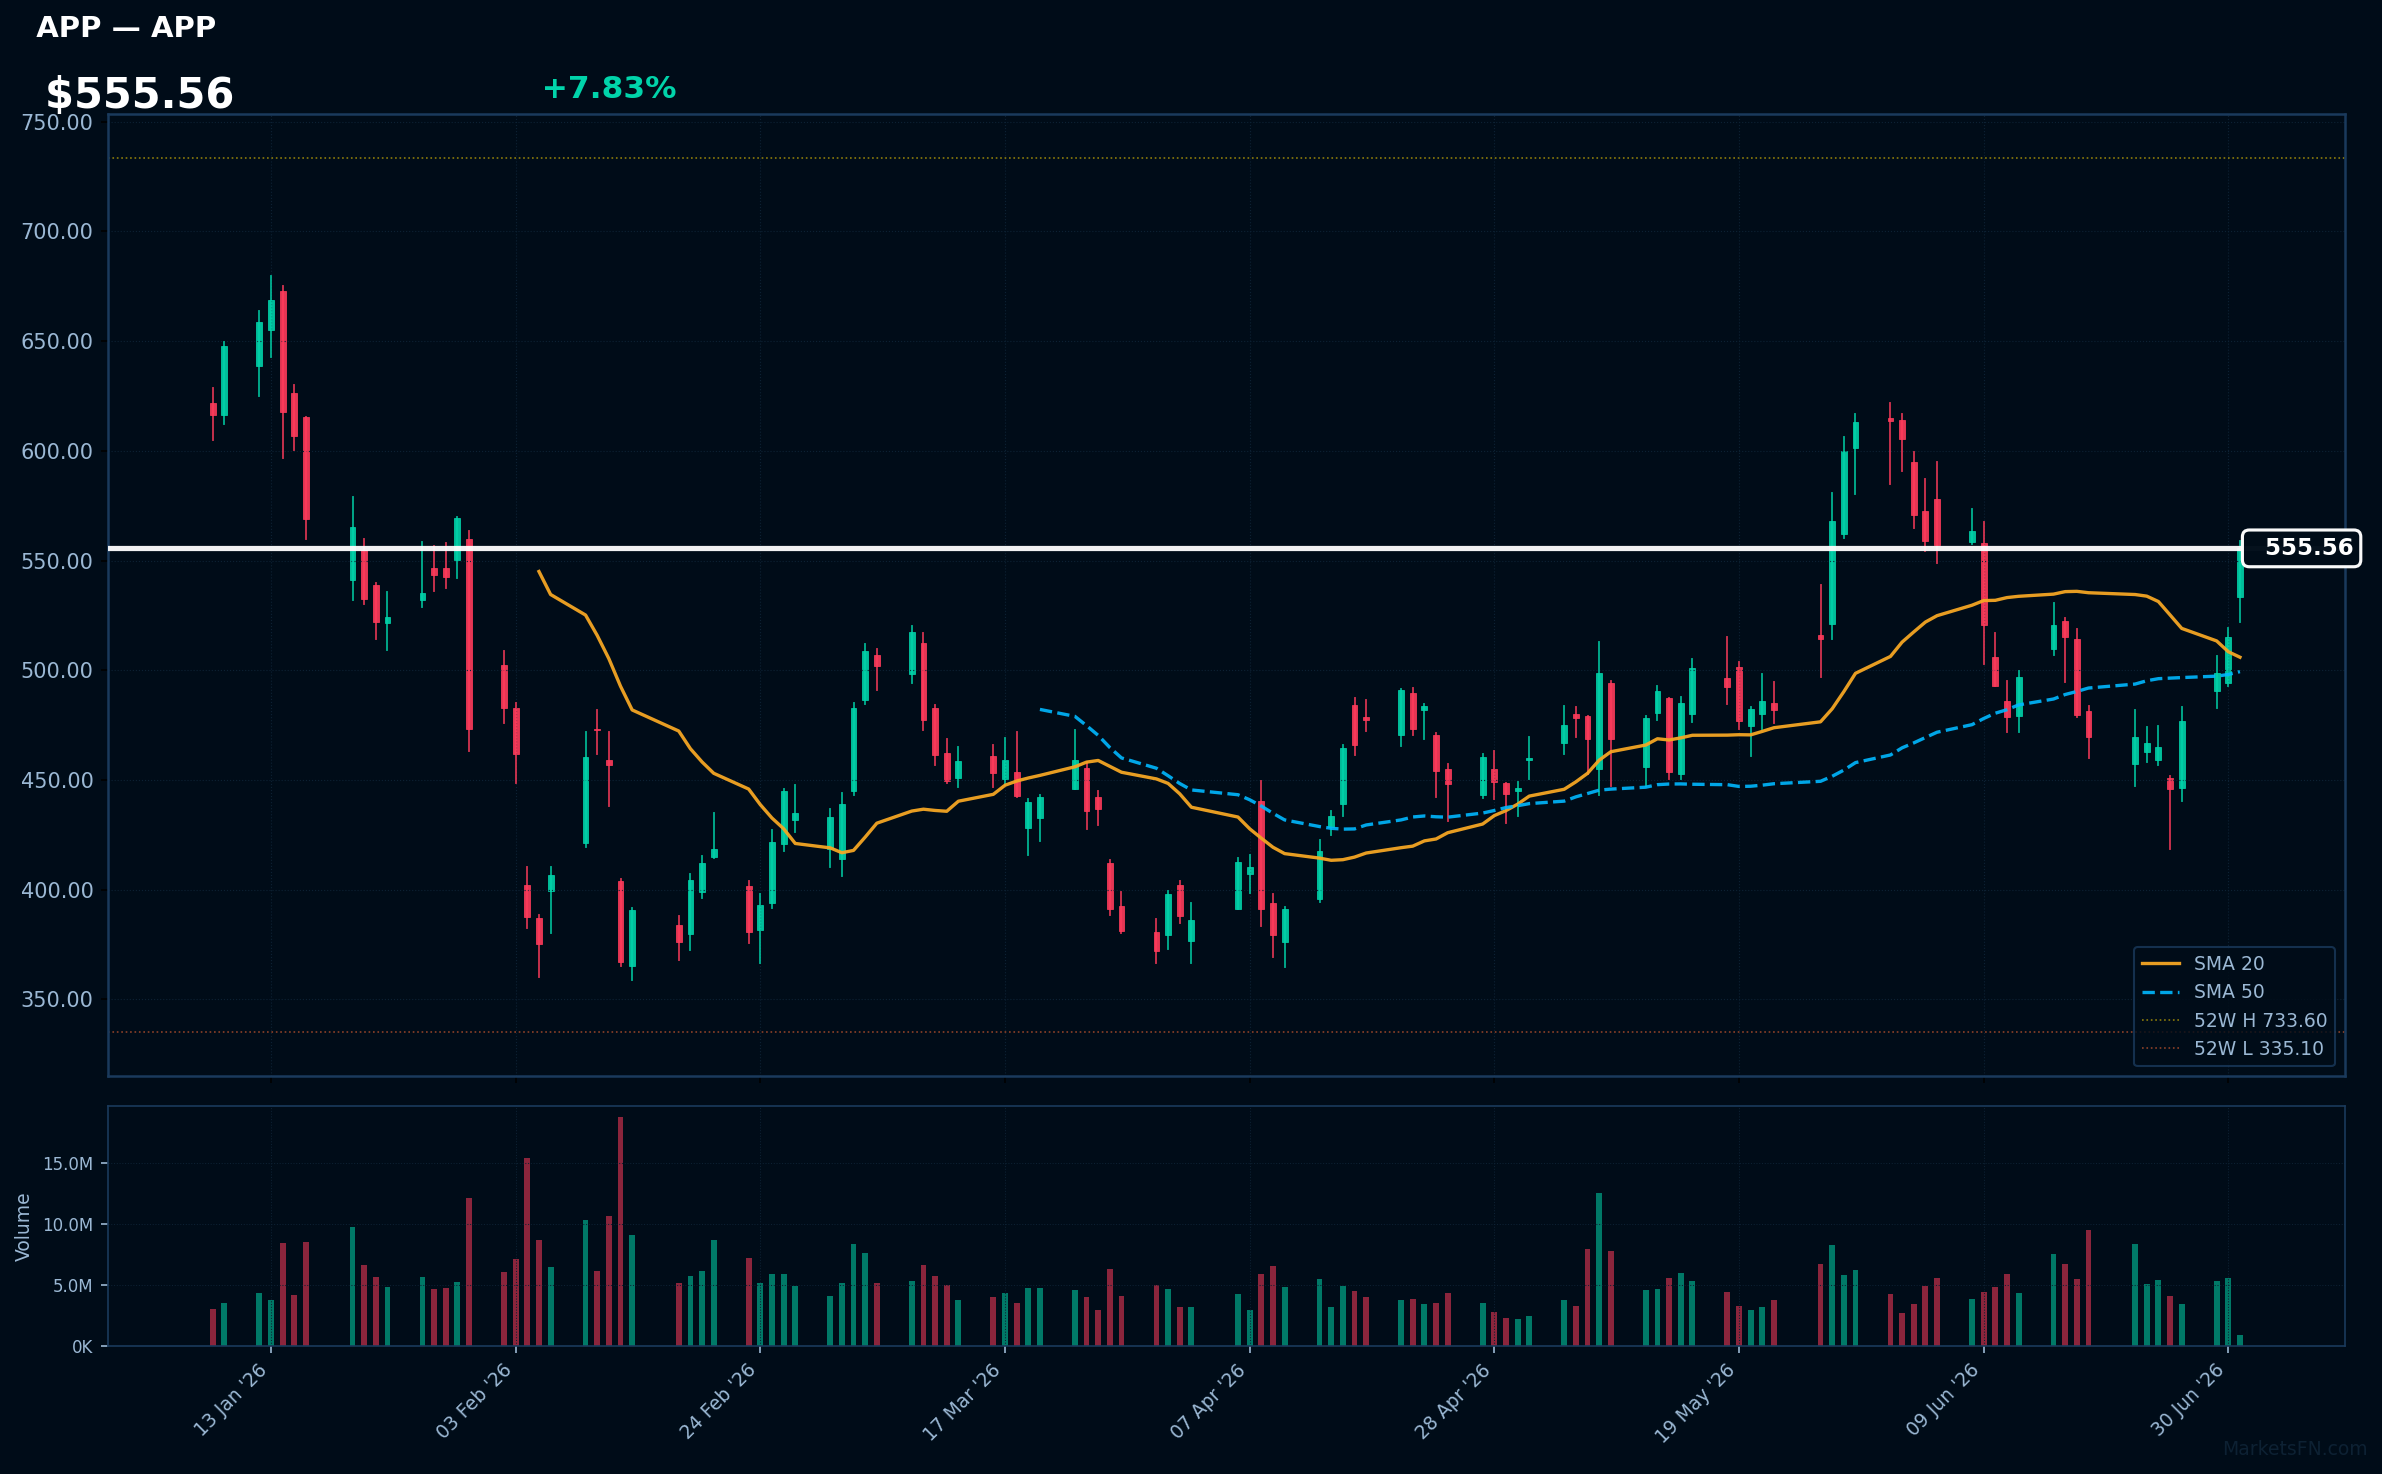
APP | Applovin Corp | Communication Services | Price: $555.56 | Day: +7.83% | 1W: +19.49% | 1M: -9.47% | RSI: 61.0 | vs MA200: +2.8% | Trend: Above MA20, MA50, MA200
Recent headlines (last 12h)
- Data Shows Why This Software ETF is Poised to Rally
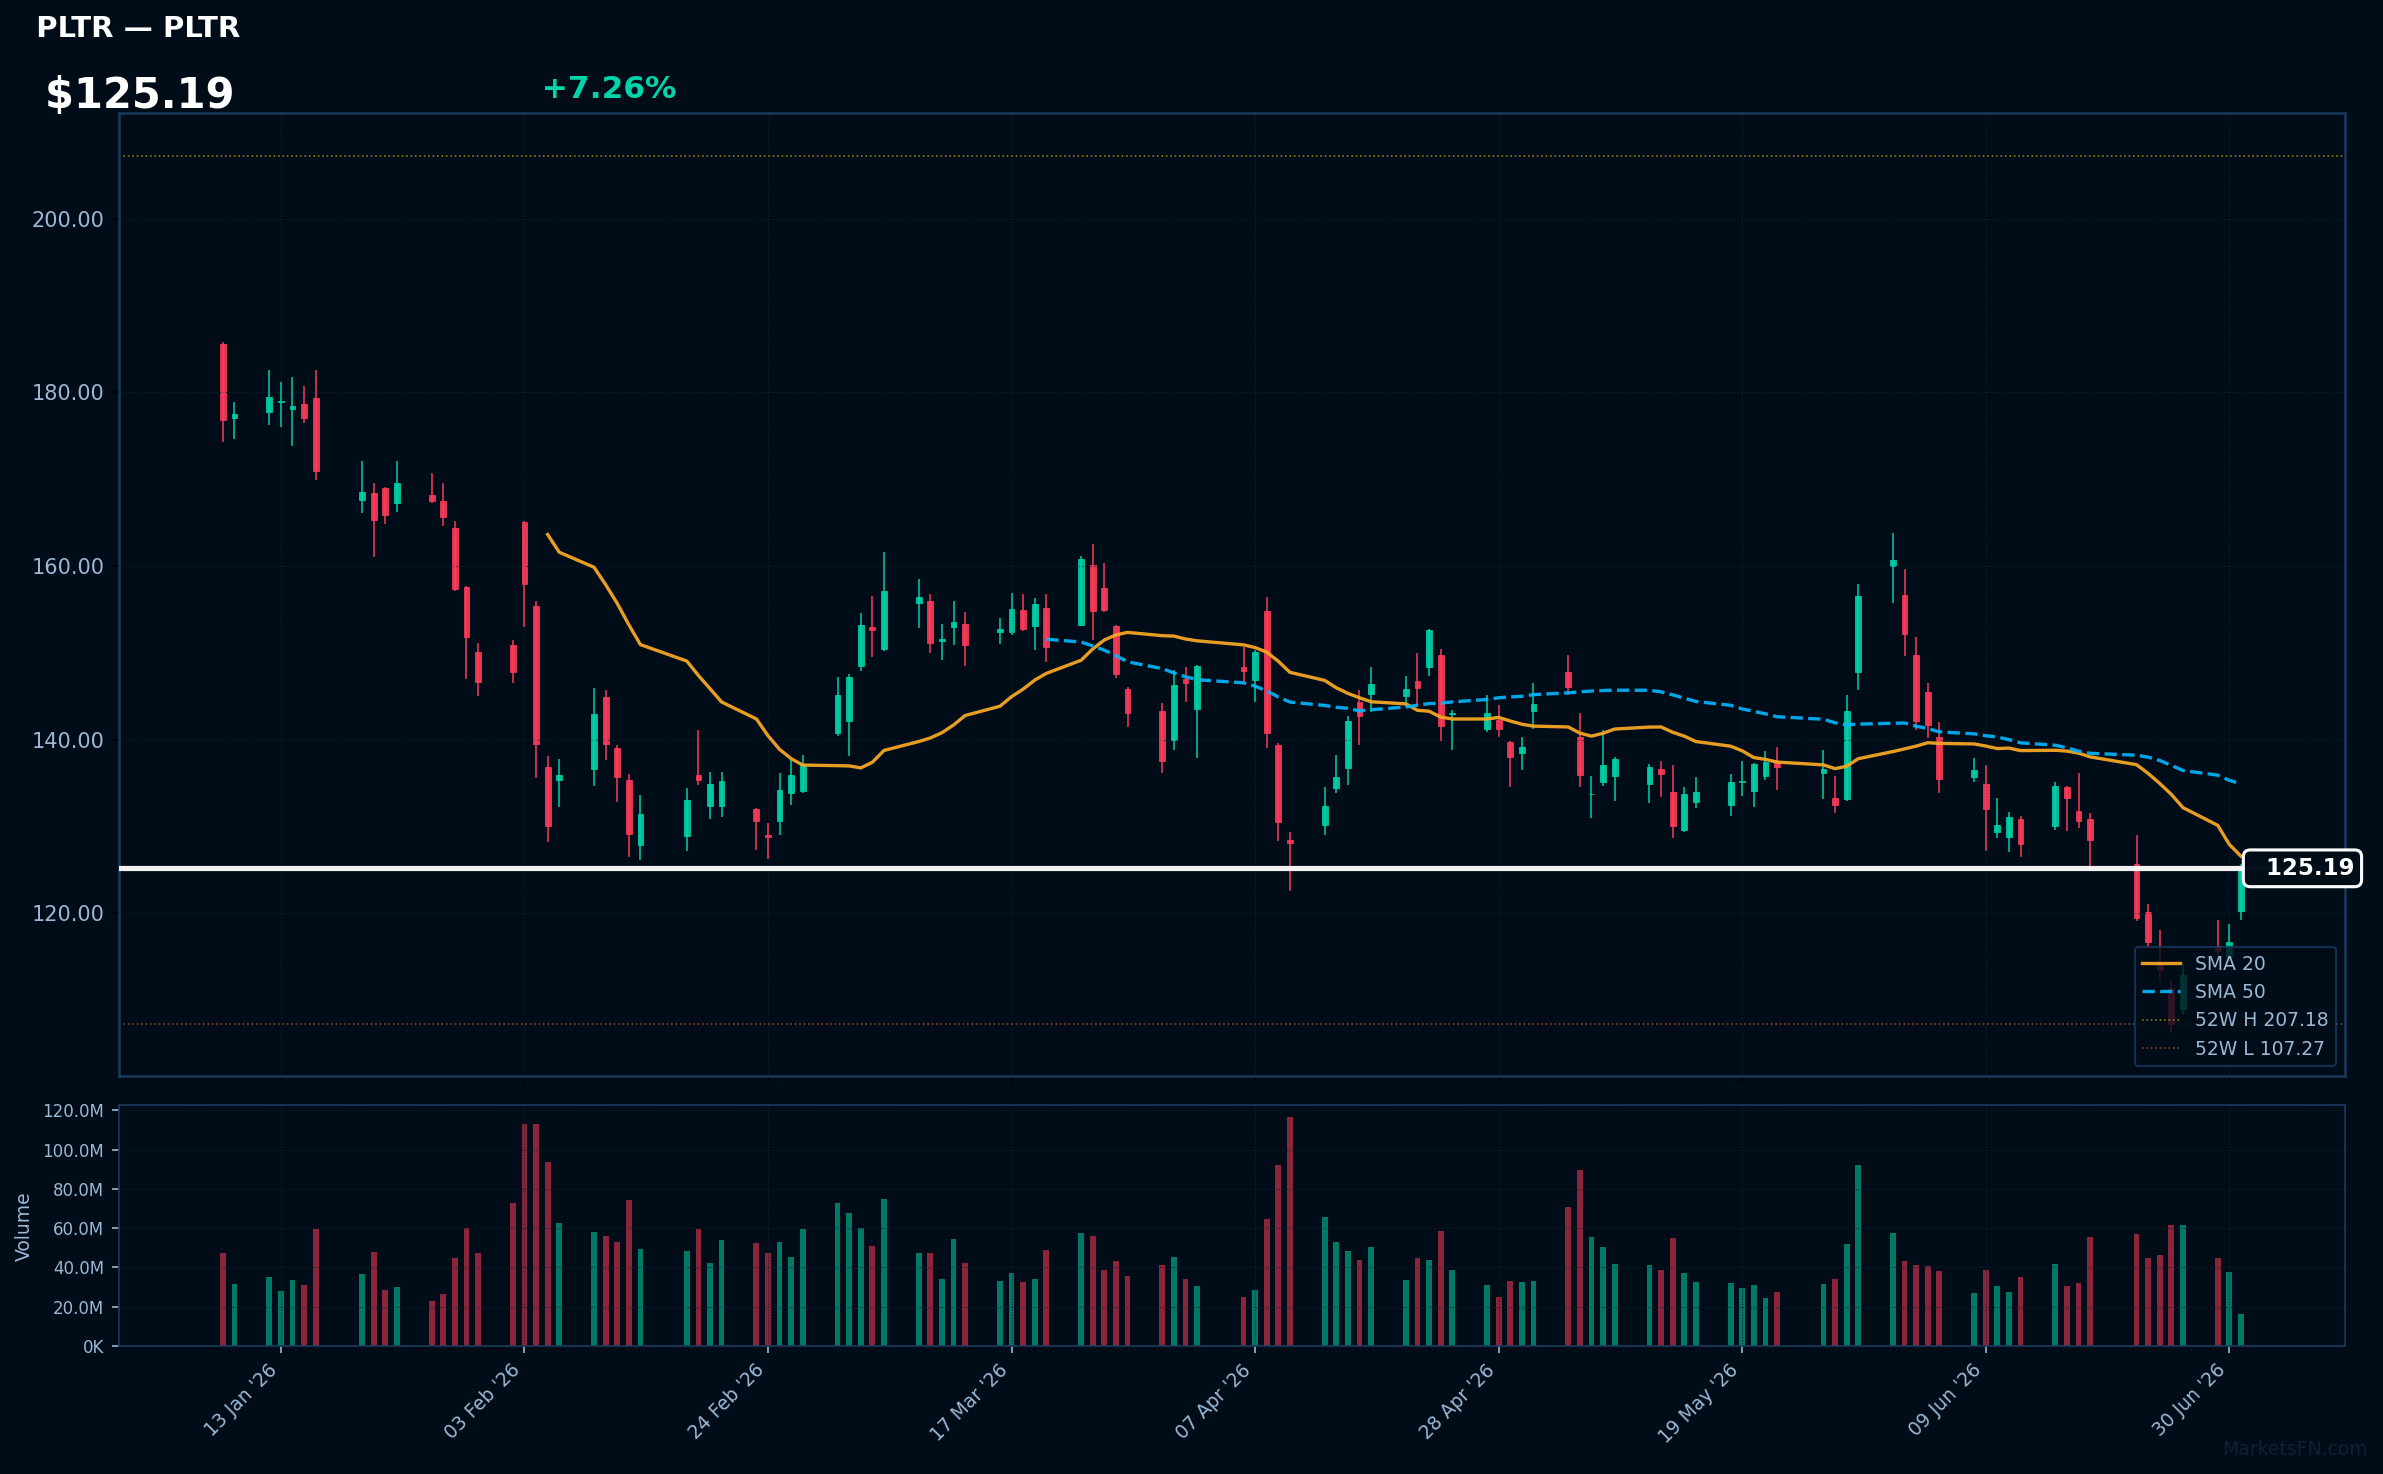
PLTR | Palantir Technologies Inc | Technology | Price: $125.14 | Day: +7.26% | 1W: +10.30% | 1M: -22.07% | RSI: 47.9 | vs MA200: -20.9% | Trend: Below MA20, MA50, MA200
Recent headlines (last 12h)
- Alex Karp Touts Palantir-Nvidia Partnership For Secure AI, Criticizes OpenAI And Anthropic Over Lack Of IP Protection
- President Trump Reveals Million-Dollar Apple and Palantir Stakes
- Cathie Wood's Biggest Portfolio Moves Reveal Where She's Betting Next
- Trump's Crypto Billions, Apple Stock, and More From His Latest Financial Filing
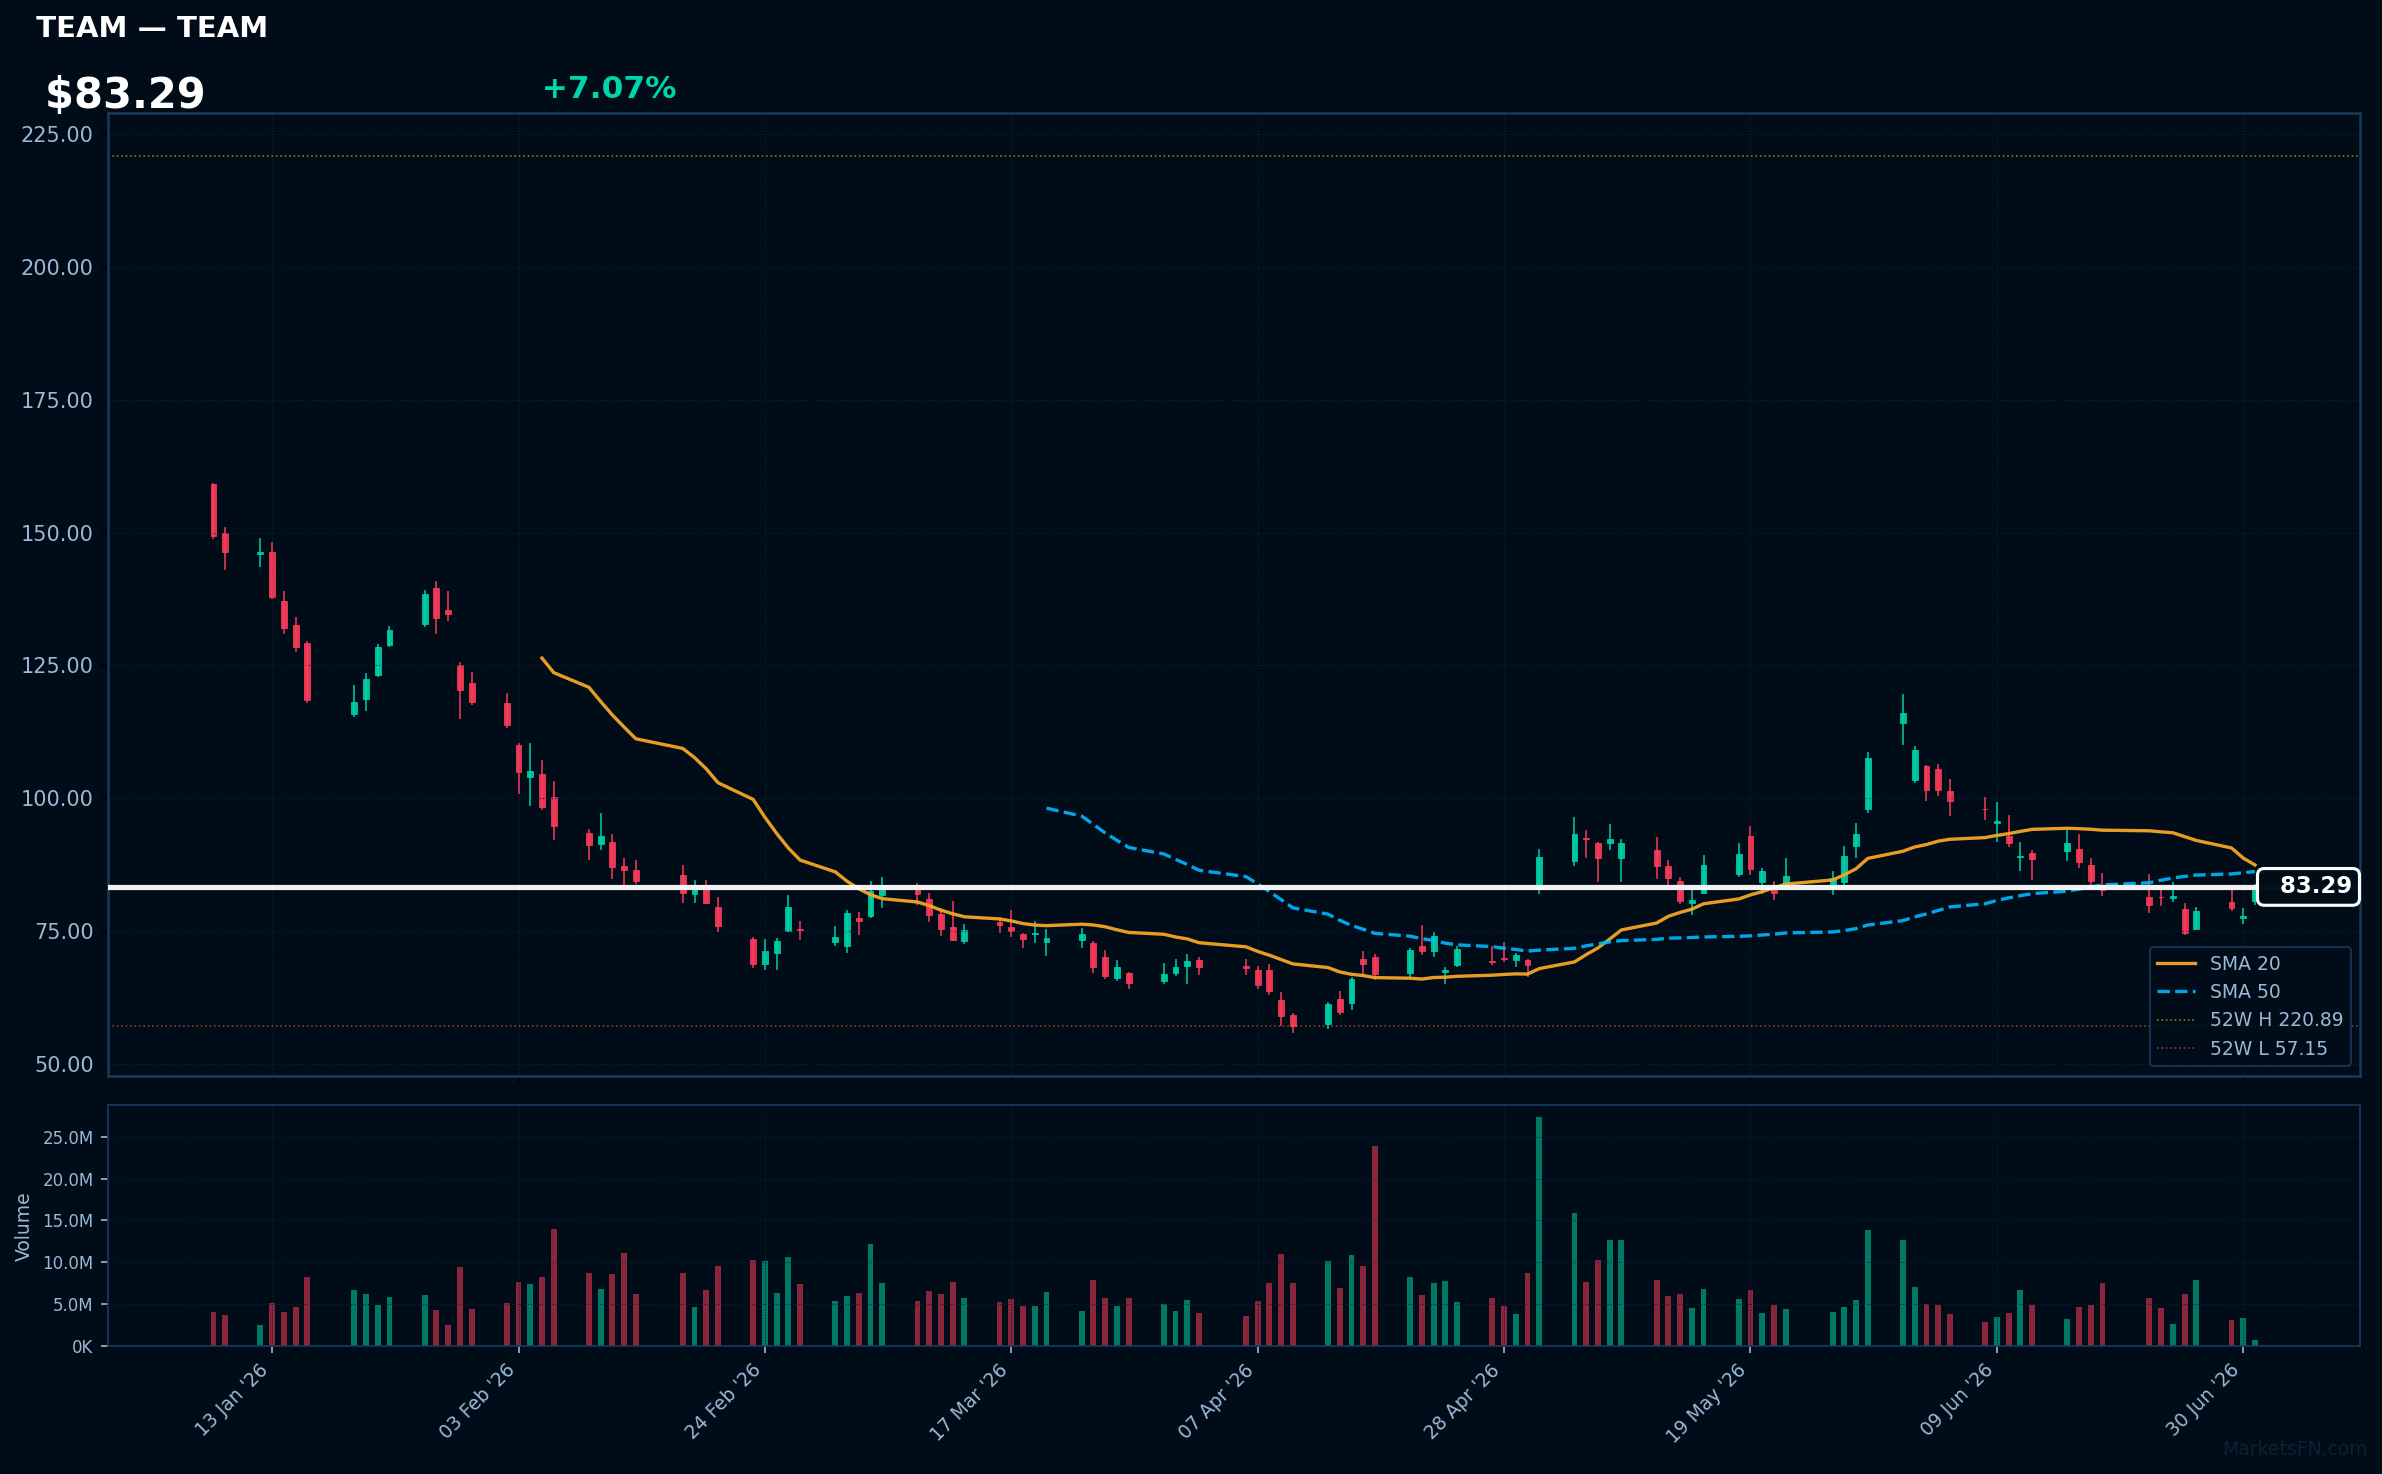
TEAM | Atlassian Corporation | Technology | Price: $83.29 | Day: +7.07% | 1W: +2.13% | 1M: -28.17% | RSI: 47.4 | vs MA200: -28.3% | Trend: Below MA20, MA50, MA200
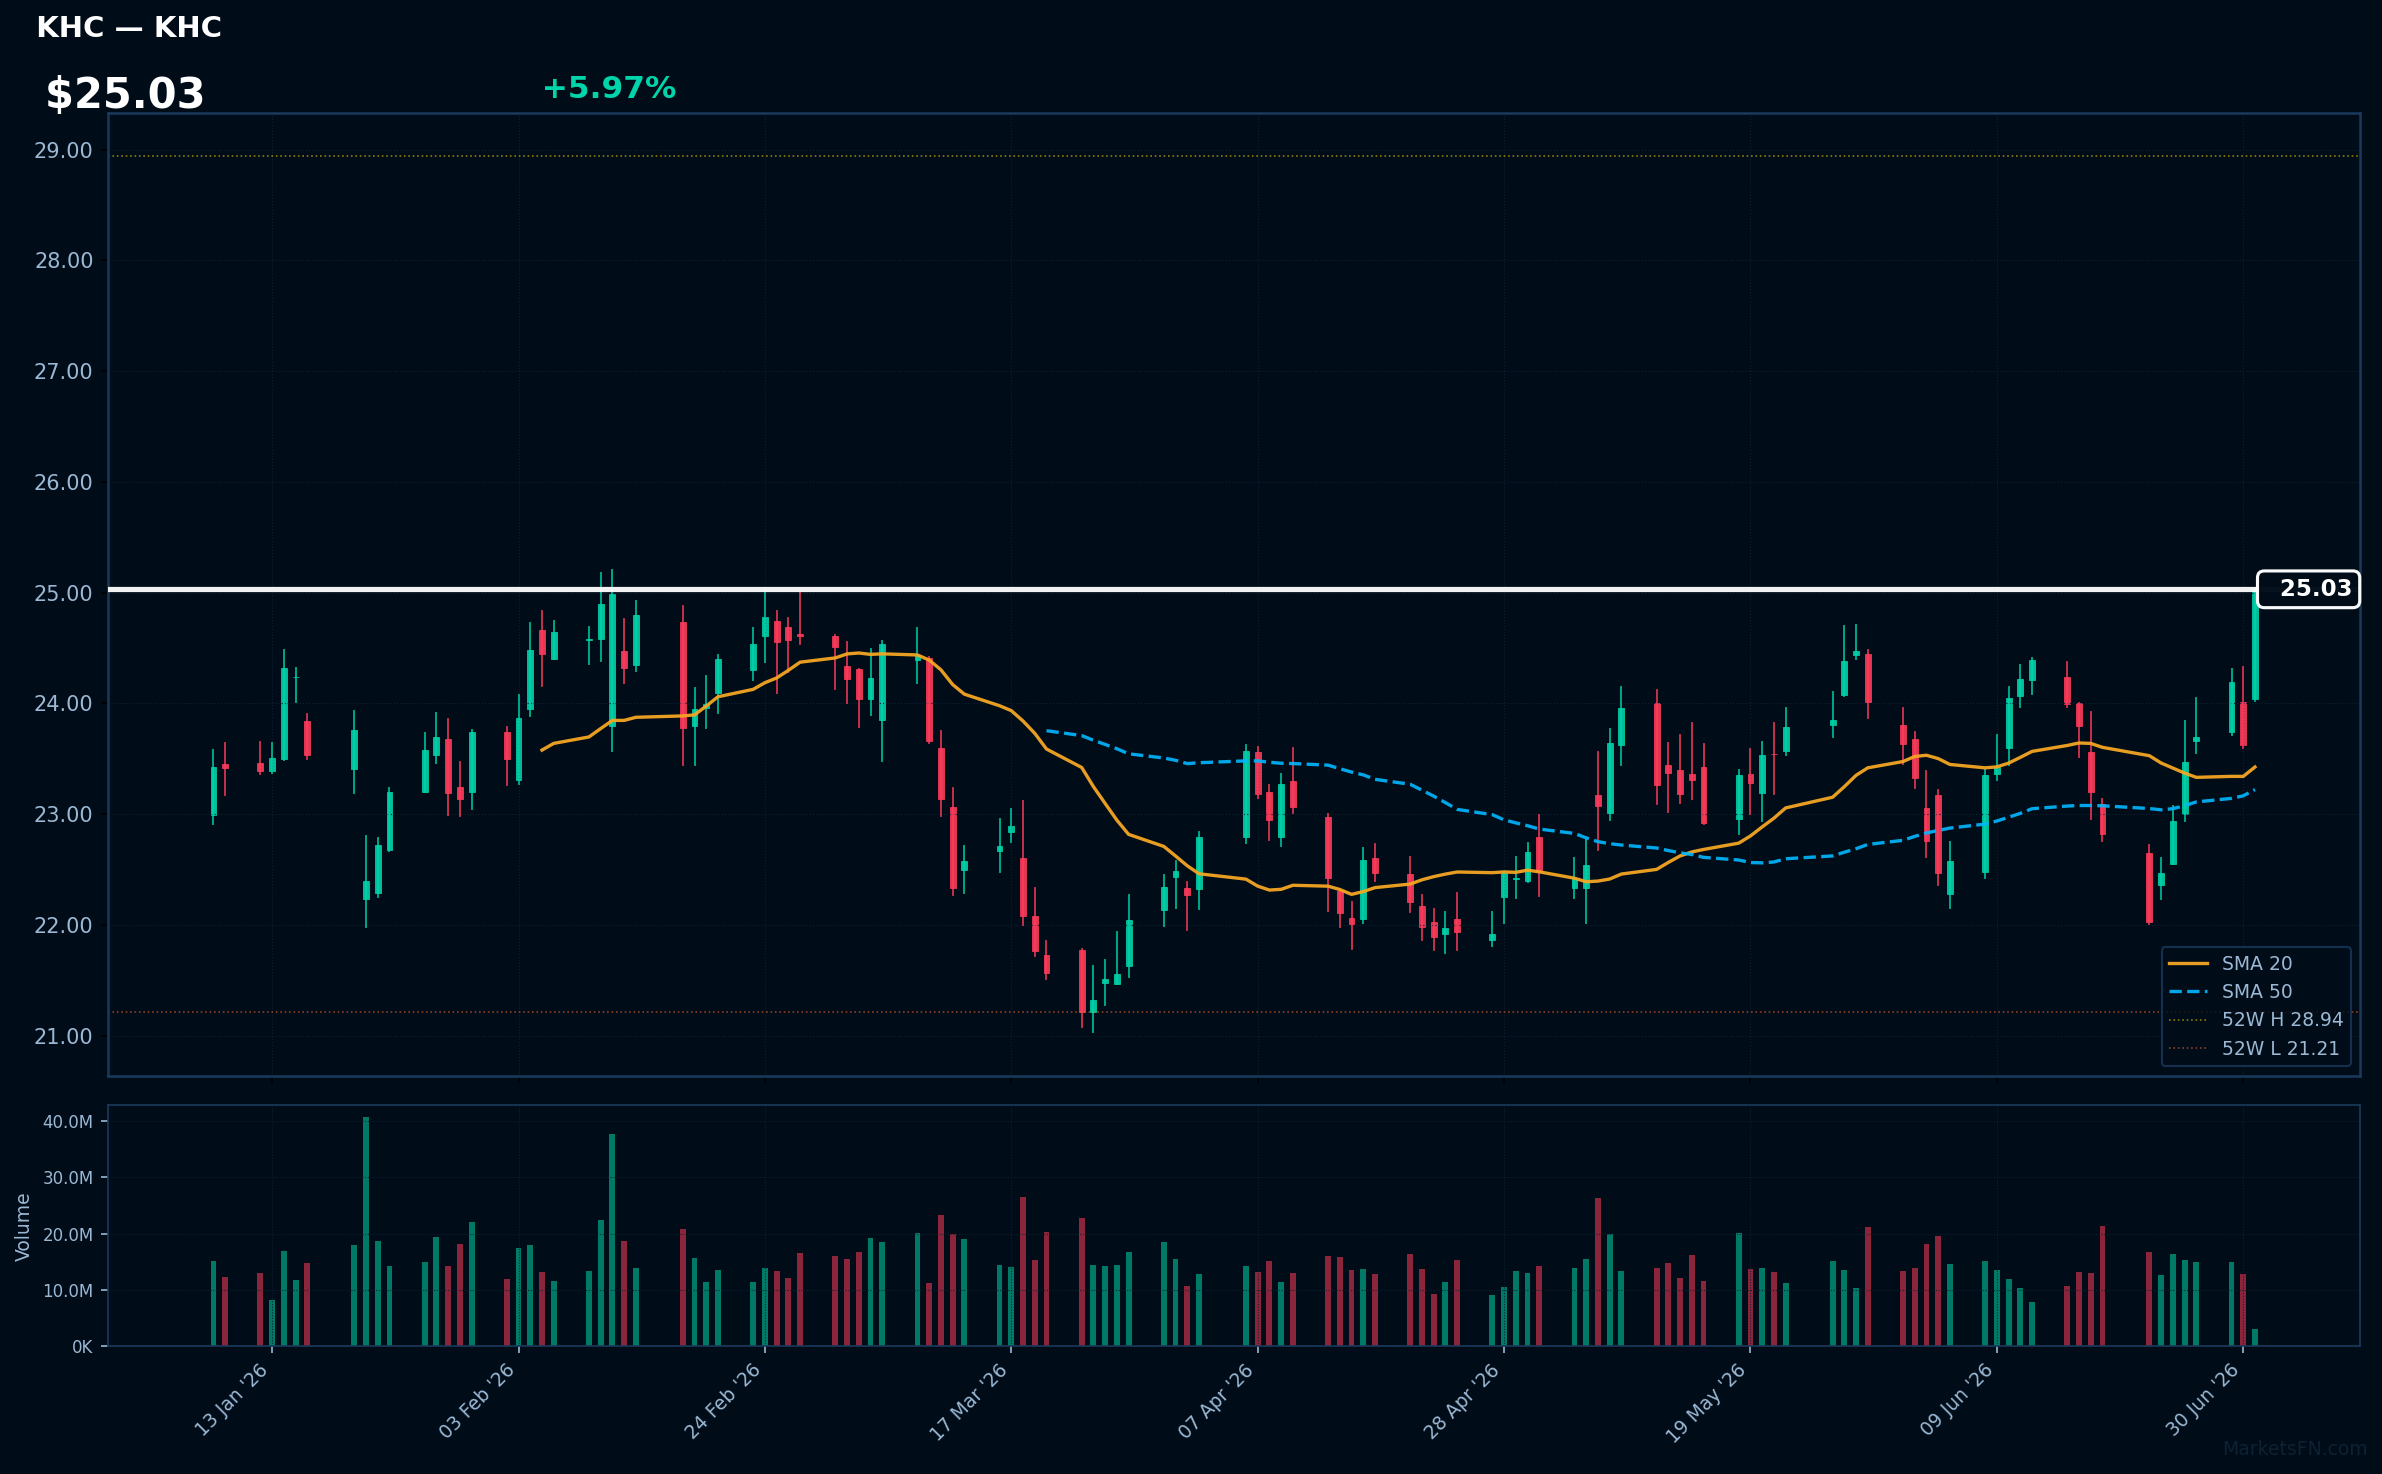
KHC | Kraft Heinz Co | Consumer Defensive | Price: $25.03 | Day: +5.97% | 1W: +9.11% | 1M: +5.92% | RSI: 62.7 | vs MA200: +4.4% | Trend: Above MA20, MA50, MA200
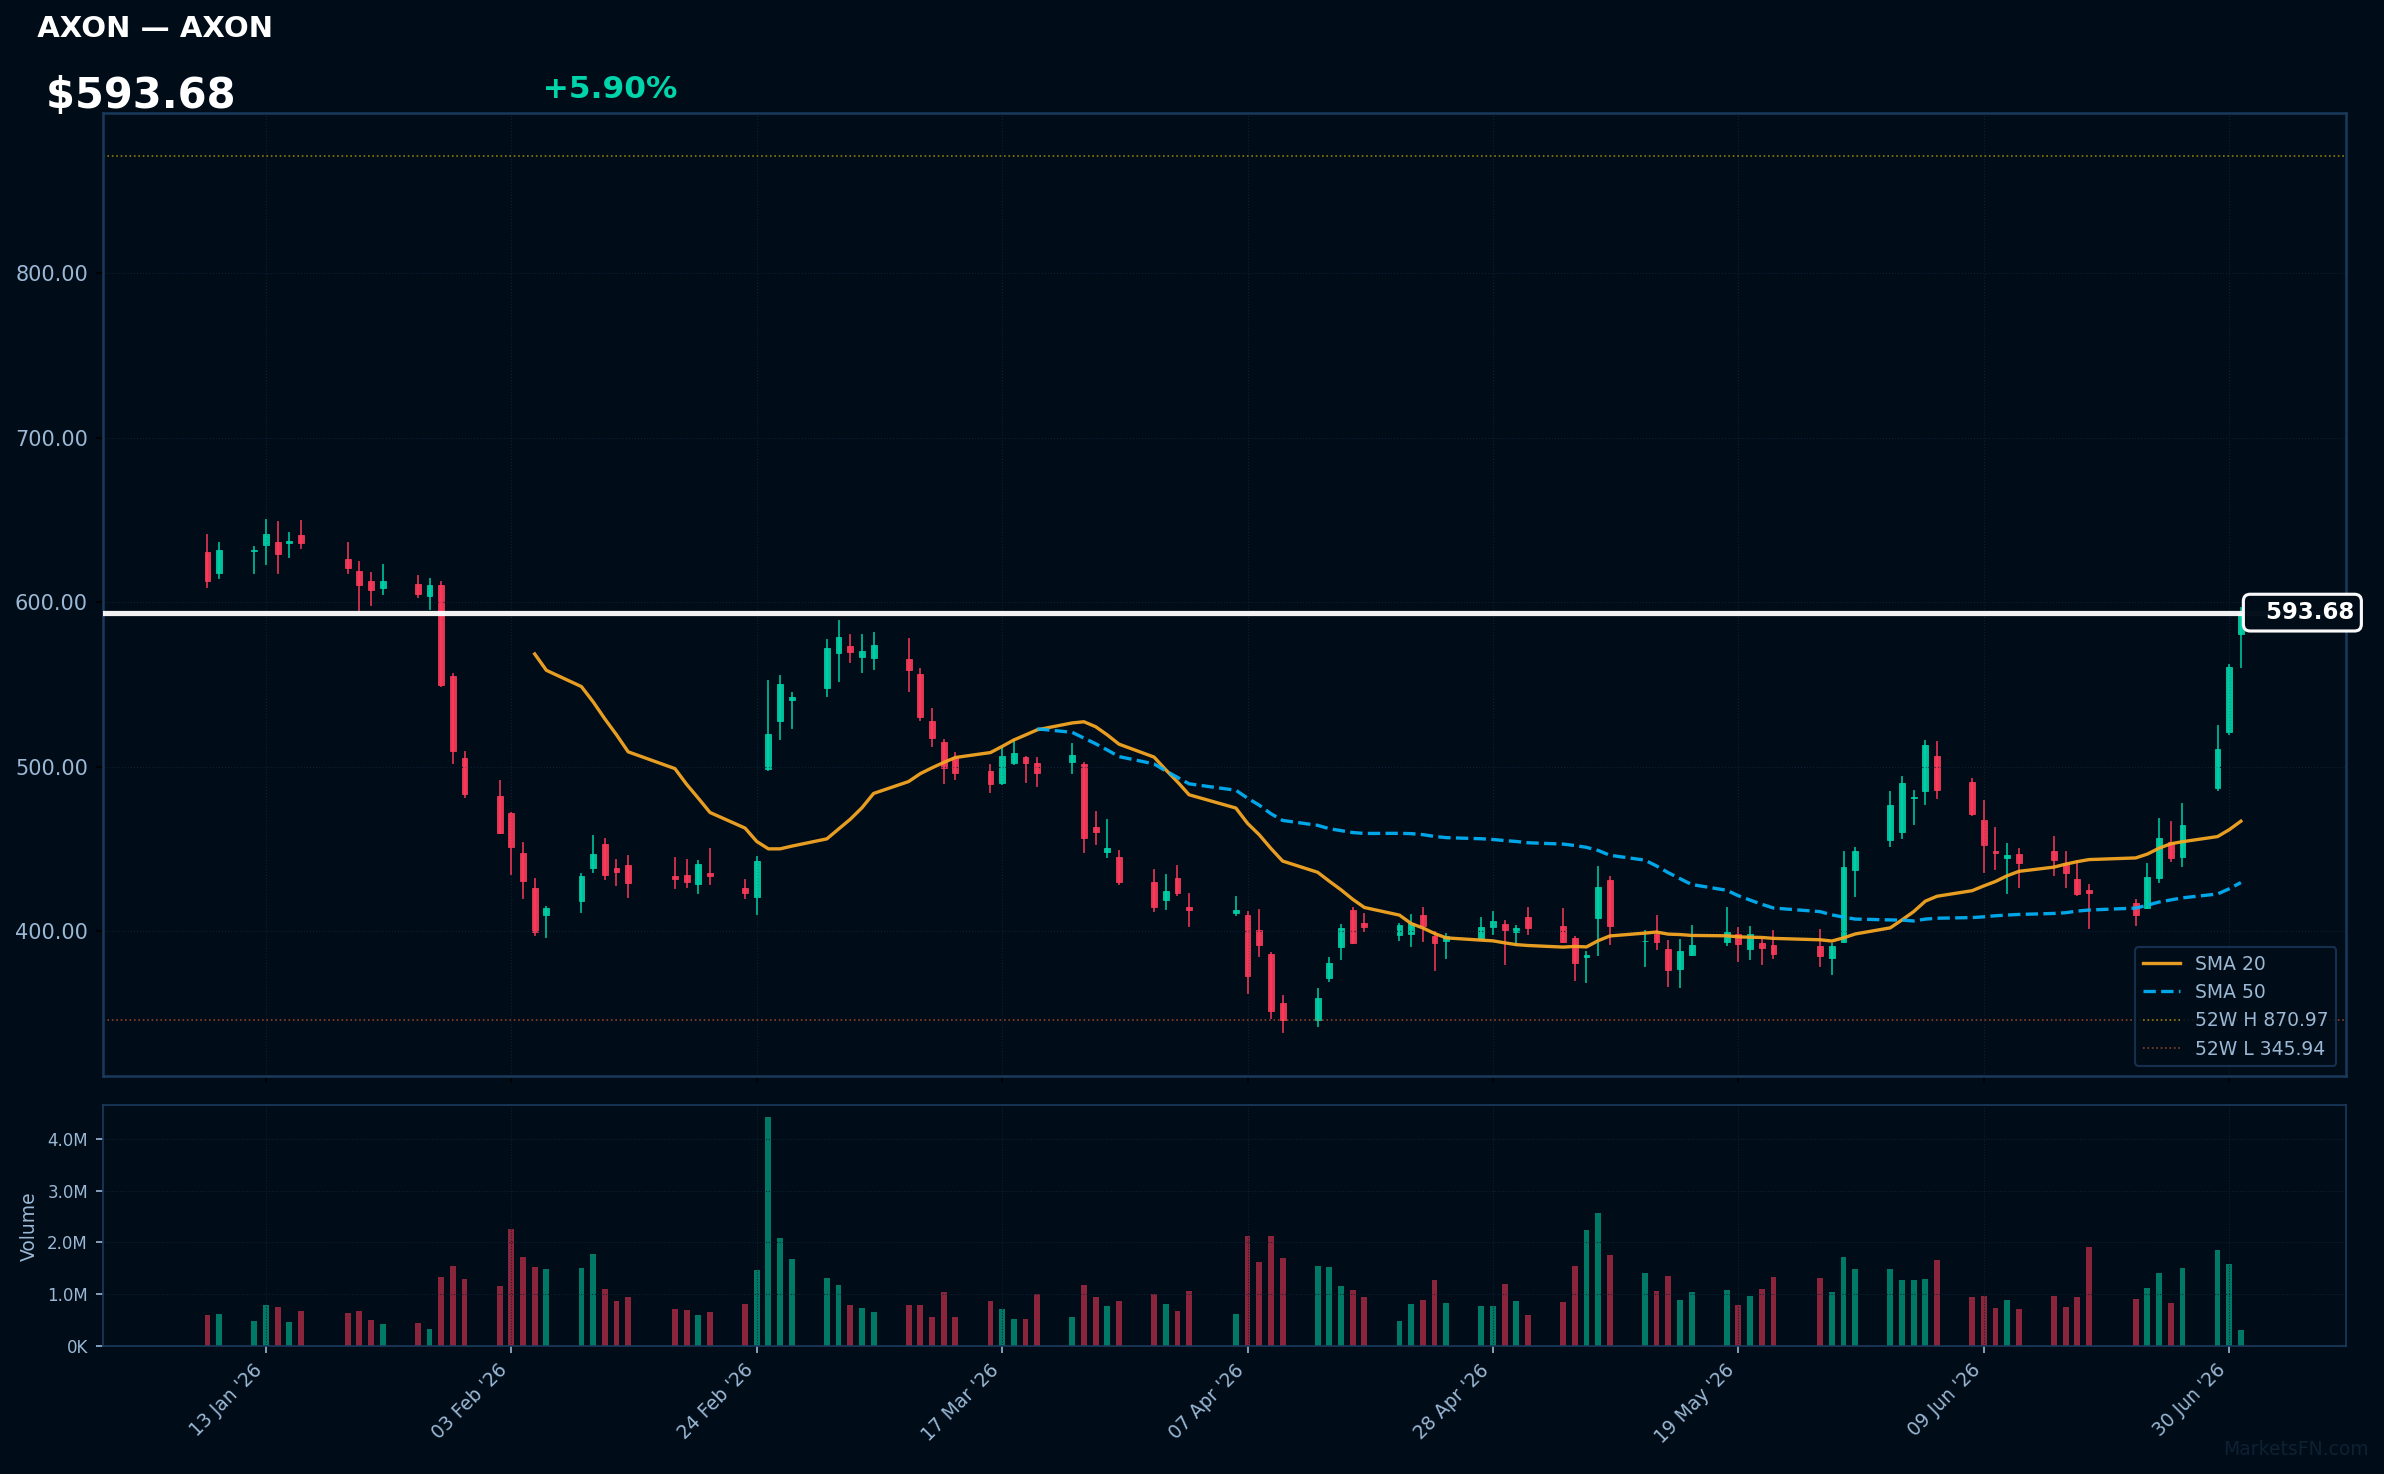
AXON | Axon Enterprise Inc | Industrials | Price: $593.68 | Day: +5.90% | 1W: +29.98% | 1M: +24.49% | RSI: 76.6 | vs MA200: +11.1% | Trend: Above MA20, MA50, MA200
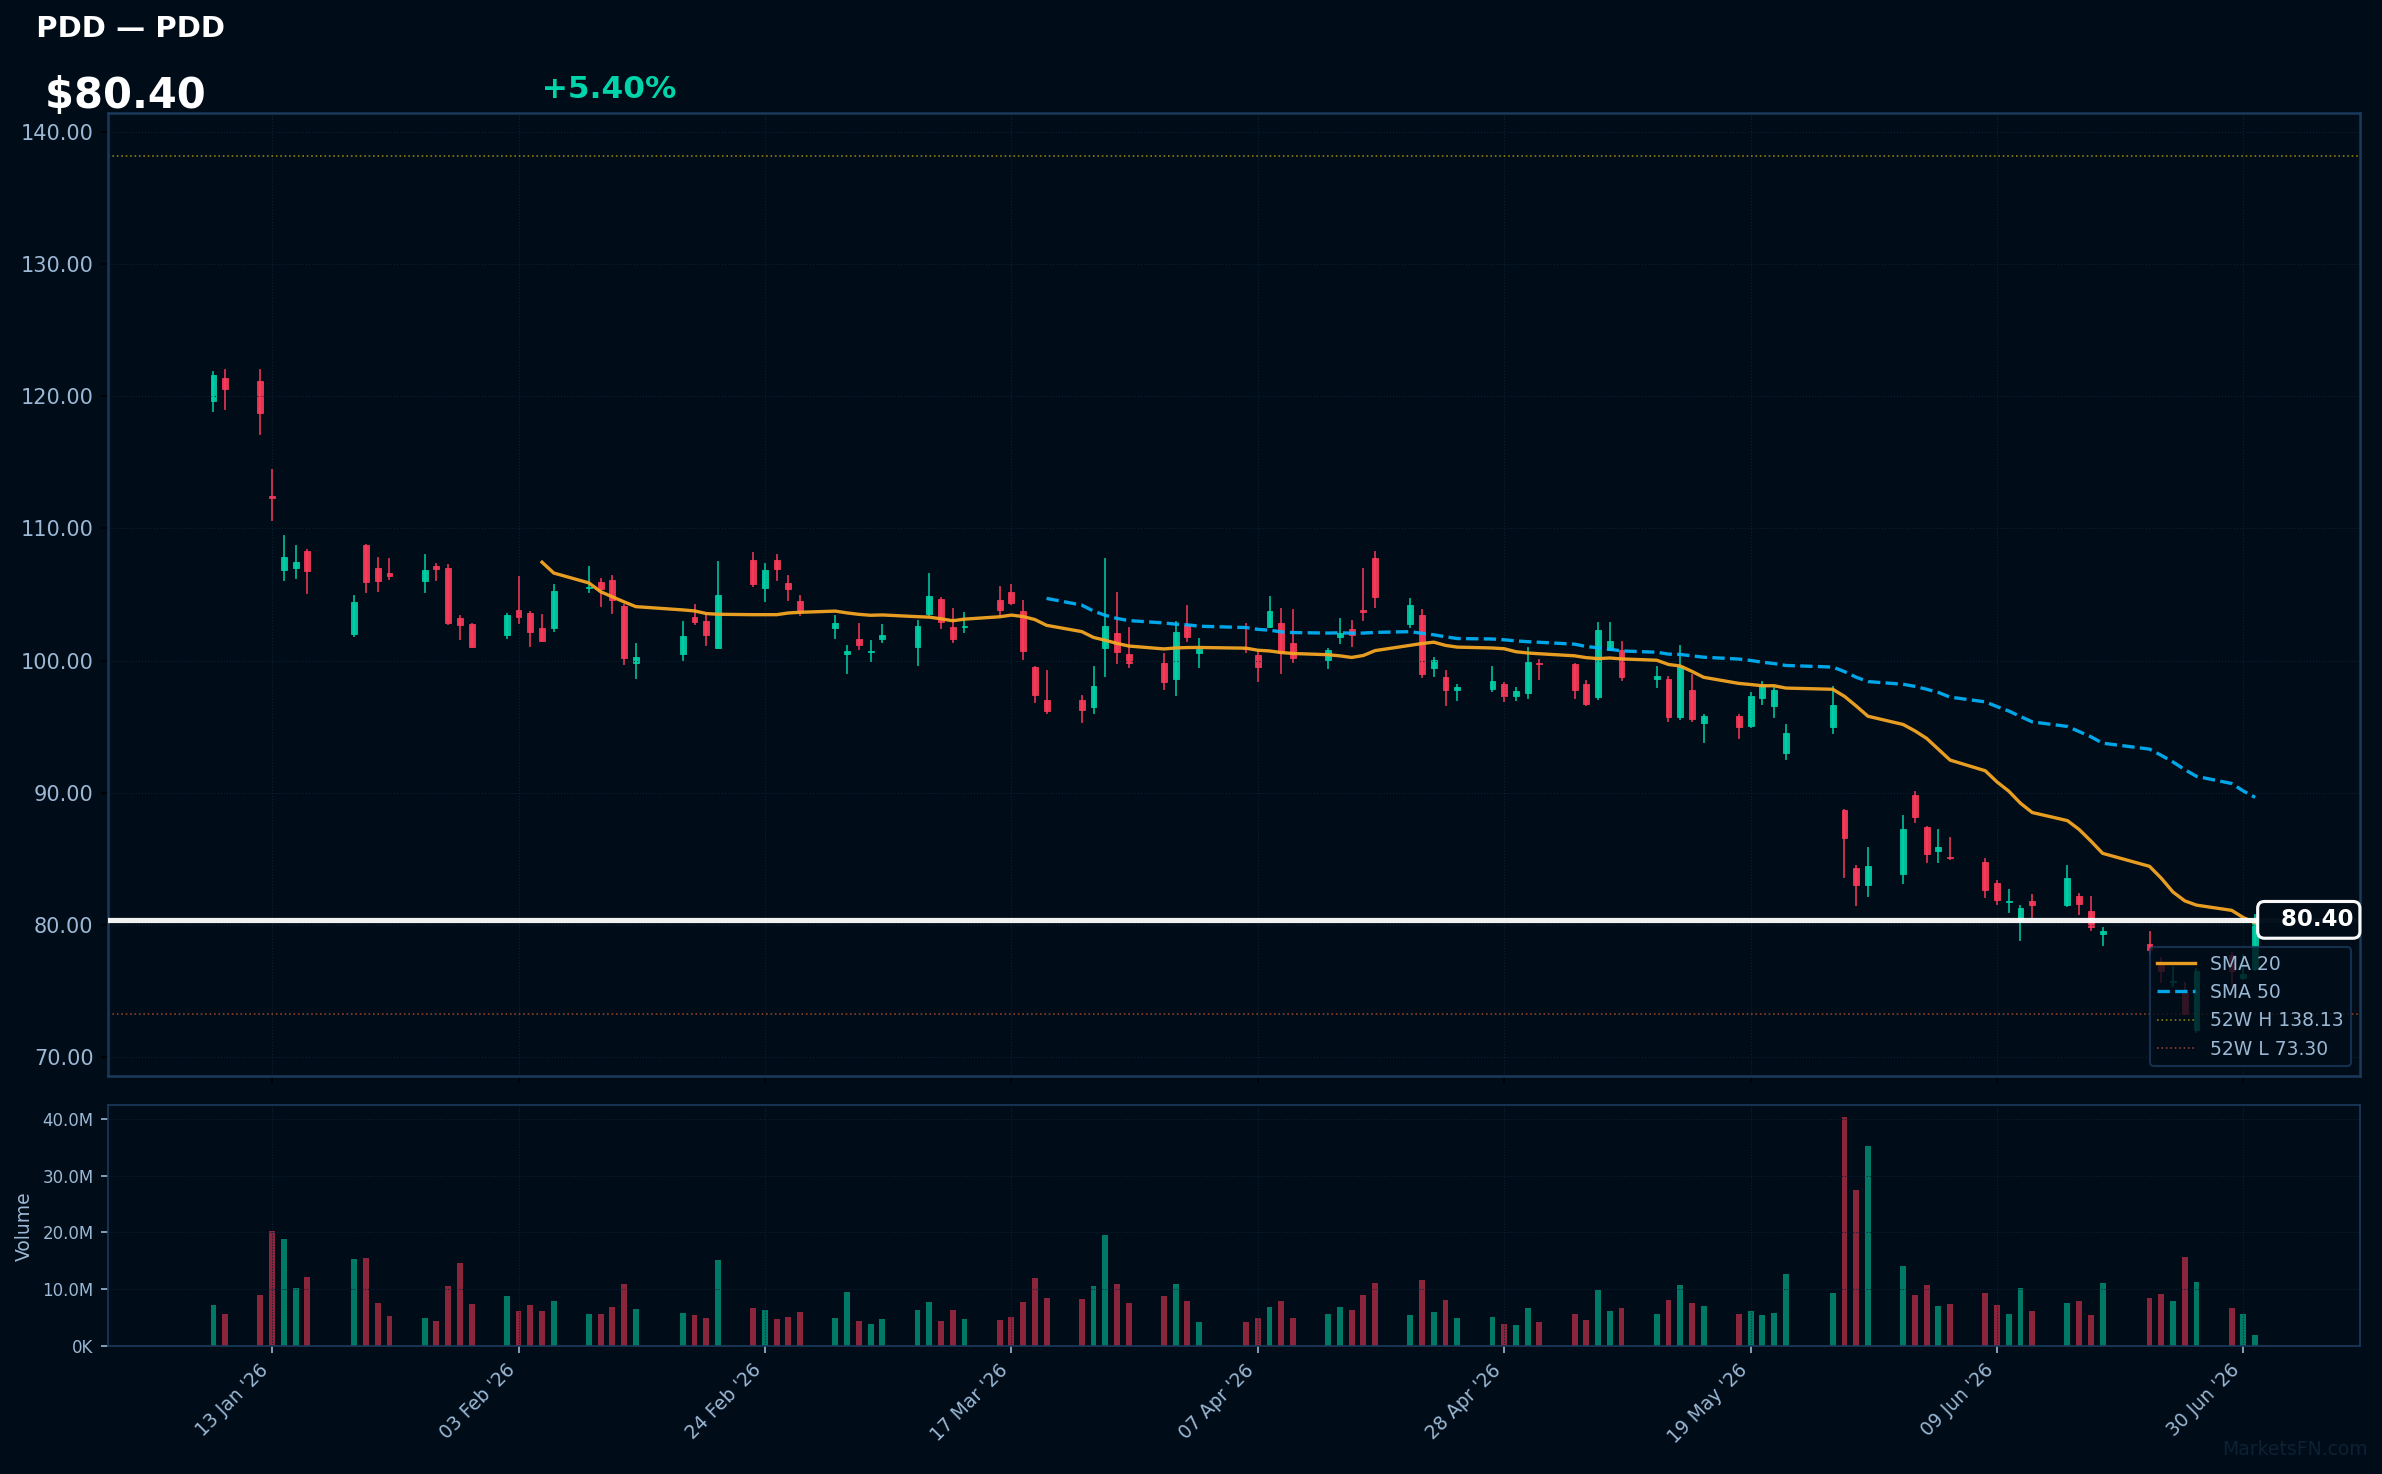
PDD | PDD Holdings Inc ADR | Consumer Cyclical | Price: $80.40 | Day: +5.40% | 1W: +6.15% | 1M: -7.84% | RSI: 45.2 | vs MA200: -26.0% | Trend: Above MA20 · Below MA50, MA200
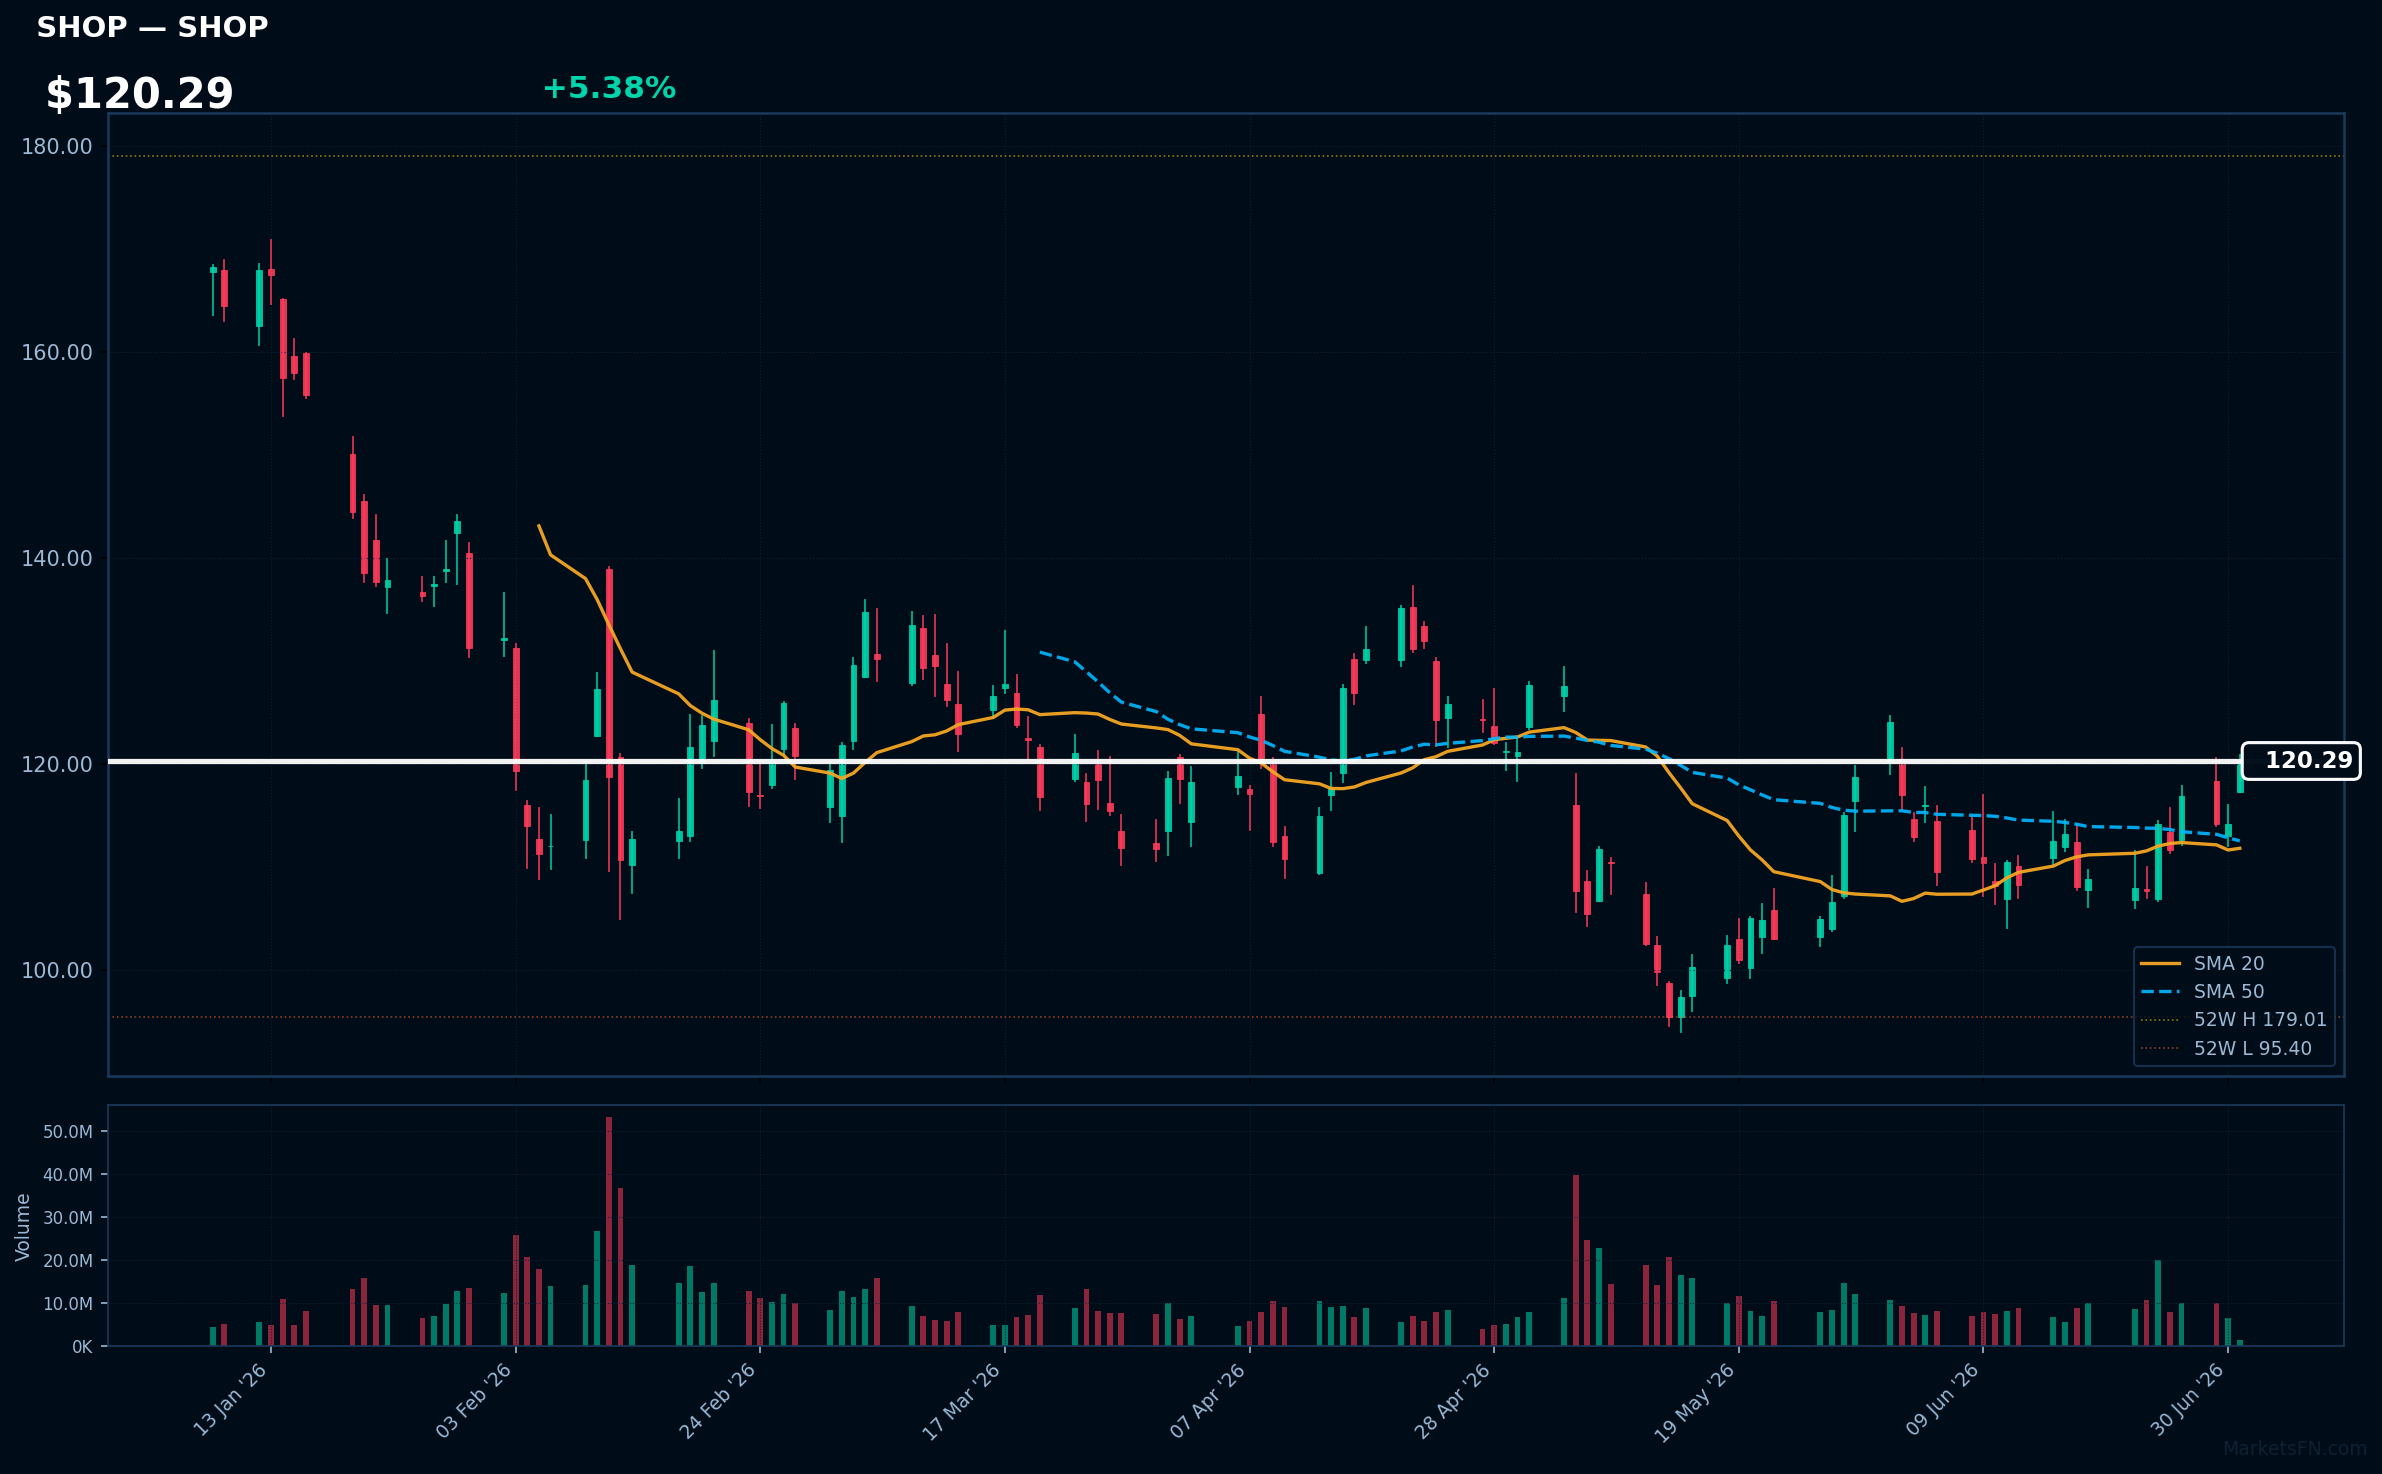
SHOP | Shopify Inc | Technology | Price: $120.32 | Day: +5.38% | 1W: +5.36% | 1M: -3.09% | RSI: 59.6 | vs MA200: -11.8% | Trend: Above MA20, MA50 · Below MA200
Top 10 Losers
Today's weakest Nasdaq 100 performers. Sector drag: Technology (9), Utilities (1).
| Ticker | Company | Sector | Price | Day % | 1W % | 1M % | RSI | vs MA200 | Trend |
|---|---|---|---|---|---|---|---|---|---|
| ASML | ASML Holding NV | Technology | $1914.69 | -3.76% | +8.62% | +17.57% | 58.3 | +46.1% | Above MA20, MA50, MA200 |
| GFS | GlobalFoundries Inc | Technology | $79.20 | -3.90% | -5.38% | -0.91% | 49.2 | +61.9% | Above MA50, MA200 · Below MA20 |
| ARM | Arm Holdings plc. ADR | Technology | $339.48 | -4.26% | -5.46% | -16.97% | 49.2 | +92.5% | Above MA50, MA200 · Below MA20 |
| AMD | Advanced Micro Devices Inc | Technology | $555.96 | -4.29% | +7.02% | +9.04% | 59.5 | +101.1% | Above MA20, MA50, MA200 |
| CEG | Constellation Energy Corporation | Utilities | $236.65 | -4.72% | -11.69% | -10.93% | 31.9 | -25.4% | Below MA20, MA50, MA200 |
| INTC | Intel Corp | Technology | $132.04 | -5.43% | +0.39% | +20.89% | 57.0 | +120.5% | Above MA20, MA50, MA200 |
| AMAT | Applied Materials Inc | Technology | $681.55 | -5.73% | +15.72% | +48.76% | 64.9 | +102.0% | Above MA20, MA50, MA200 |
| MU | Micron Technology Inc | Technology | $1083.37 | -6.14% | +3.31% | +4.61% | 54.9 | +145.9% | Above MA20, MA50, MA200 |
| LRCX | Lam Research Corp | Technology | $405.47 | -6.43% | +8.18% | +27.86% | 59.6 | +82.9% | Above MA20, MA50, MA200 |
| KLAC | KLA Corp | Technology | $279.78 | -7.27% | +16.40% | +44.29% | 62.5 | +84.8% | Above MA20, MA50, MA200 |
ASML | ASML Holding NV | Technology | Price: $1914.69 | Day: -3.76% | 1W: +8.62% | 1M: +17.57% | RSI: 58.3 | vs MA200: +46.1% | Trend: Above MA20, MA50, MA200
Recent headlines (last 12h)
- The Most In-Demand Commodity in the $3 Trillion AI Buildout
- European shares pause after rally, doubts linger over Iran peace deal
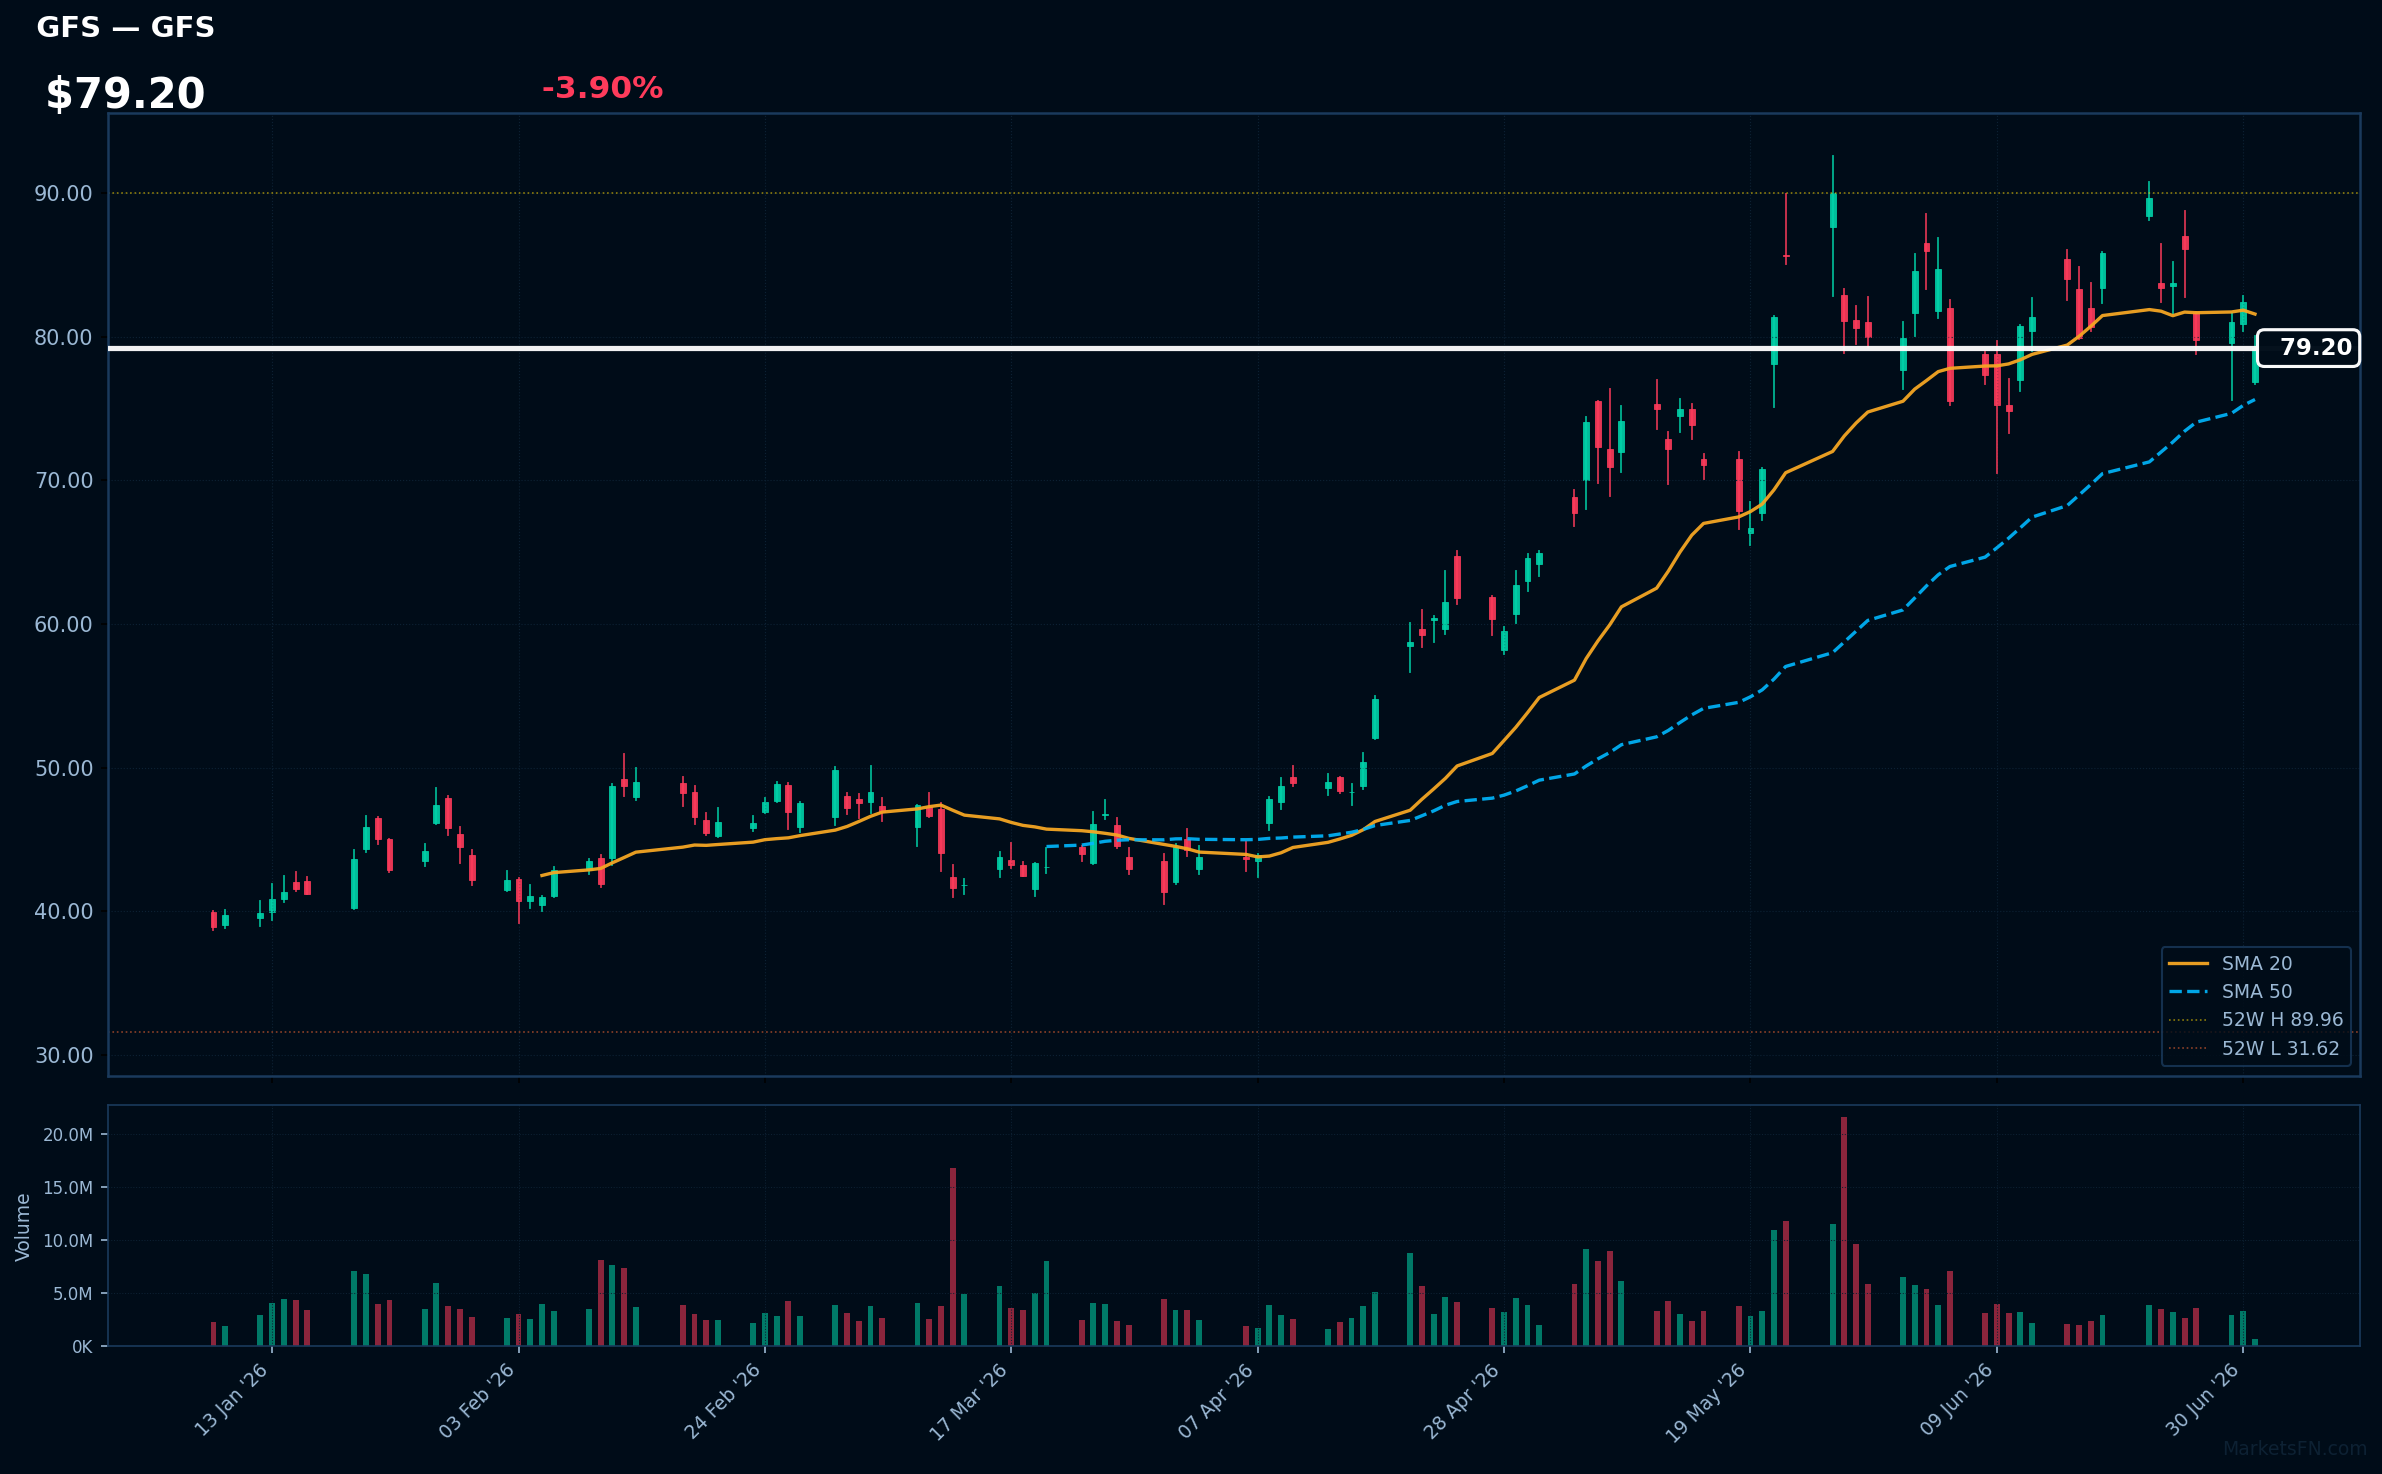
GFS | GlobalFoundries Inc | Technology | Price: $79.20 | Day: -3.90% | 1W: -5.38% | 1M: -0.91% | RSI: 49.2 | vs MA200: +61.9% | Trend: Above MA50, MA200 · Below MA20
Recent headlines (last 12h)
- GlobalFoundries Announces Conference Call to Review Second Quarter 2026 Financial Results
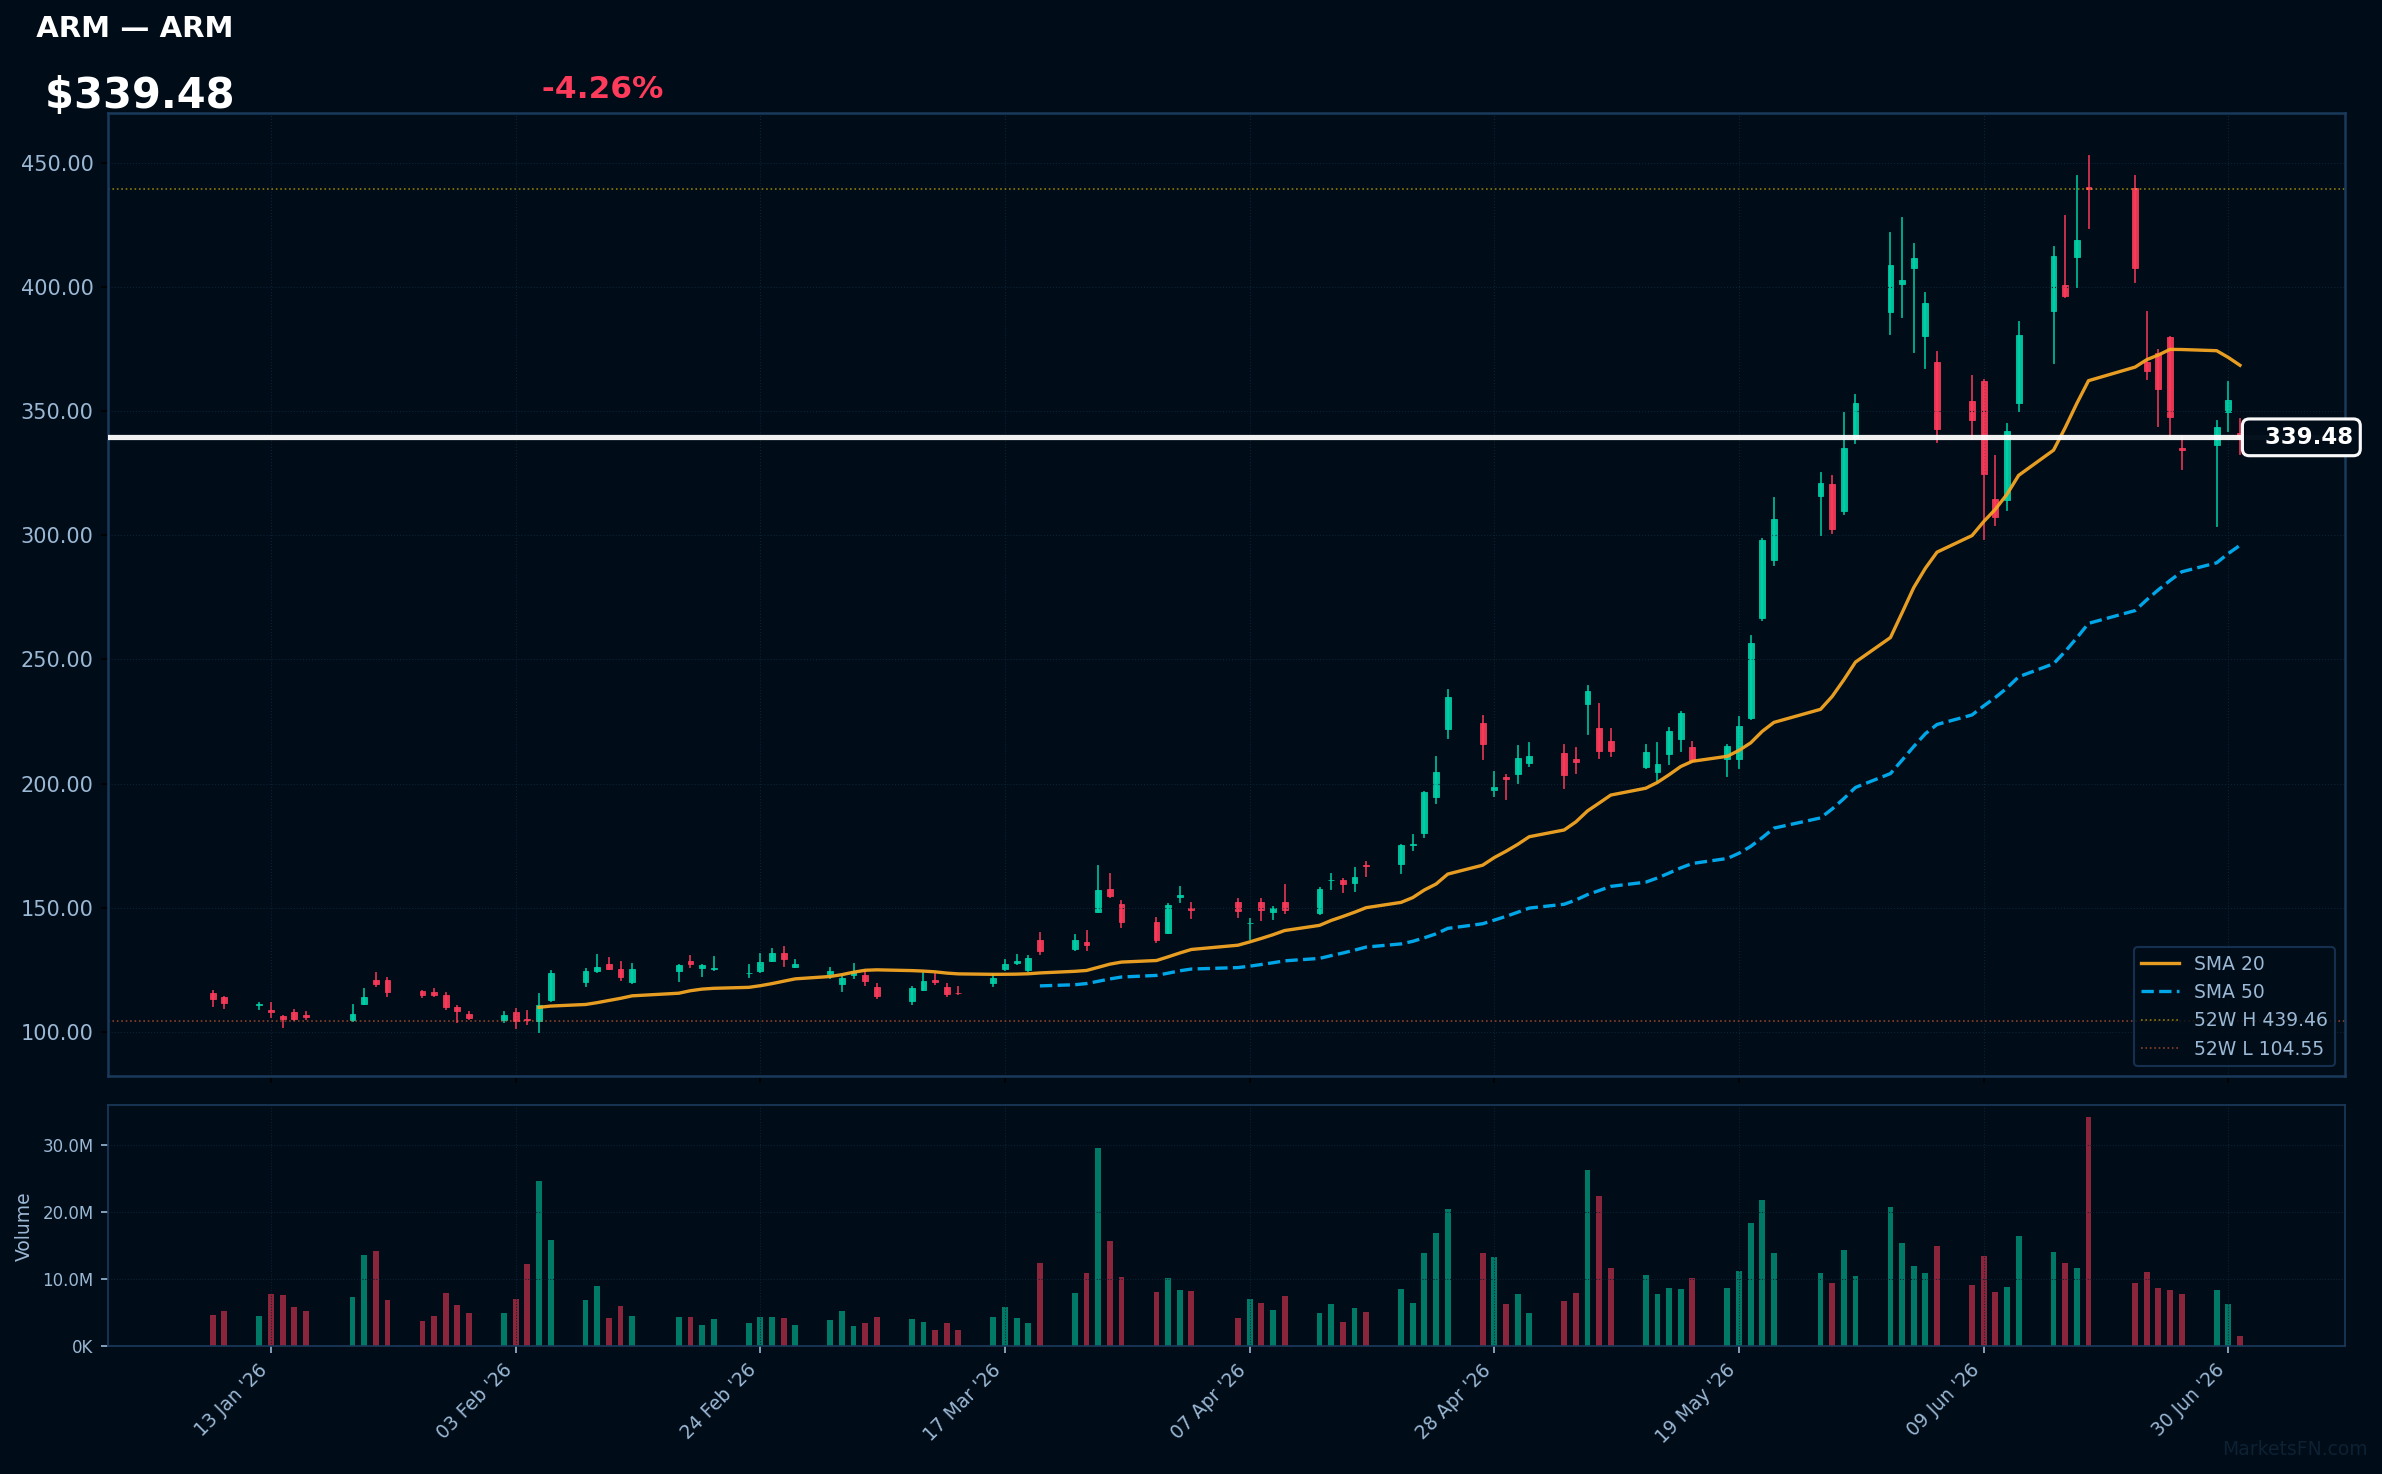
ARM | Arm Holdings plc. ADR | Technology | Price: $339.48 | Day: -4.26% | 1W: -5.46% | 1M: -16.97% | RSI: 49.2 | vs MA200: +92.5% | Trend: Above MA50, MA200 · Below MA20
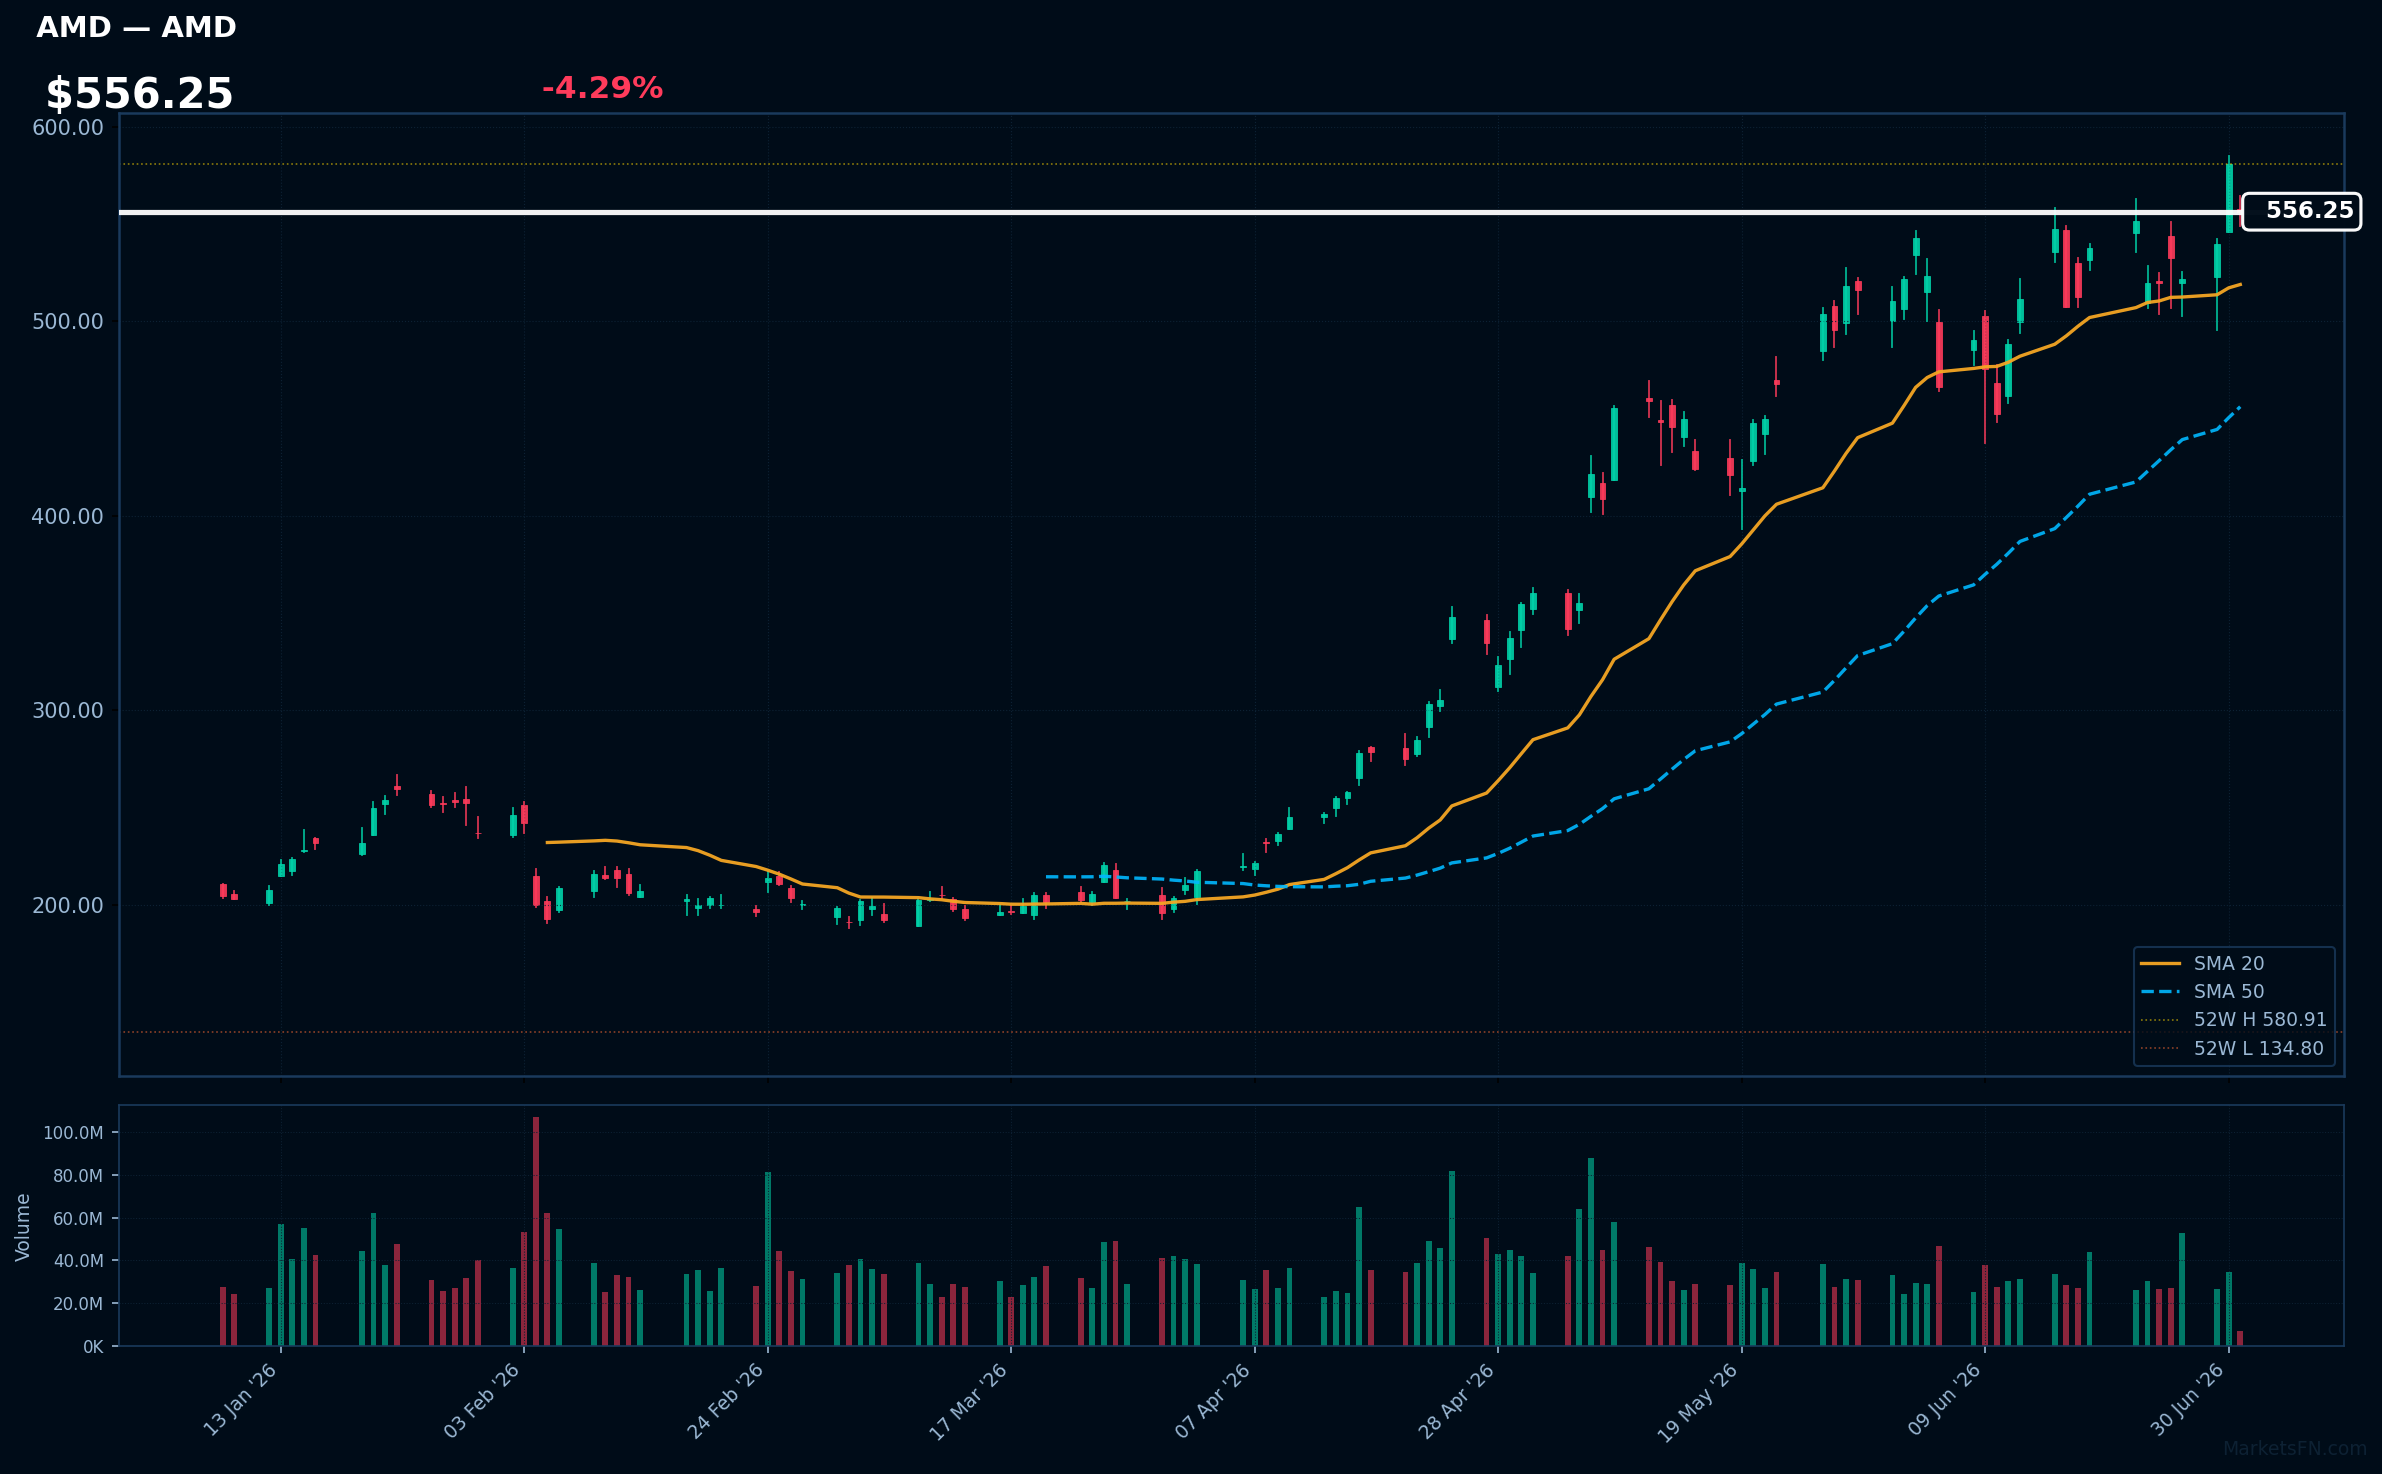
AMD | Advanced Micro Devices Inc | Technology | Price: $555.96 | Day: -4.29% | 1W: +7.02% | 1M: +9.04% | RSI: 59.5 | vs MA200: +101.1% | Trend: Above MA20, MA50, MA200
Recent headlines (last 12h)
- Why Did INTC, AMD, BB Stocks Surge To 52-Week Highs?
- Scared of an AI stock bubble? Then don't look at this chart.
- Wall Street and Crypto Agree on One Chip Stock, and It Is Not Nvidia
- Big Tech's first half was a story of hardware versus software
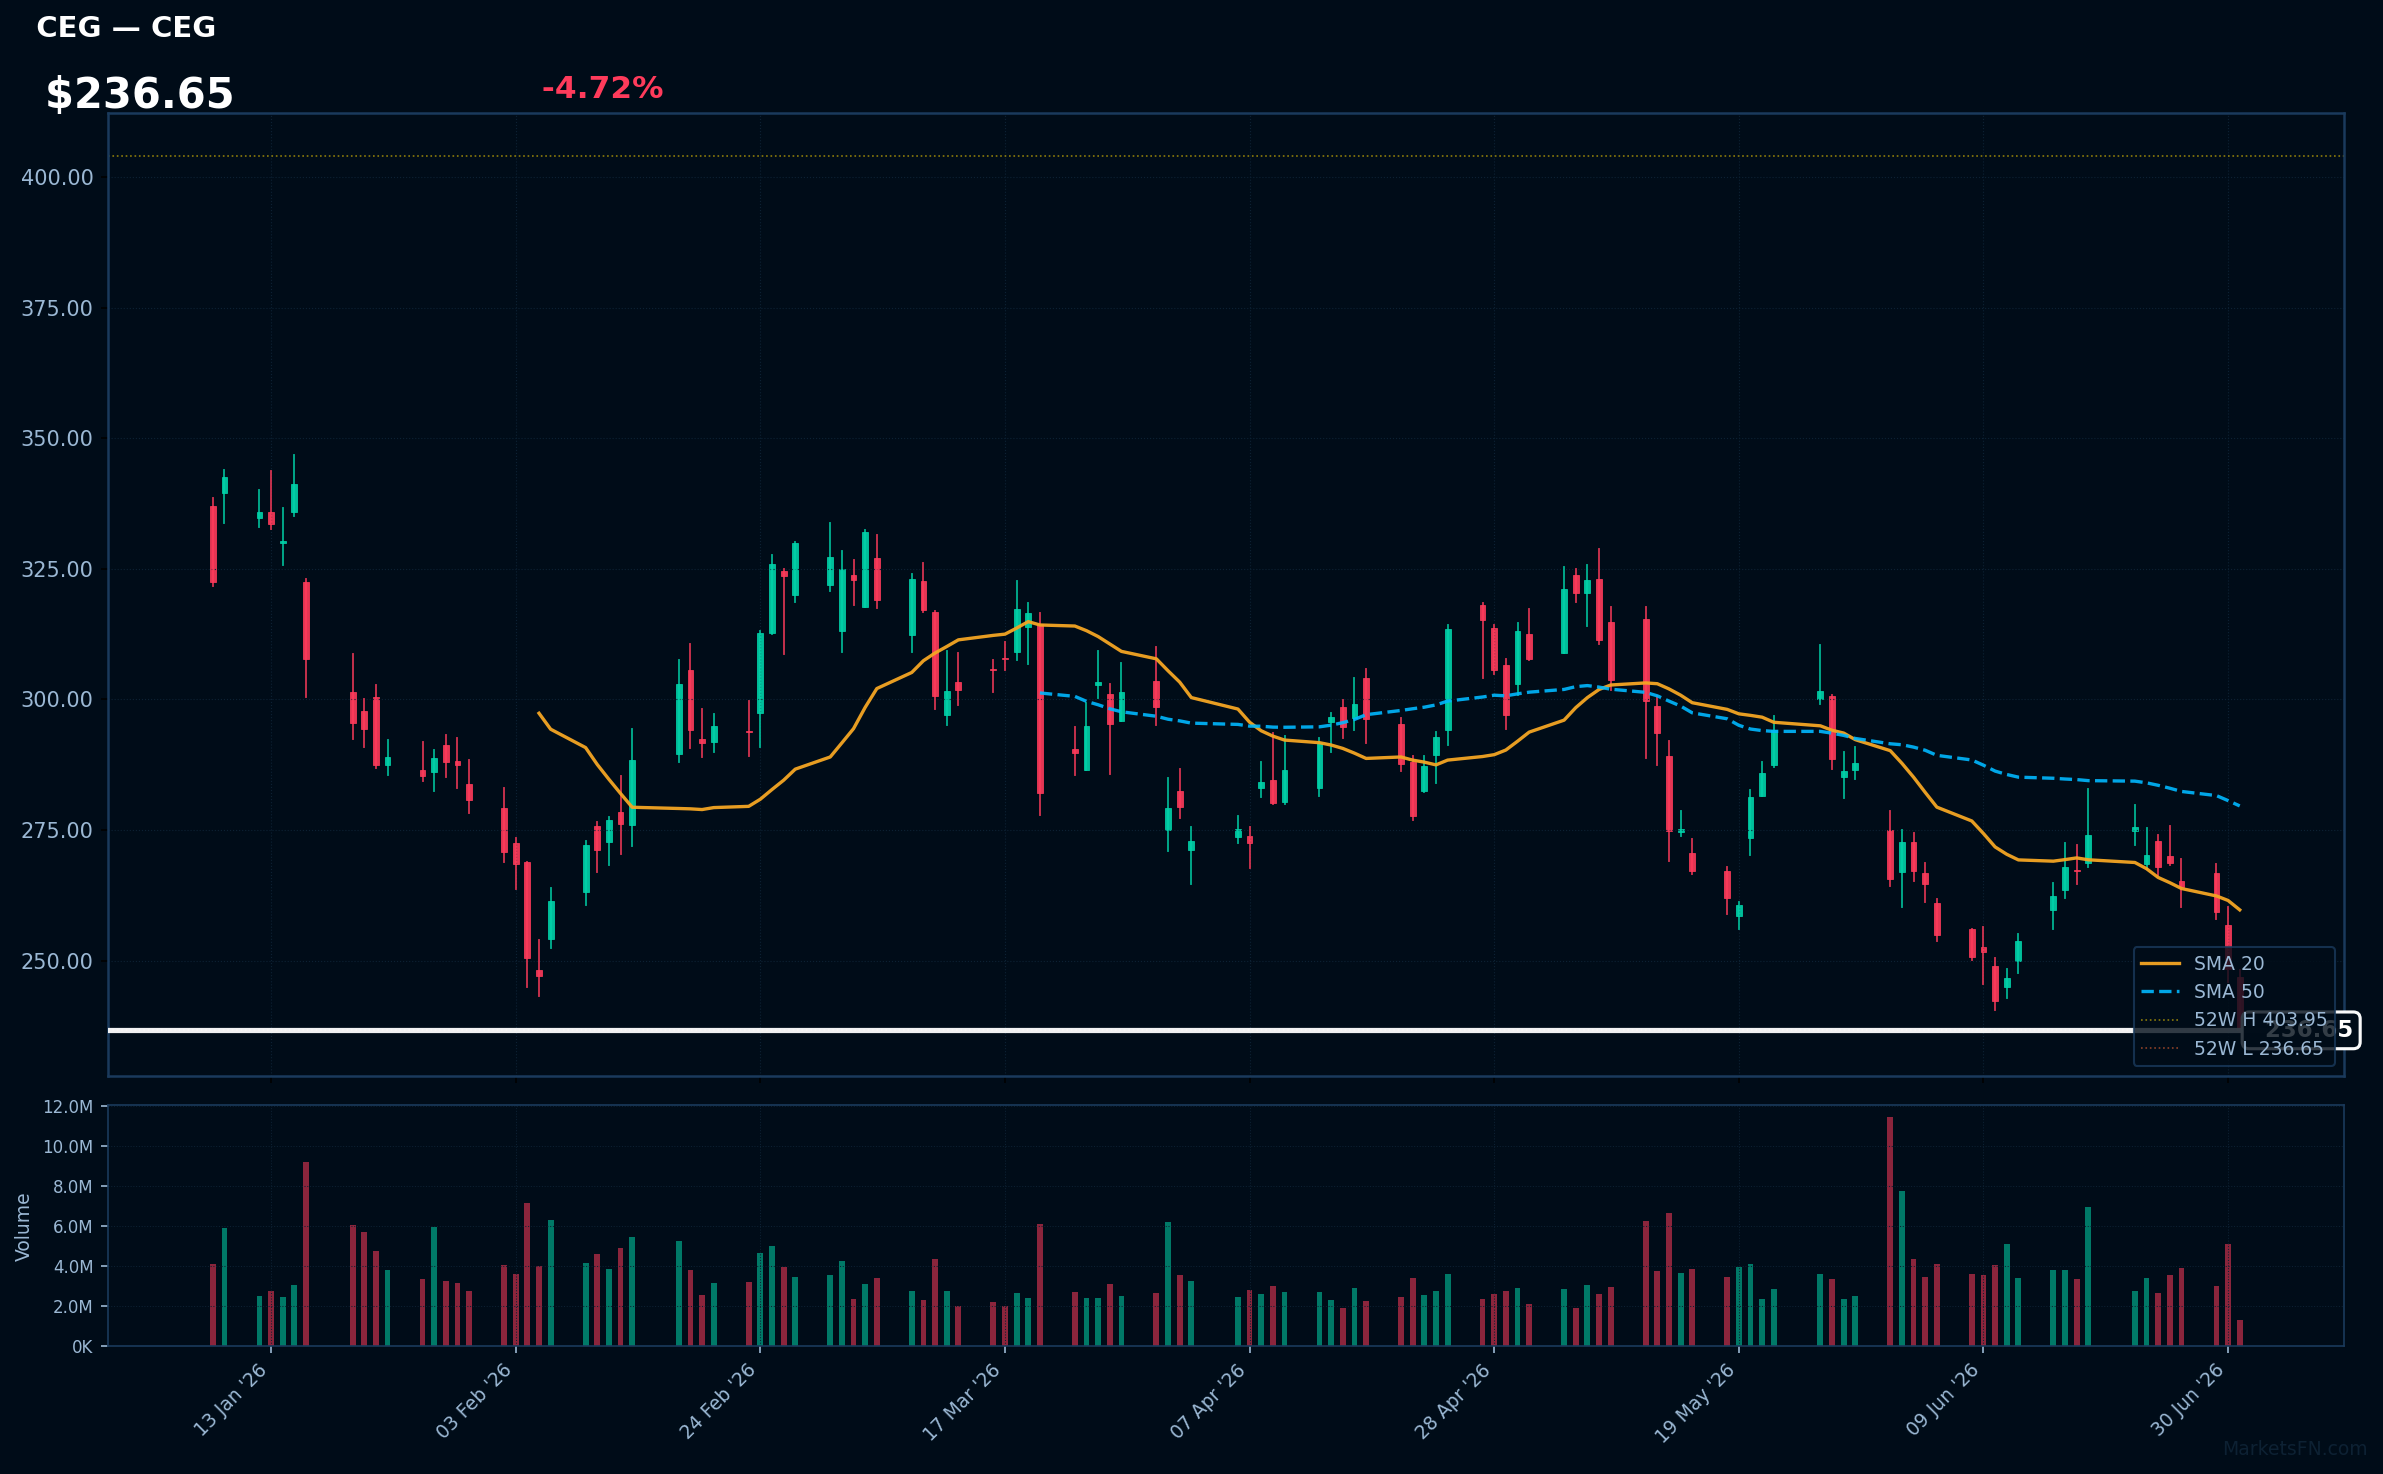
CEG | Constellation Energy Corporation | Utilities | Price: $236.65 | Day: -4.72% | 1W: -11.69% | 1M: -10.93% | RSI: 31.9 | vs MA200: -25.4% | Trend: Below MA20, MA50, MA200
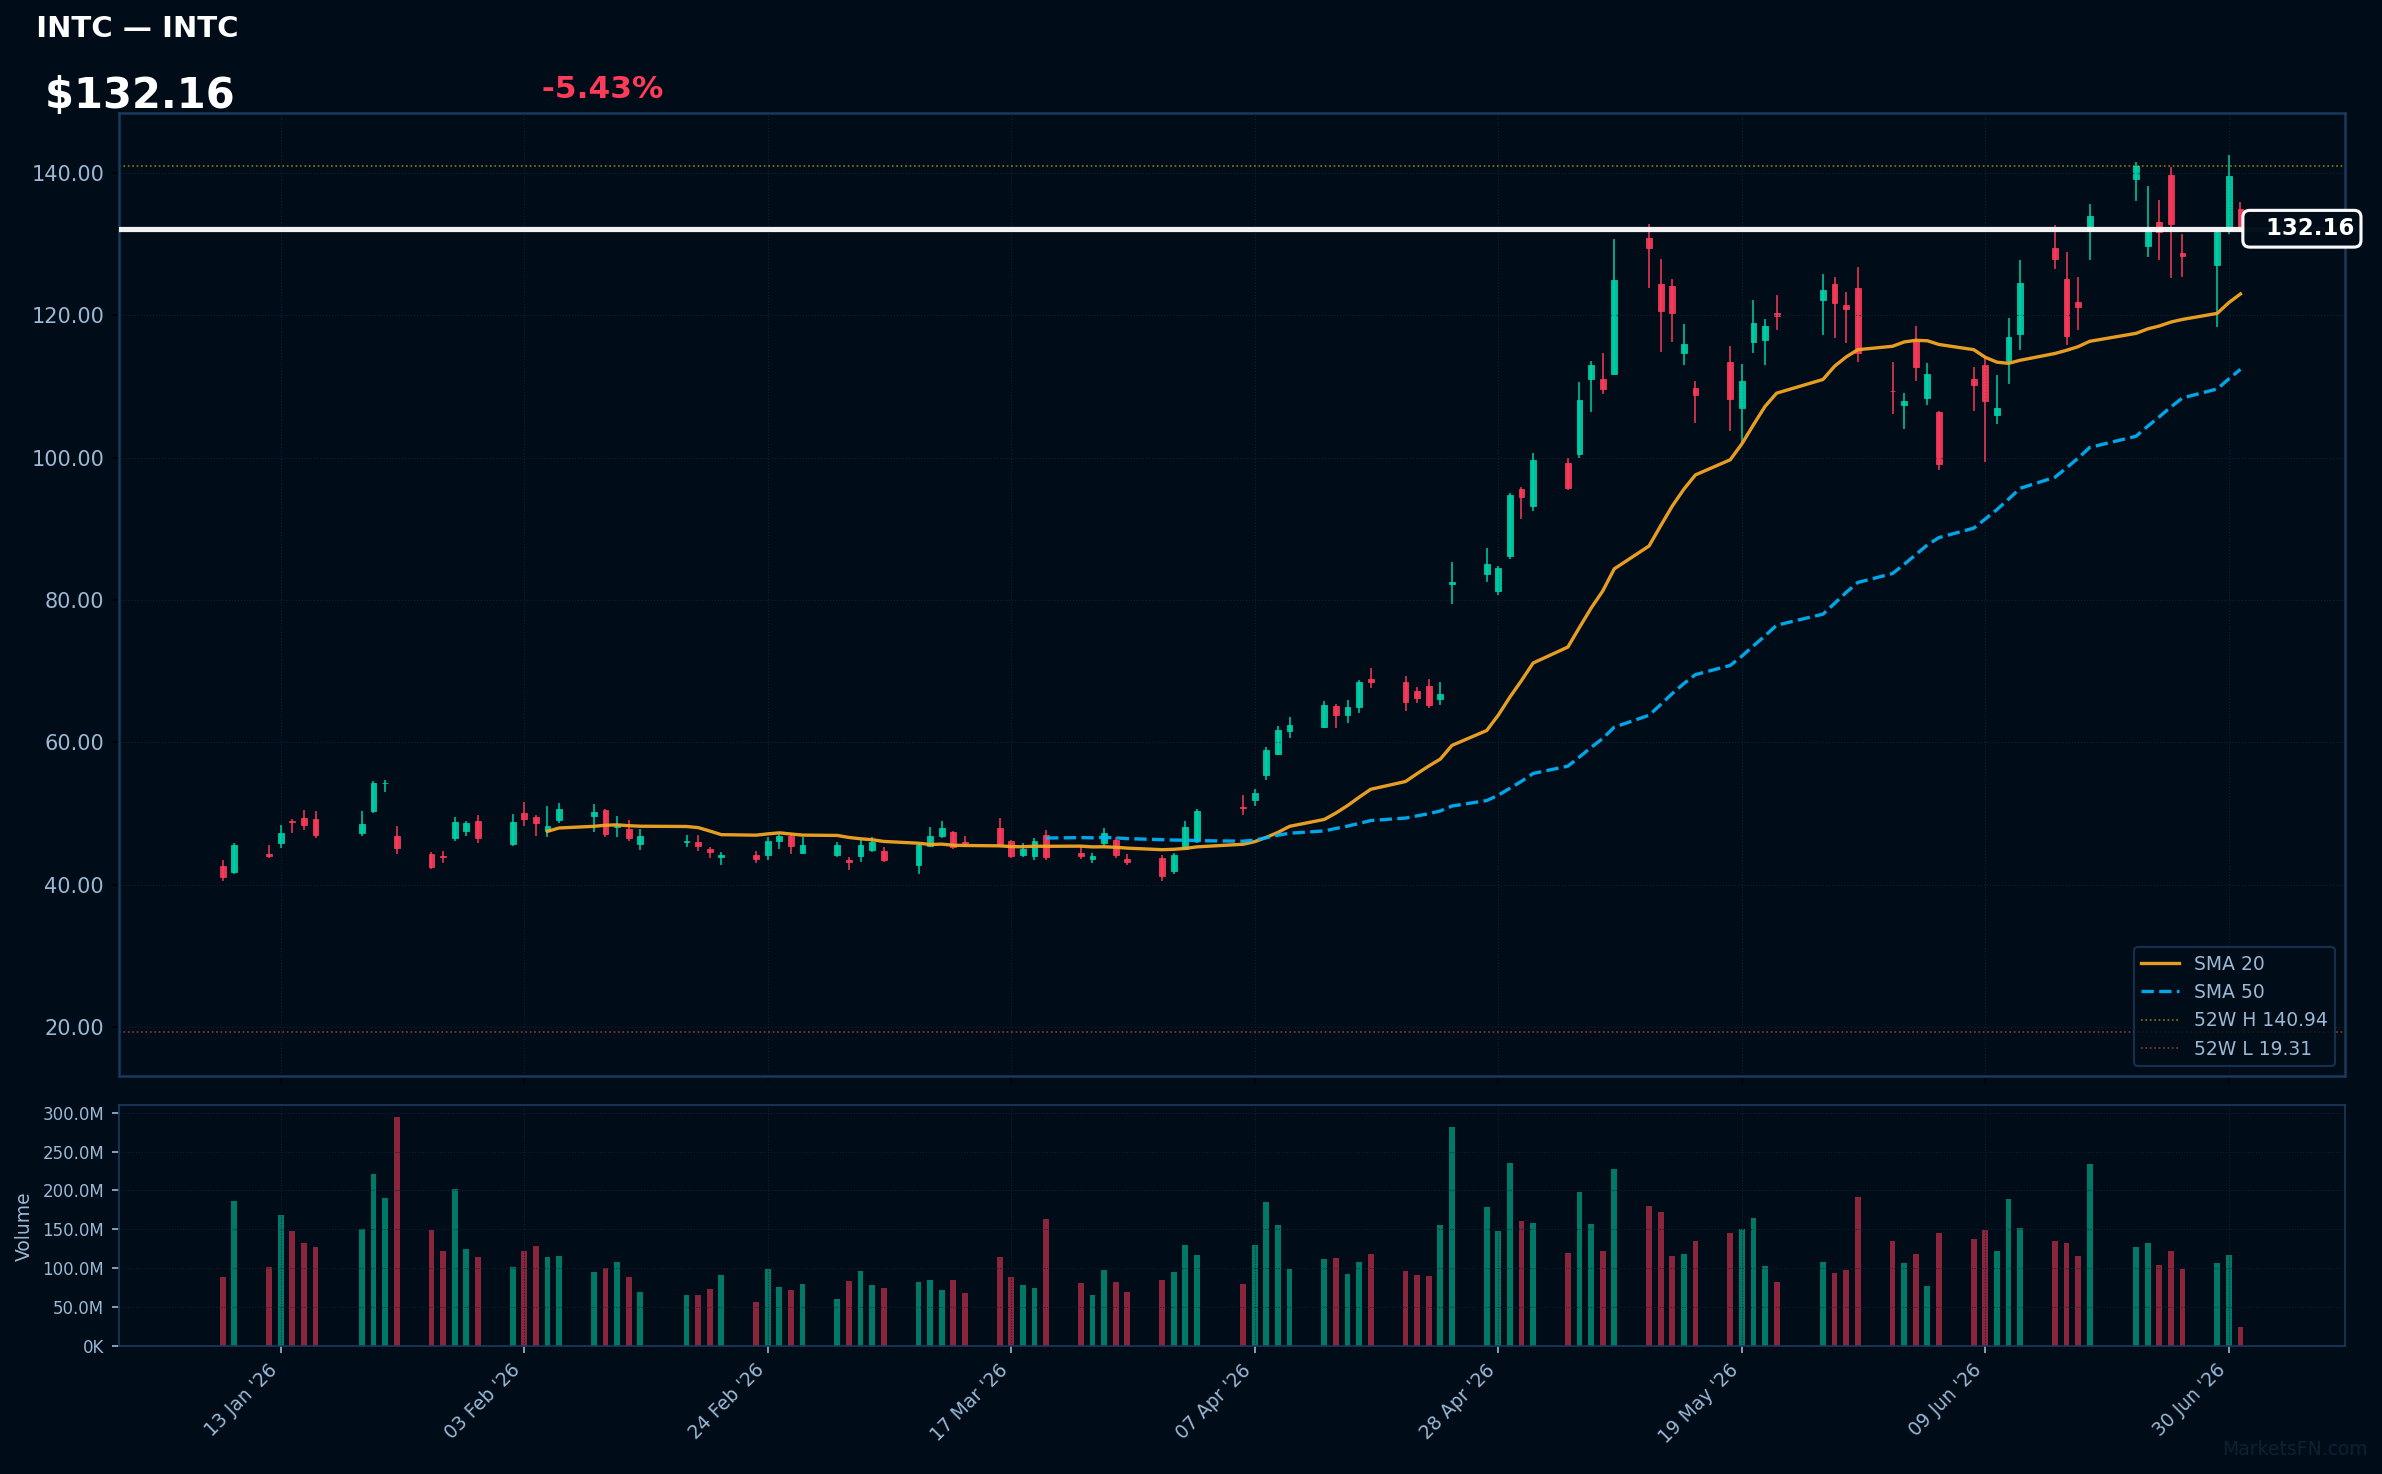
INTC | Intel Corp | Technology | Price: $132.04 | Day: -5.43% | 1W: +0.39% | 1M: +20.89% | RSI: 57.0 | vs MA200: +120.5% | Trend: Above MA20, MA50, MA200
Recent headlines (last 12h)
- Why Did INTC, AMD, BB Stocks Surge To 52-Week Highs?
- Big Tech's first half was a story of hardware versus software
- Micron, Intel, AMD stock surge Q2 2026 AI chip rally
- Stock futures slip after chip stocks gained $2 trillion in Q2
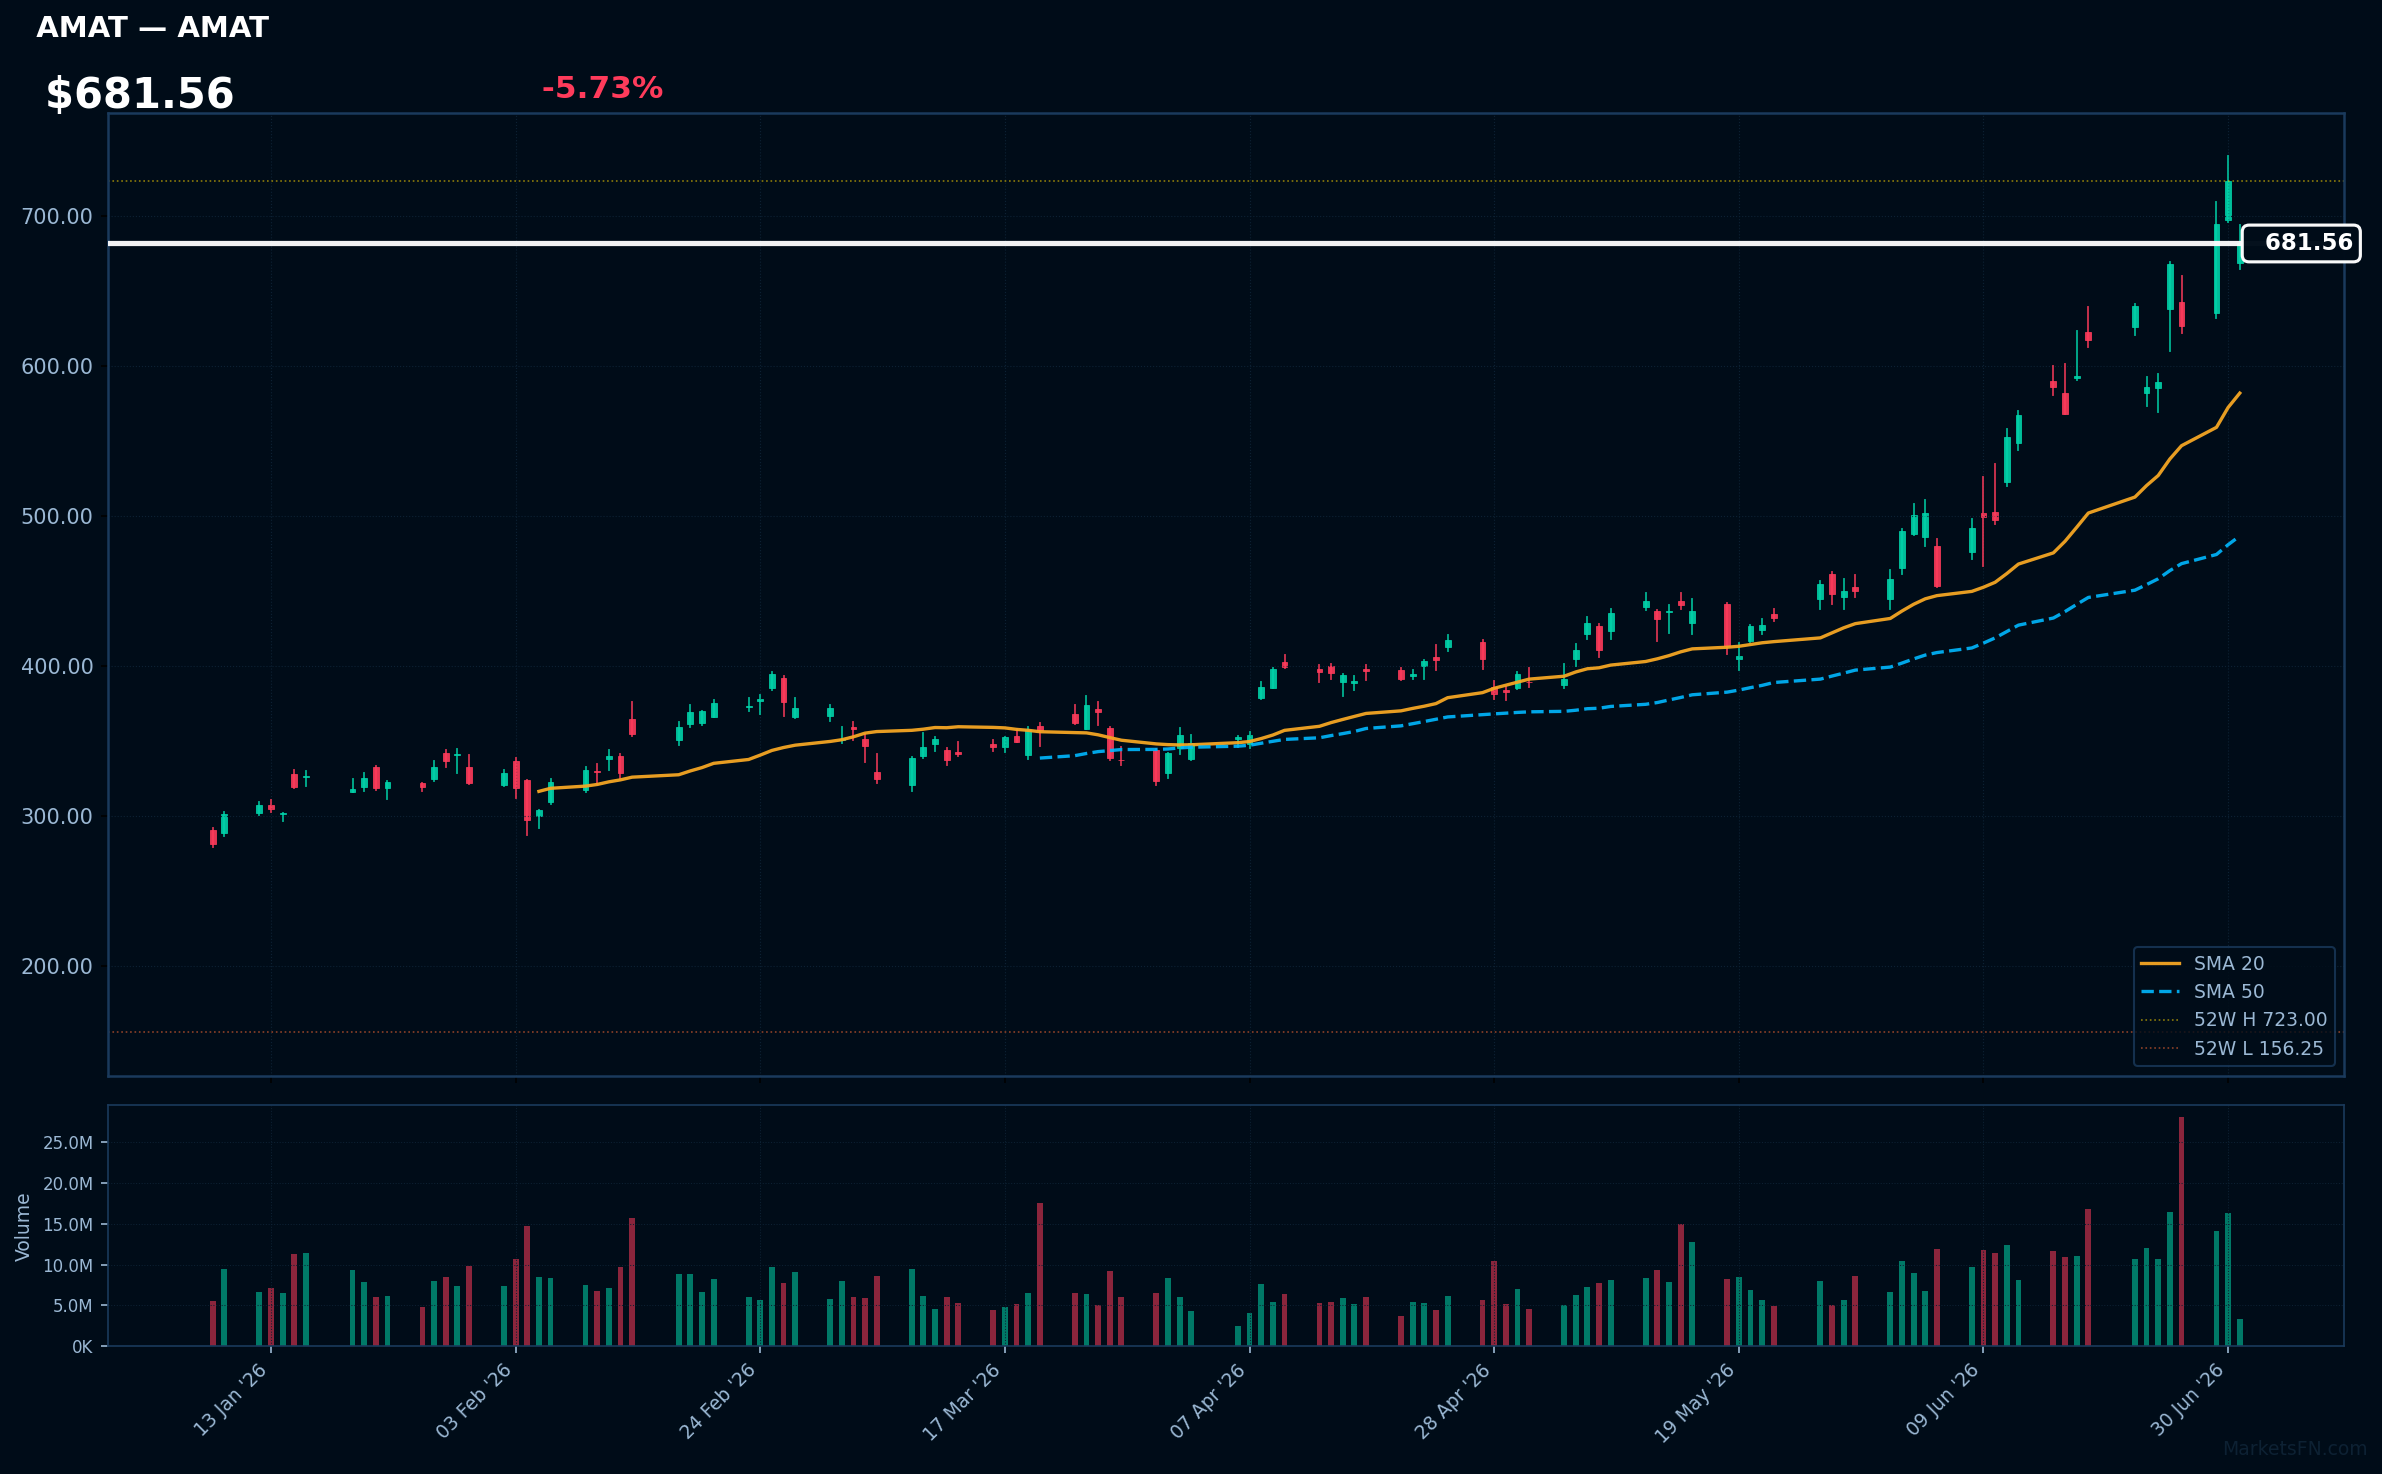
AMAT | Applied Materials Inc | Technology | Price: $681.55 | Day: -5.73% | 1W: +15.72% | 1M: +48.76% | RSI: 64.9 | vs MA200: +102.0% | Trend: Above MA20, MA50, MA200
Recent headlines (last 12h)
- Michael Burry Is Short NVDA, AMAT, SOXX Sees Big Korea Chip Spending As Beginning Of The End
- Wall Street weakens as technology stocks drag indexes lower
MU | Micron Technology Inc | Technology | Price: $1083.37 | Day: -6.14% | 1W: +3.31% | 1M: +4.61% | RSI: 54.9 | vs MA200: +145.9% | Trend: Above MA20, MA50, MA200
Recent headlines (last 12h)
- Dow falls 184 points as chip stocks pull back after record H1
- Scared of an AI stock bubble? Then don't look at this chart.
- General Motors shares rise after securing long-term Micron chip supply
- Almost 100% of the Nasdaq-100's gains in the first half of 2026 came from just 10 stocks
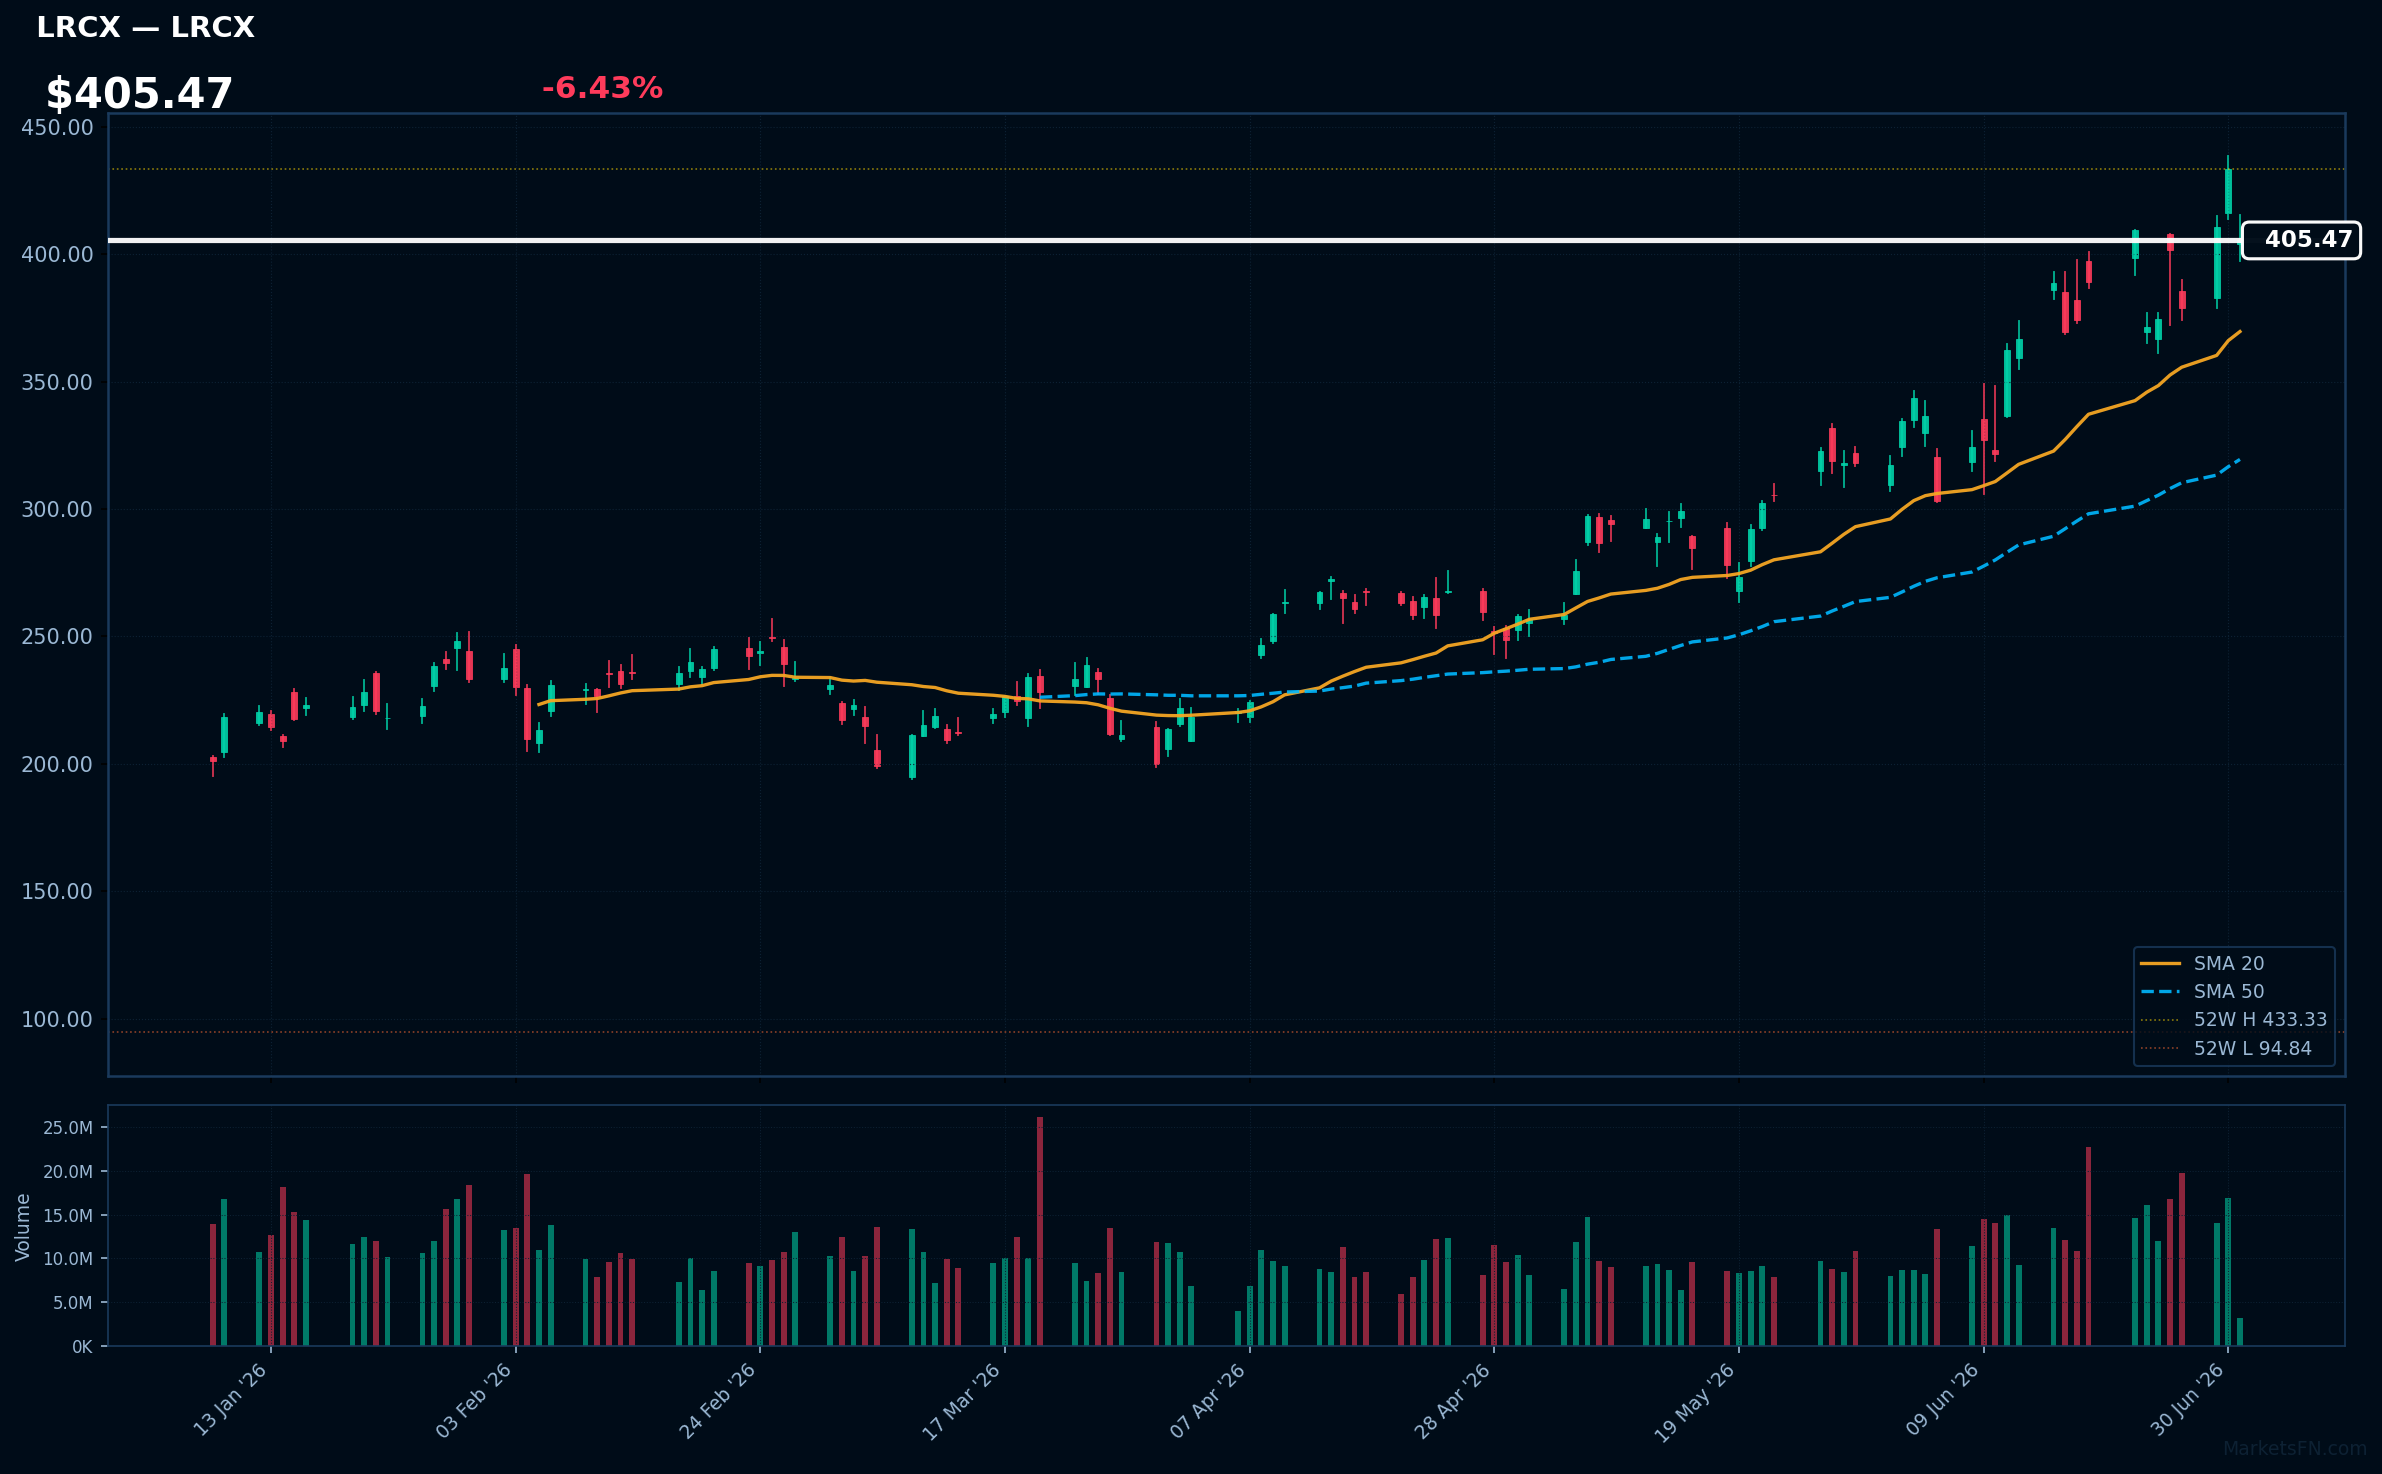
LRCX | Lam Research Corp | Technology | Price: $405.47 | Day: -6.43% | 1W: +8.18% | 1M: +27.86% | RSI: 59.6 | vs MA200: +82.9% | Trend: Above MA20, MA50, MA200
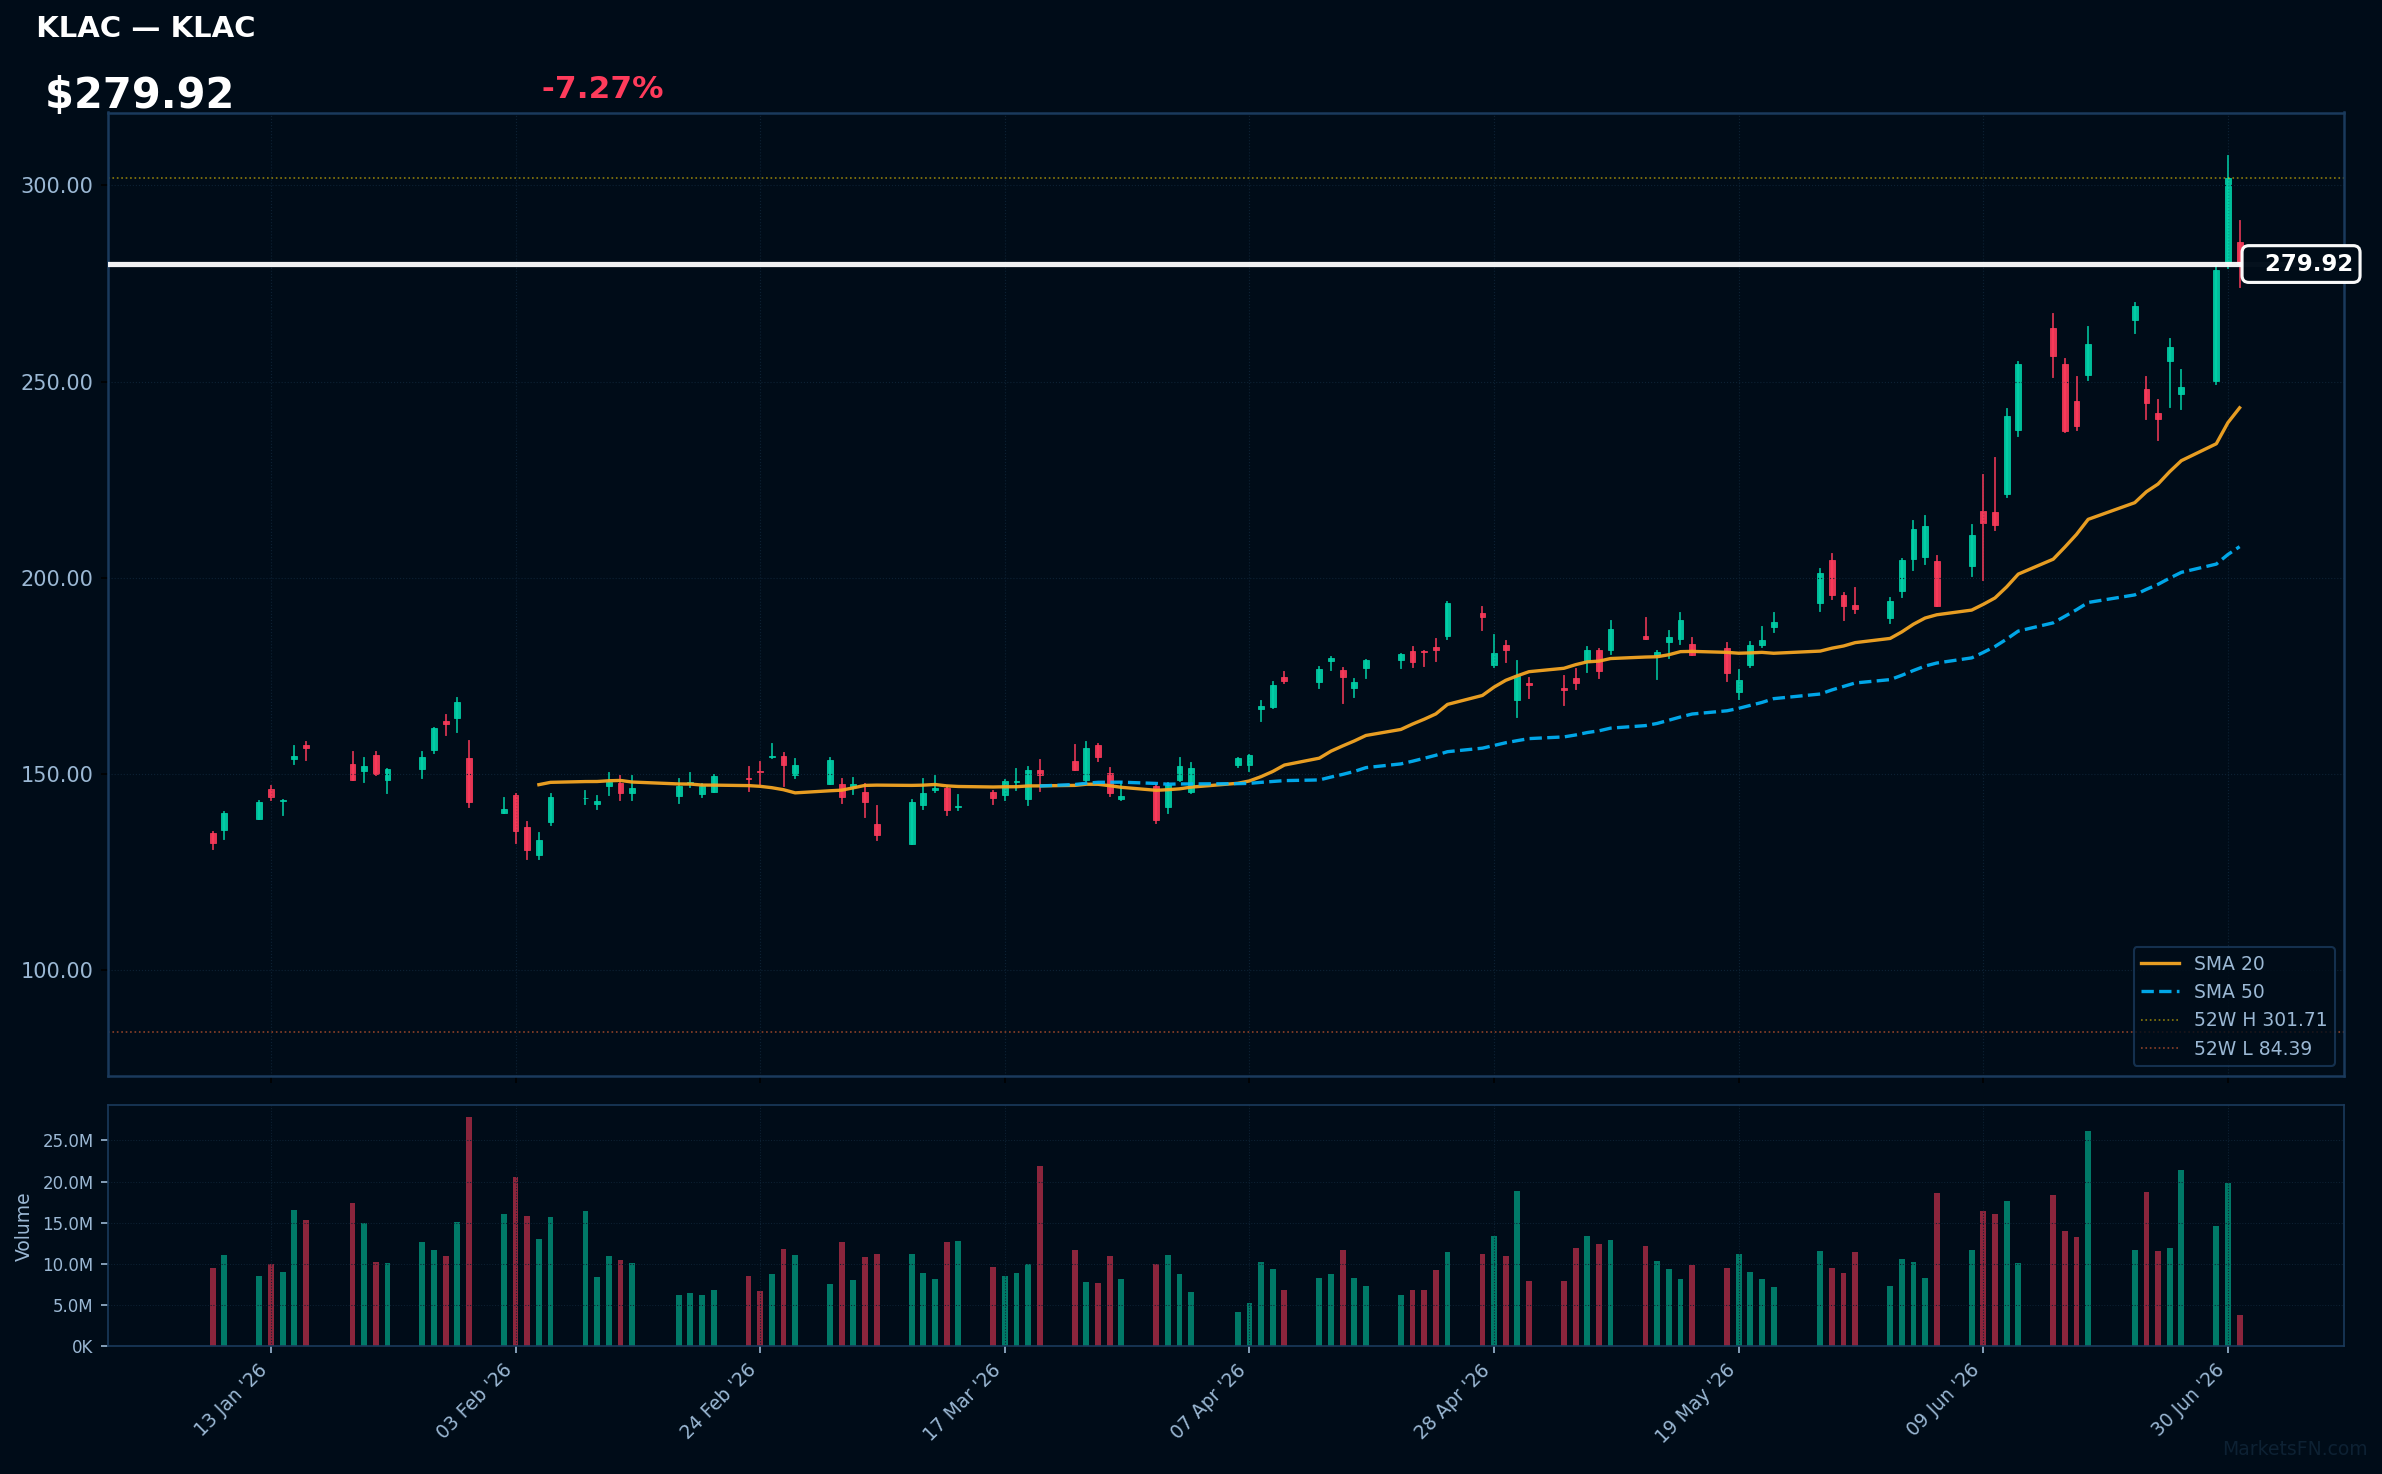
KLAC | KLA Corp | Technology | Price: $279.78 | Day: -7.27% | 1W: +16.40% | 1M: +44.29% | RSI: 62.5 | vs MA200: +84.8% | Trend: Above MA20, MA50, MA200
Market Commentary
The Nasdaq 100 session on July 01, 2026, showed a broad-based advance with 70 out of 101 constituents (69.3%) closing higher, indicating a positive tone. The average daily change was +1.23%, further reinforcing the bullish sentiment.
The technology sector exhibited a clear rotation, with some tech names leading gains (CRWD, MSTR, META, APP, PLTR, TEAM, AXON) while others were among the top losers (ASML, ARM, AMD, INTC, AMAT, MU, LRCX, KLAC). This divergence suggests a nuanced view within the sector, potentially driven by earnings or sector-specific news.
With only 13 stocks (12.9%) trading above their MA200, the index remains vulnerable to further downside pressure. Traders should monitor whether the current advance can sustain itself above key support levels or if the laggards will continue to drag the index lower. A break above/below the current levels could signal a continuation or reversal of the trend, making it a key level to watch.
Methodology
Daily ranking uses the latest session close versus the prior close. RSI (14-day EWM), MA20, MA50, and MA200 are computed from 12 months of daily OHLCV data sourced from Yahoo Finance. Charts show the last 120 trading sessions with SMA 20/50, 52-week H/L markers, and volume. Recent news (last 12 h) is sourced from FinViz. Updated every trading day.
Disclaimer
The content on MarketsFN.com is provided for educational and informational purposes only. It does not constitute financial advice, investment recommendations, or trading guidance. All investments involve risks, and past performance does not guarantee future results. You are solely responsible for your investment decisions and should conduct independent research and consult a qualified financial advisor before acting. MarketsFN.com and its authors are not liable for any losses or damages arising from your use of this information.
Related Articles
- S&P 500 Bull & Bear Radar — July 01, 2026 — S&P 500 Bull & Bear Radar — July 01, 2026 A daily technical sweep of 496 S&P 500 constituents ranked by session…
- Nasdaq 100 52-Week Highs & Lows Radar: Palo Alto Networks (PANW), Constellation Energyoration (CEG) and more — Nasdaq 100 stocks nearest to their 52-week high and low. Bloomberg-style charts, RSI/MA analysis and Grok commentary.
- S&P 500 52-Week Highs & Lows Radar: GE Aerospace (GE), Constellation Energyoration (CEG) and more — S&P 500 stocks nearest to their 52-week high and low. Bloomberg-style charts, RSI/MA analysis and Grok commentary.
- Nasdaq 100 2026 YTD Highs & Lows Radar: ASML Holding NV (ASML), T-Mobile US (TMUS) and more — Nasdaq 100 stocks nearest to their 2026 year-to-date high and low. Bloomberg-style charts, RSI/MA analysis and Grok…
- S&P 500 2026 YTD Highs & Lows Radar: GE Aerospace (GE), T-Mobile US (TMUS) and more — S&P 500 stocks nearest to their 2026 year-to-date high and low. Bloomberg-style charts, RSI/MA analysis and Grok…