S&P 500 52-Week Highs & Lows Radar: GE Aerospace (GE), Constellation Energyoration (CEG) and more
· Stocks · MarketsFN Team
S&P 500 52-Week Highs & Lows Radar: GE Aerospace (GE), Constellation Energyoration (CEG) and more
Screening all 503 S&P 500 constituents for stocks nearest to their 52-week high and their 52-week low. Data as of July 01, 2026. % Realized = 52-week total return.
Legend: RSI > 70 = overbought · RSI < 30 = oversold · Green % Realized = positive 52W return · Red = negative.
📈 Nearest to 52-Week High
Sectors represented: Industrials (1), Technology (1), Real Estate (1), Financial (1), Healthcare (1)
| Ticker | Company | Sector | Price Last | % Realized | 52-Week High Date | RSI | % above MA200 | Trend |
|---|---|---|---|---|---|---|---|---|
| GE | GE Aerospace | Industrials | $374.20 | +50.27% | 2026-07-01 | 74.6 | +21.1% | Above MA20, MA50, MA200 |
| PANW | Palo Alto Networks Inc | Technology | $346.19 | +75.22% | 2026-07-01 | 80.4 | +72.5% | Above MA20, MA50, MA200 |
| WELL | Welltower Inc | Real Estate | $228.67 | +50.84% | 2026-07-01 | 66.5 | +16.1% | Above MA20, MA50, MA200 |
| CB | Chubb Limited | Financial | $347.42 | +19.97% | 2026-07-01 | 67.4 | +11.8% | Above MA20, MA50, MA200 |
| VRTX | Vertex Pharmaceuticals, Inc | Healthcare | $499.79 | +10.53% | 2026-07-01 | 74.0 | +12.8% | Above MA20, MA50, MA200 |
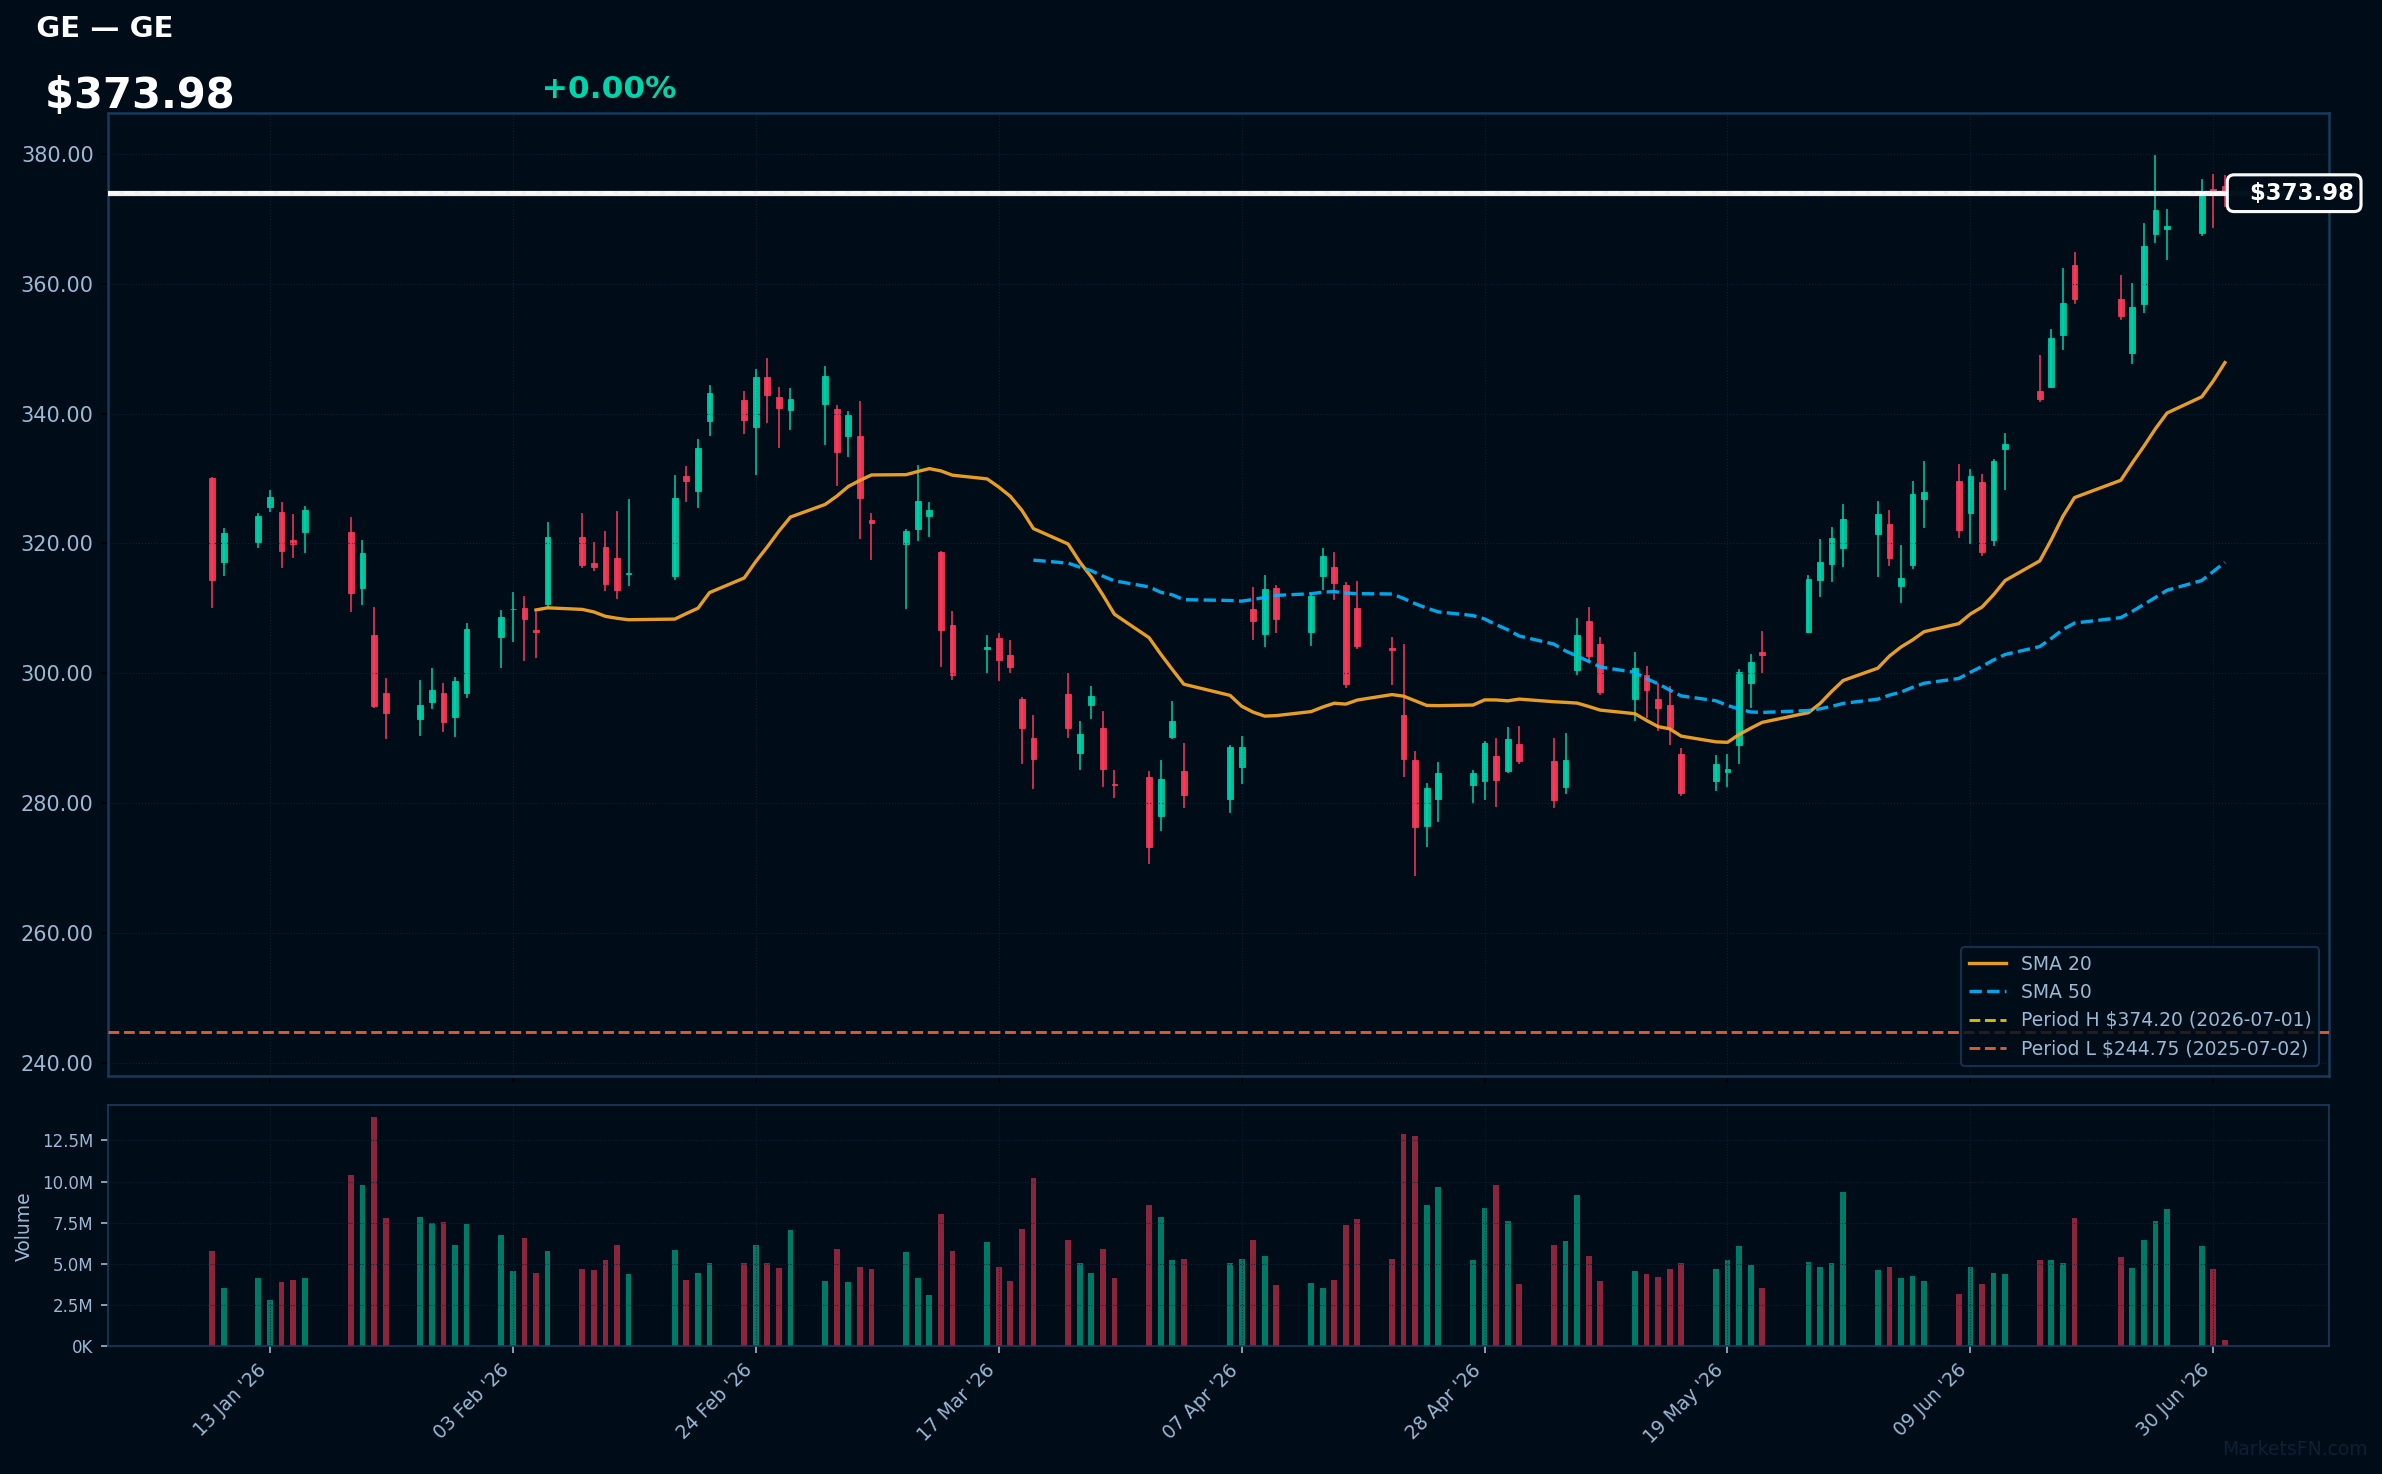
GE | GE Aerospace | Industrials | Price Last: $374.20 | % Realized: +50.27% | RSI: 74.6 | % above MA200: +21.1% | Trend: Above MA20, MA50, MA200
GE Aerospace is a leader in the aerospace industry, manufacturing commercial and military jet engines, as well as providing maintenance and repair services. Investors should care due to its significant market share and potential for long-term growth driven by increasing air travel demand.
GE Aerospace's current technical situation indicates strong momentum: RSI(14) is 74.6, nearing overbought territory, with a bullish MA alignment (price > MA20 > MA50 > MA200) and 0.0% below its 52-Week high, suggesting a potential breakout.
Related headlines
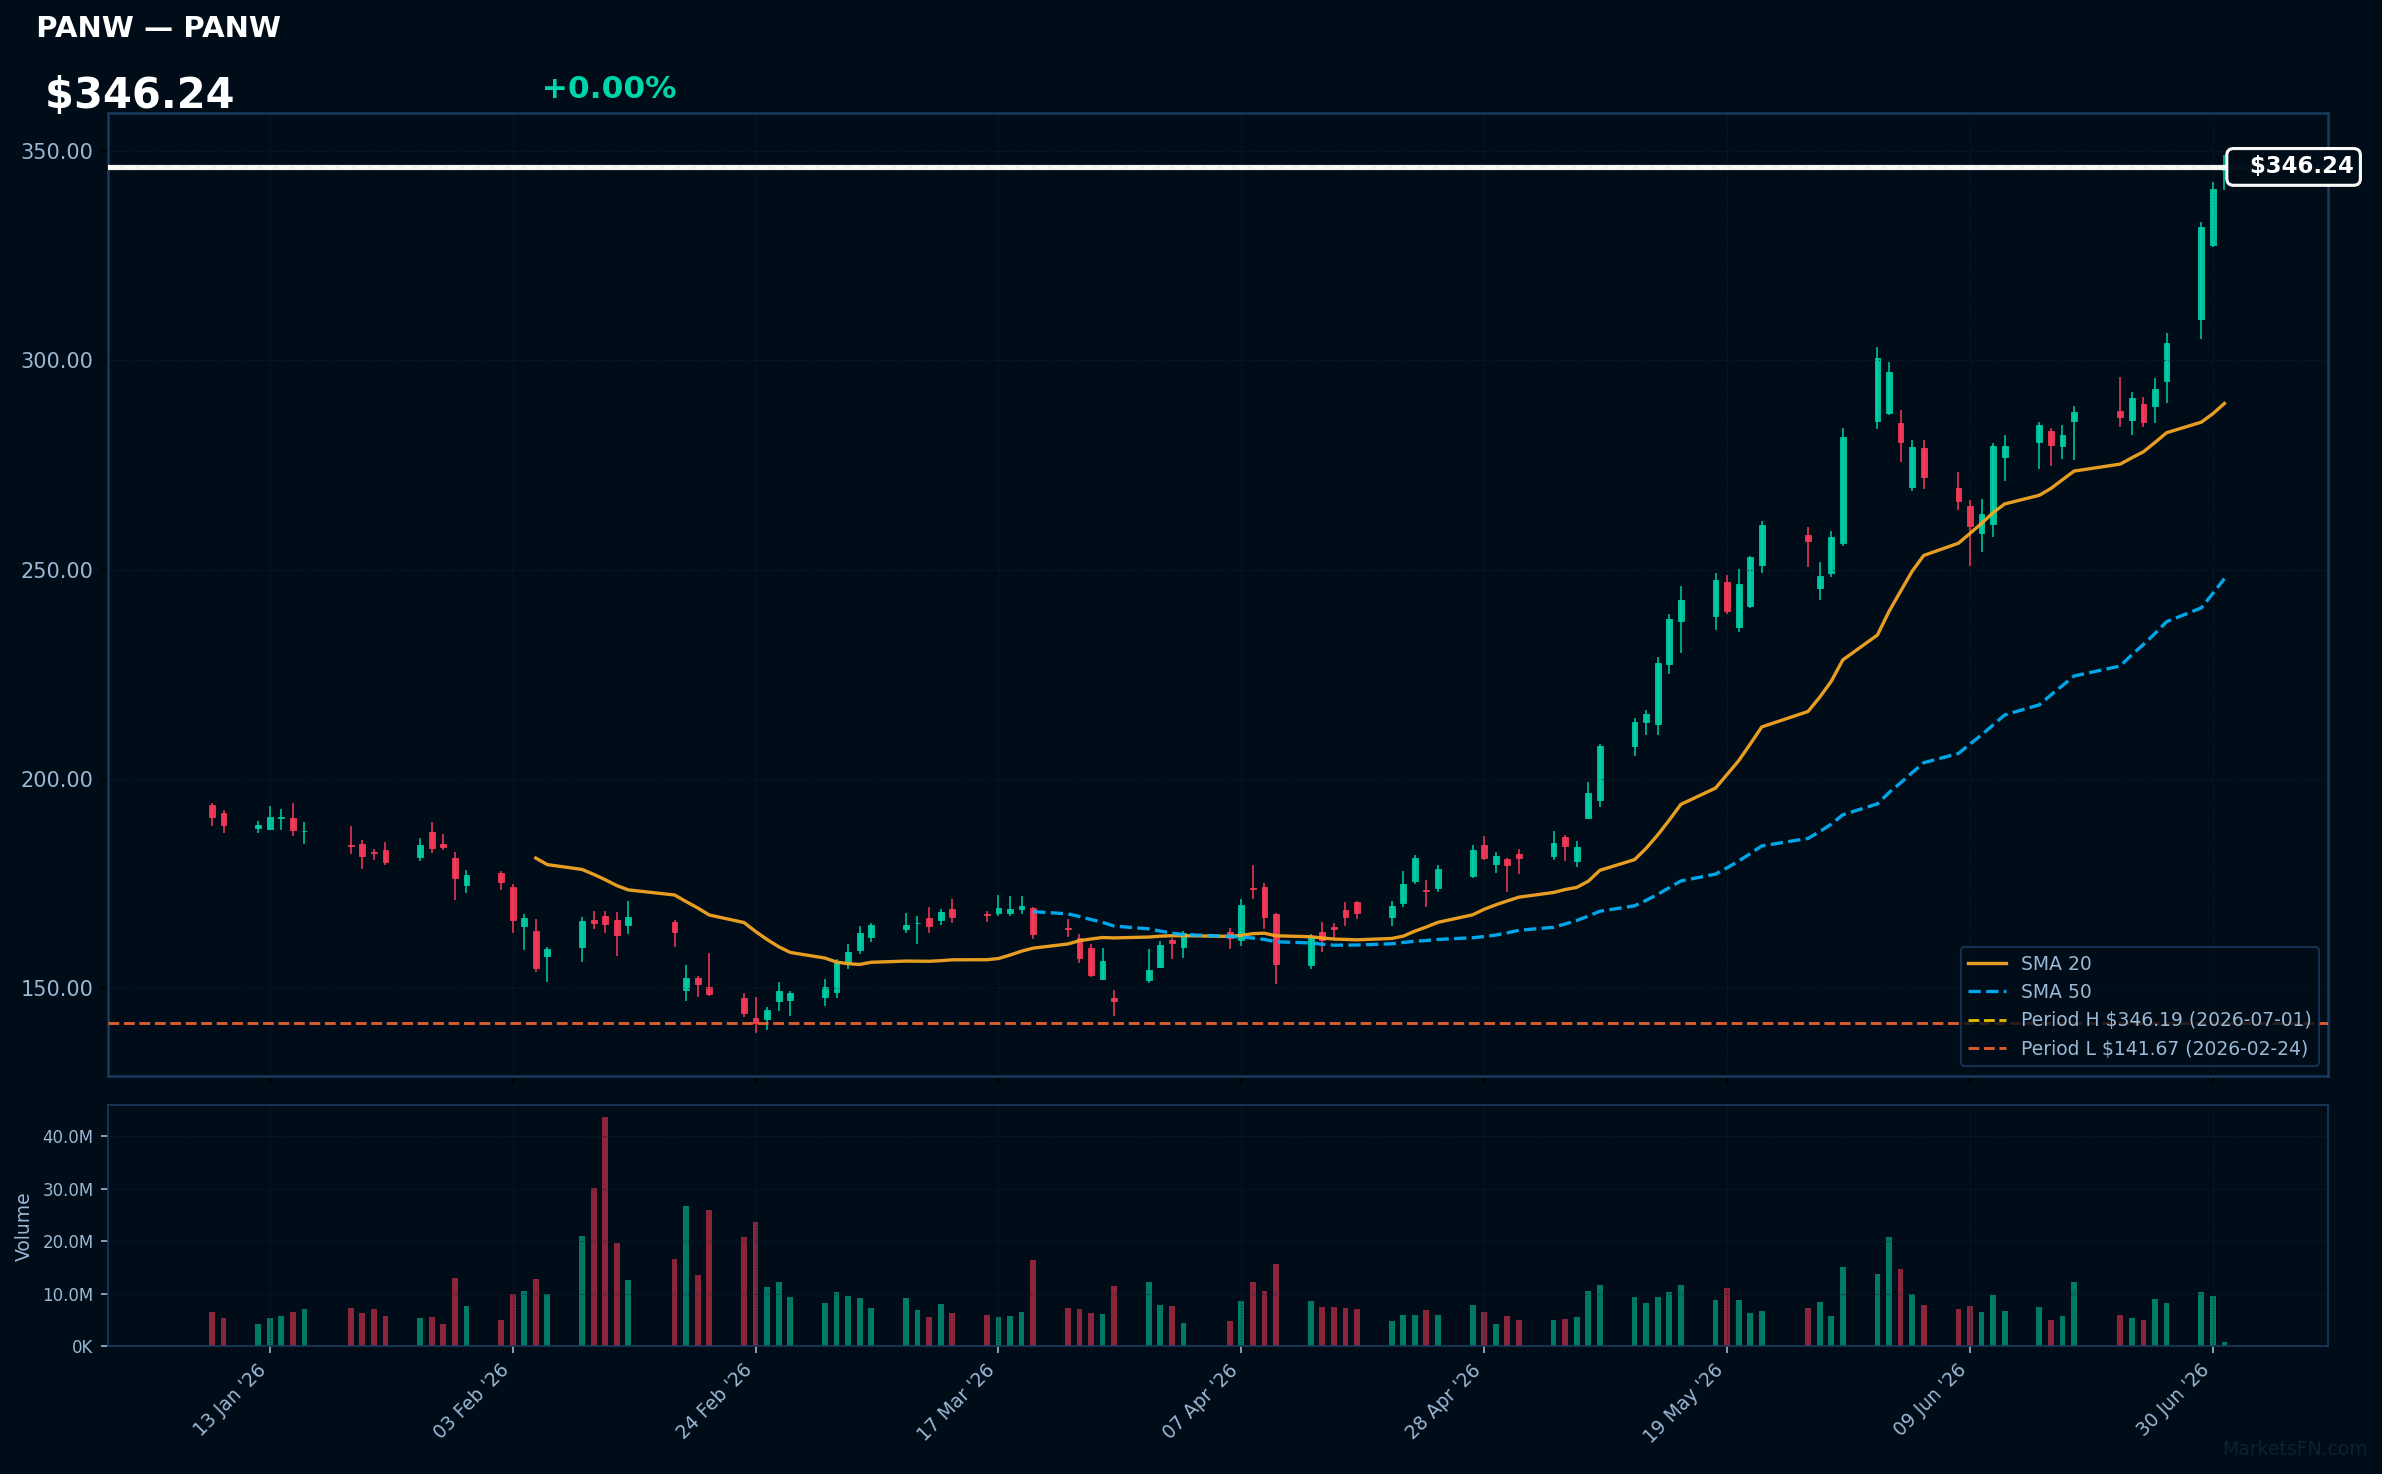
PANW | Palo Alto Networks Inc | Technology | Price Last: $346.19 | % Realized: +75.22% | RSI: 80.4 | % above MA200: +72.5% | Trend: Above MA20, MA50, MA200
Palo Alto Networks Inc is a cybersecurity company providing advanced threat prevention and security solutions. Investors should care due to its strong growth prospects driven by increasing demand for robust cybersecurity measures in a digitally transforming world.
Palo Alto Networks Inc is in a sustained uptrend with price at $346.24, RSI(14) at 80.4, and MA alignment: price > MA20 > MA50 > MA200. The stock is 0.0% below its 52-Week high, indicating potential breakout momentum.
Related headlines
- The Old-School Signal That Lit Up Palo Alto Networks Stock
- Is the Market Totally Wrong About PANW Stock?
- PANW vs CRWD vs AVGO: Morningstar Has A 'Top Pick' Trading At A 40% Discount After Earnings
- Palo Alto Networks and Deutsche Telekom Bring AI-Driven Security with Advanced Sovereignty Controls for European Regulated Industries
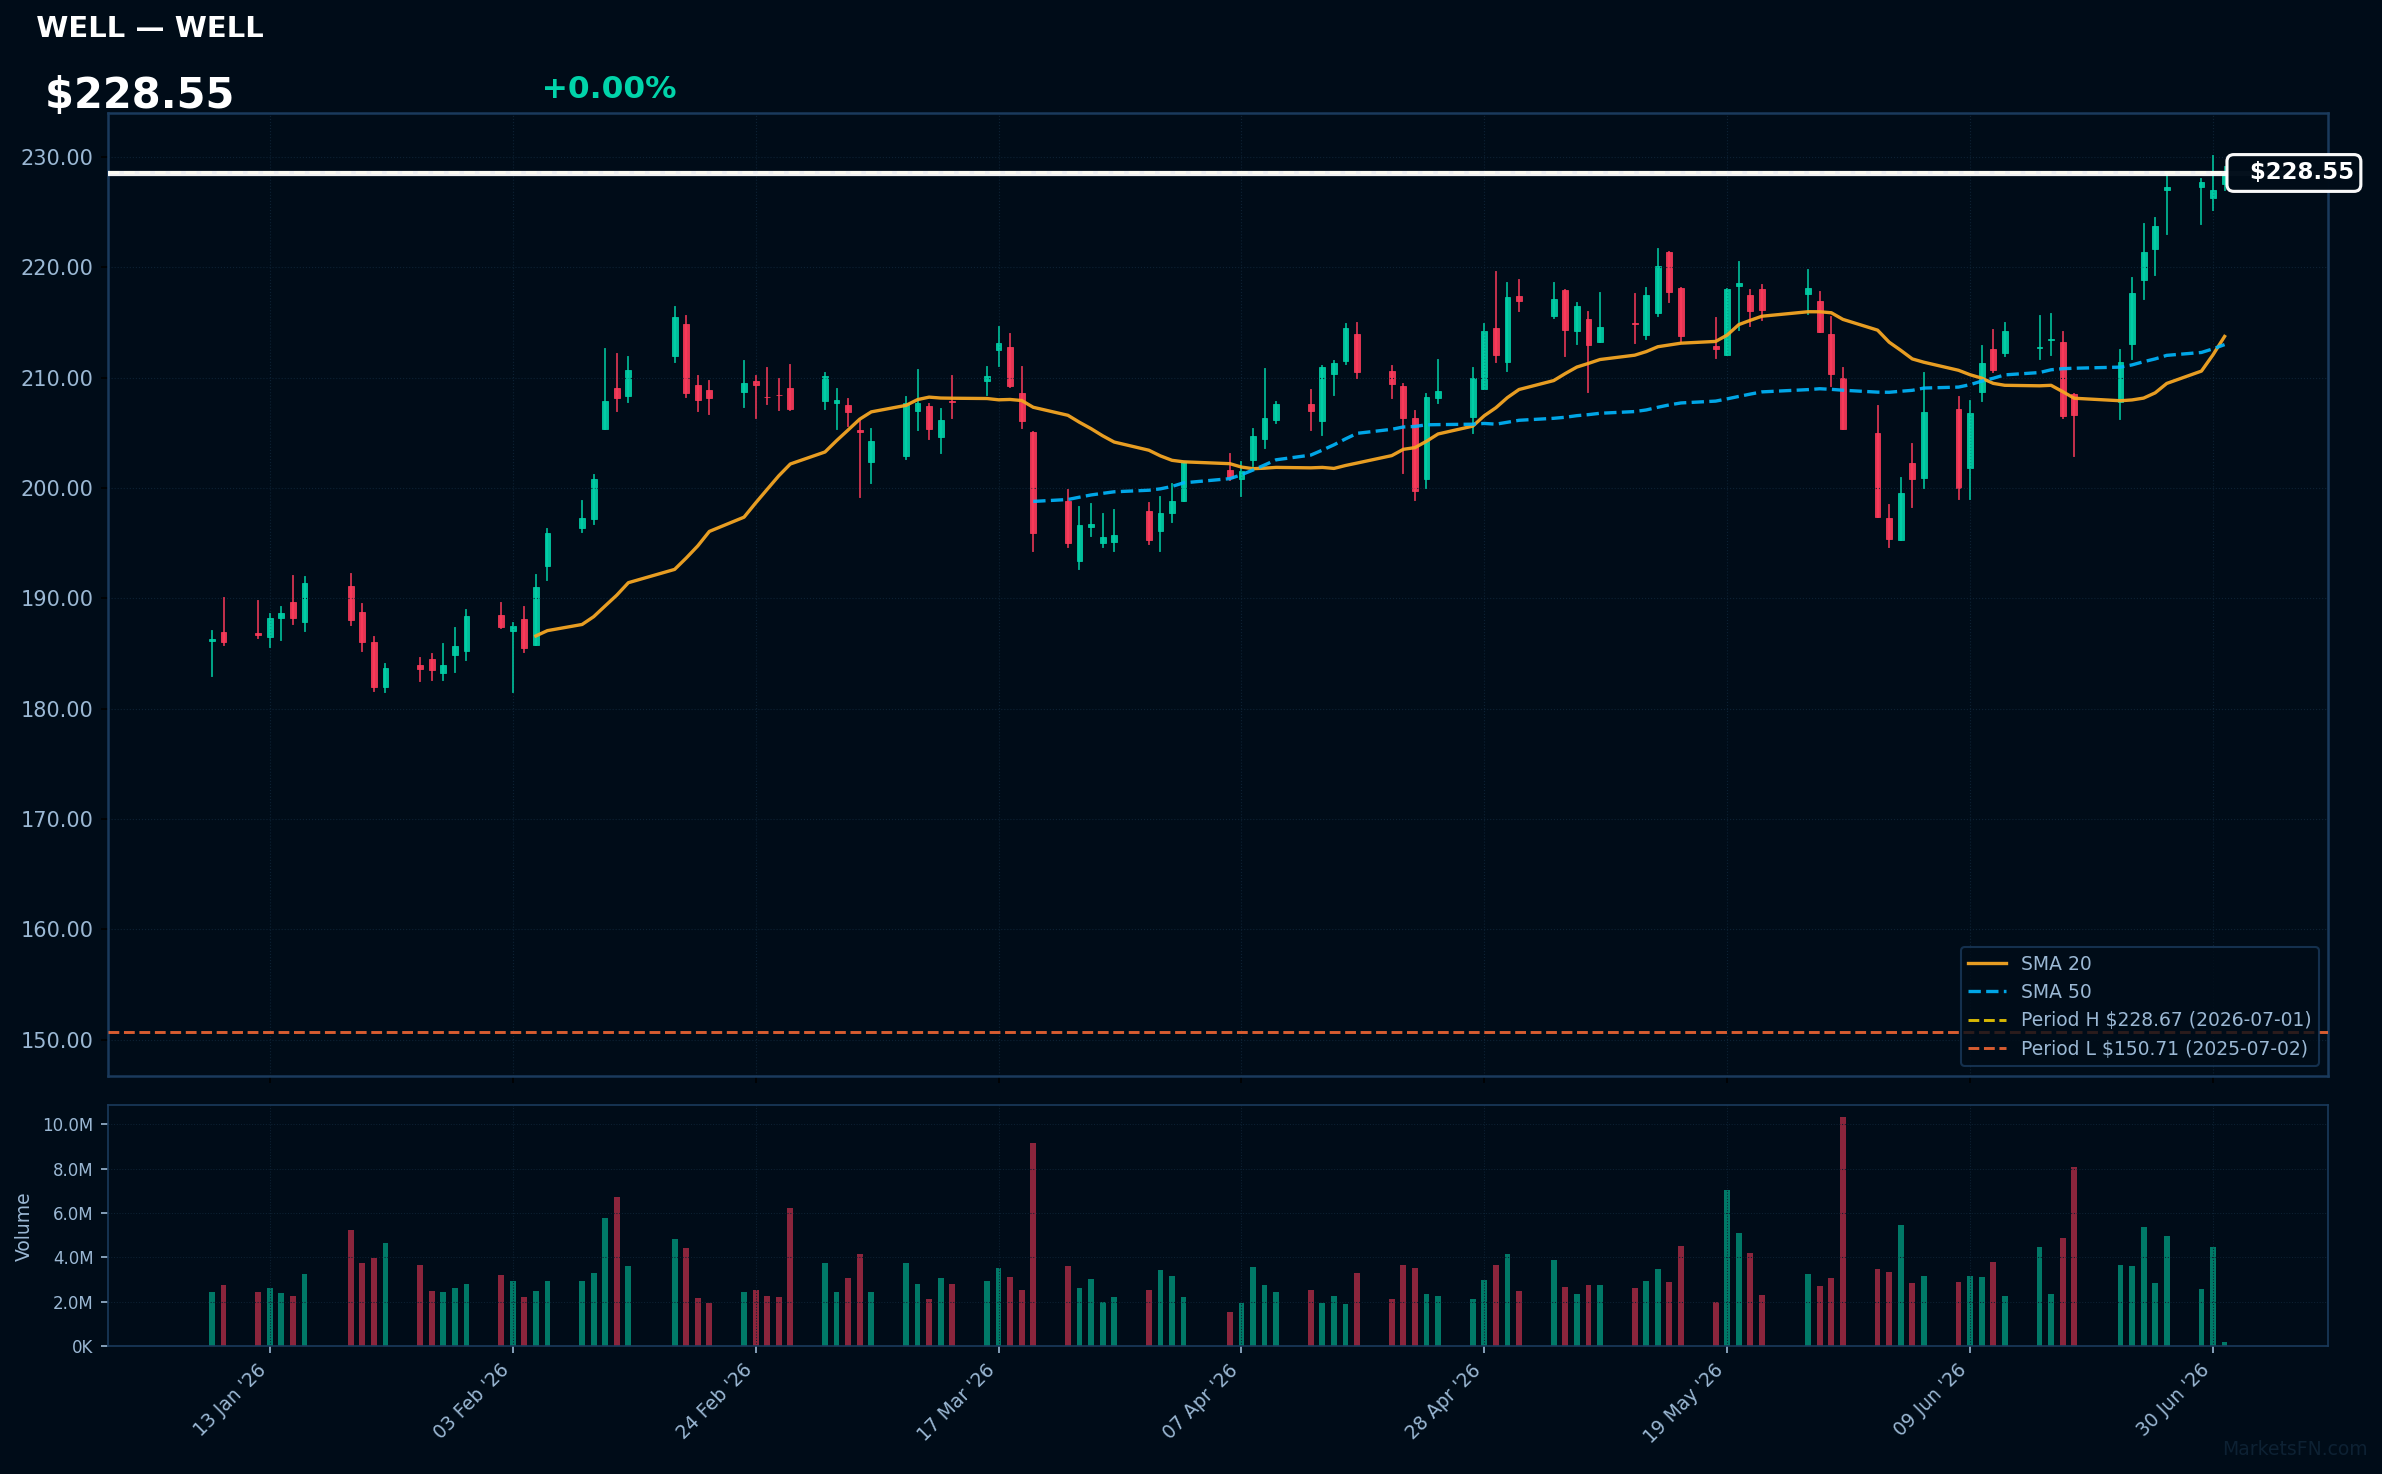
WELL | Welltower Inc | Real Estate | Price Last: $228.67 | % Realized: +50.84% | RSI: 66.5 | % above MA200: +16.1% | Trend: Above MA20, MA50, MA200
Welltower Inc (WELL) is a healthcare real estate investment trust that invests in seniors' housing and healthcare facilities. Investors should care because its performance is tied to the growing demand for healthcare services and seniors' housing.
WELL's RSI(14) is 66.5, indicating rising momentum. The MA alignment (price > MA20 > MA50 > MA200) is bullish, suggesting a sustained uptrend. With the stock 0.0% below its 52-Week high, it nears a potential breakout level.
Related headlines
- Welltower CFO Timothy McHugh sets U.S. pay record at $167M
- Welltower Announces Date of Second Quarter 2026 Earnings Release, Conference Call and Webcast
- Welltower's Dividend Is Up 15%. Here's What Really Matters.
- Welltower Board of Directors Approves 15% Increase in Quarterly Dividend to $0.85 per Share
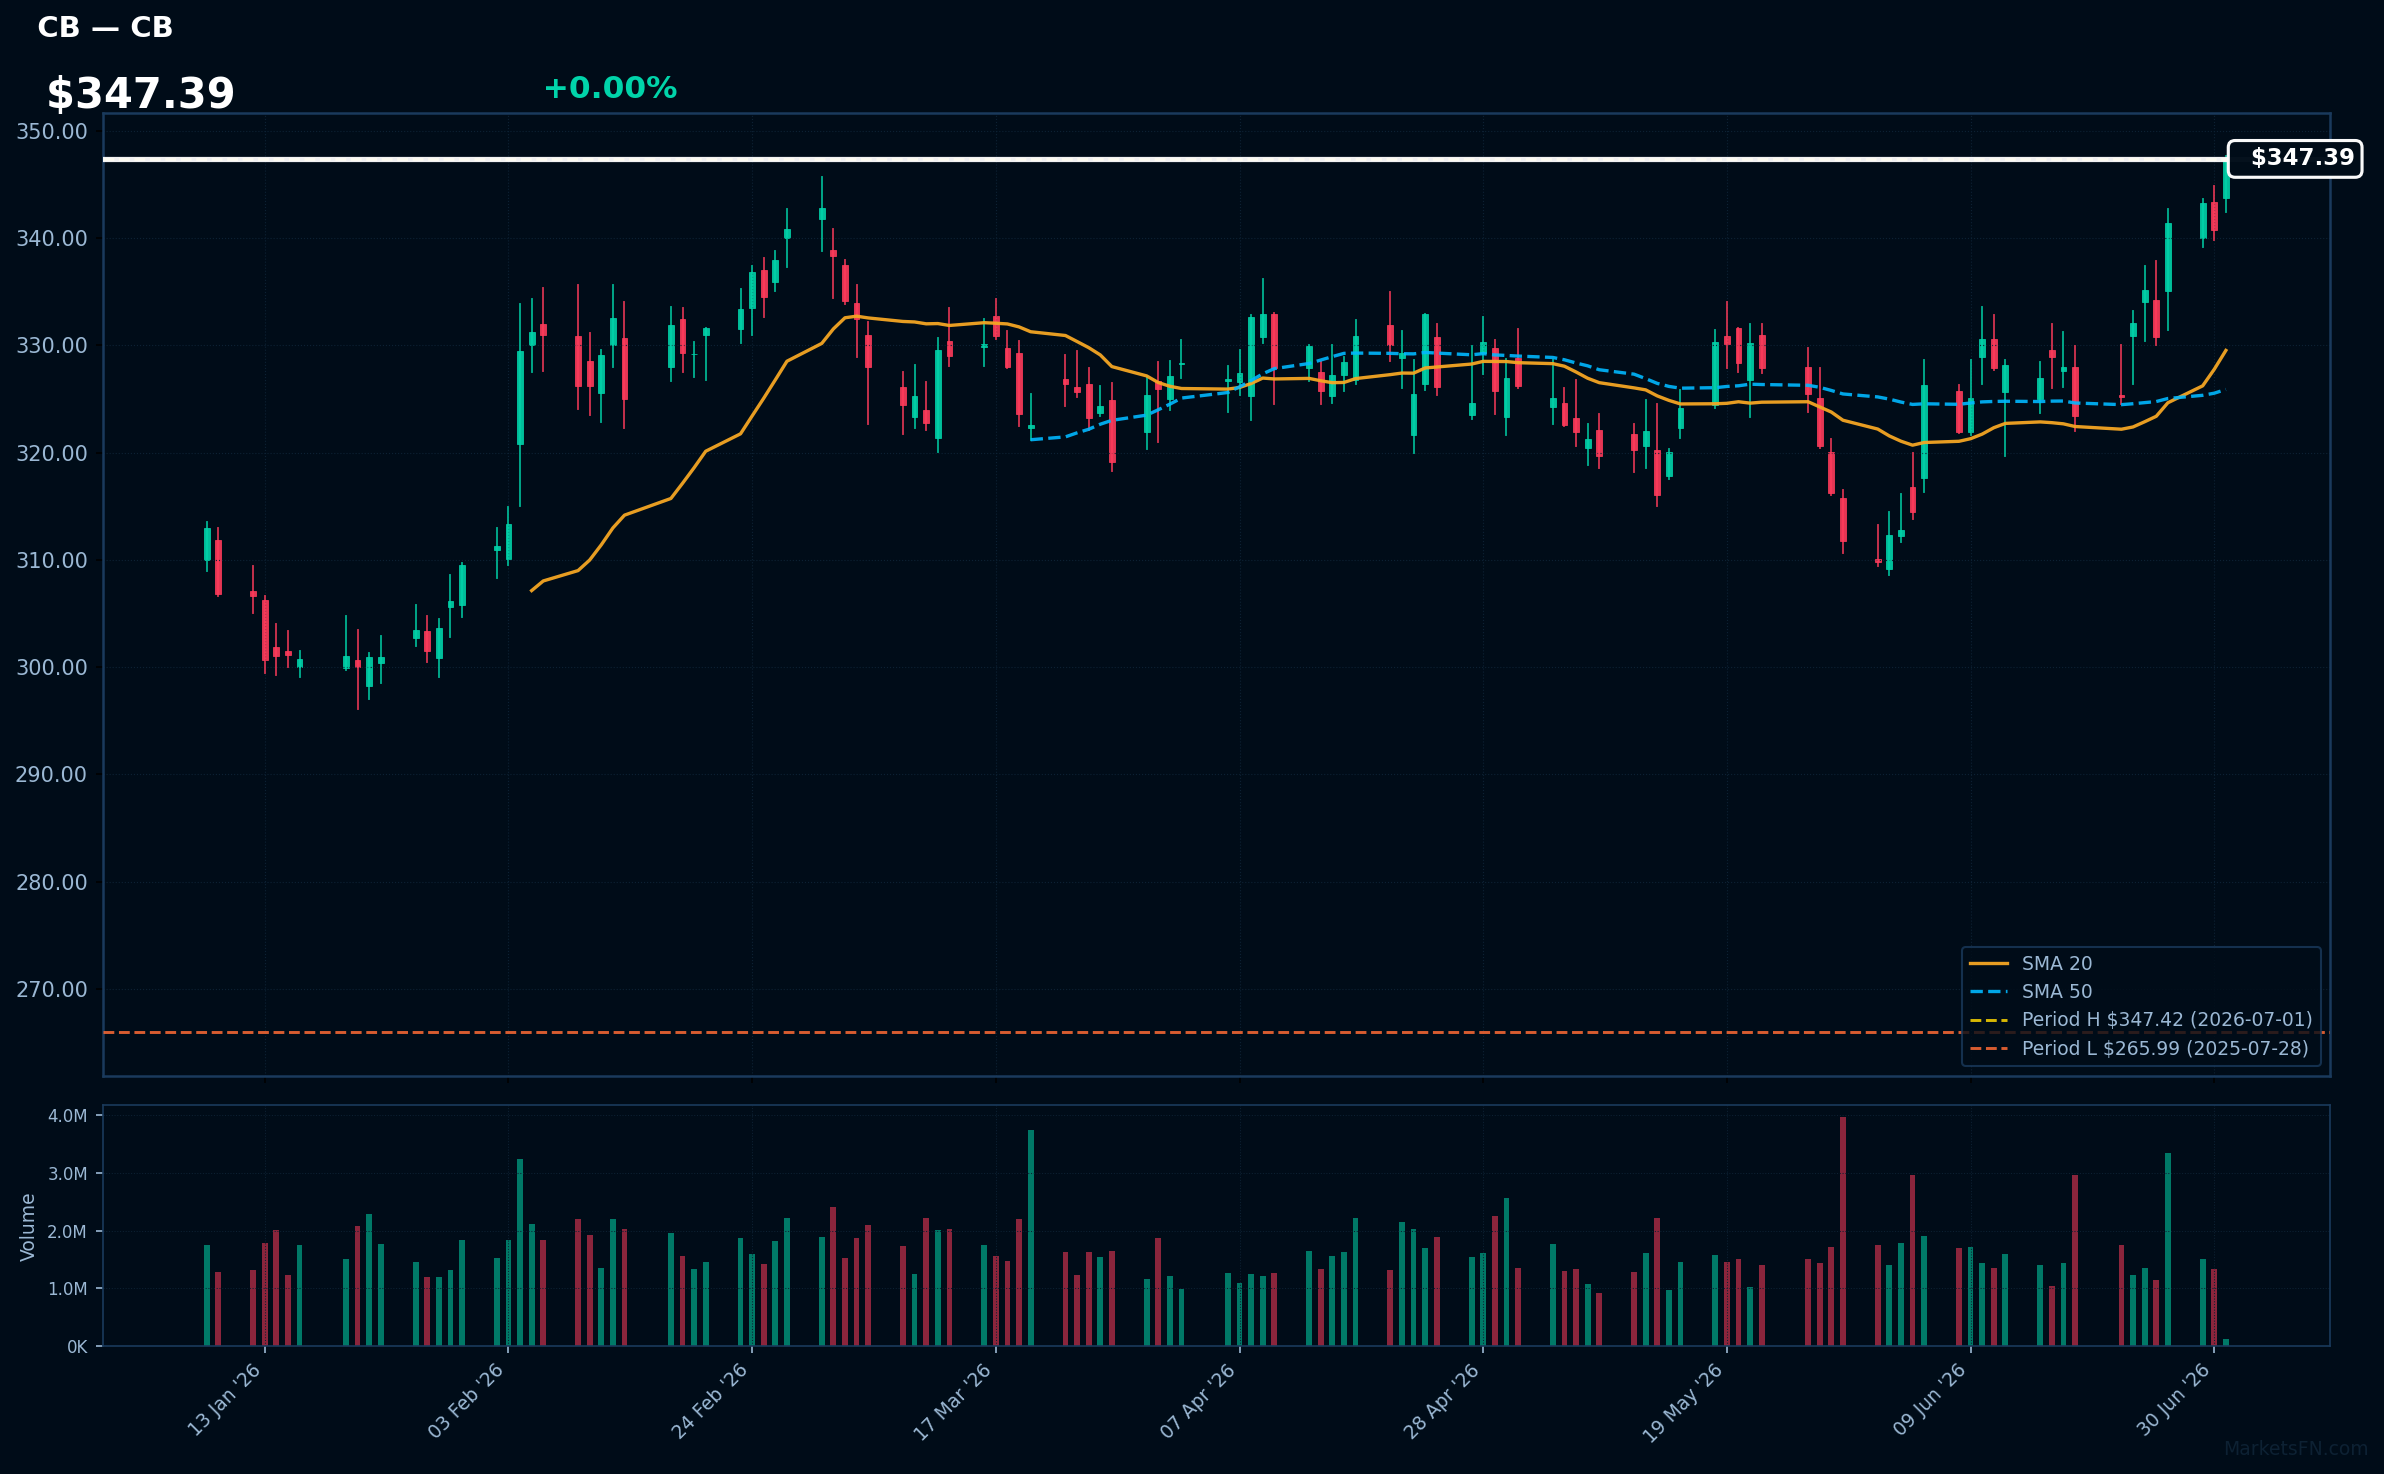
CB | Chubb Limited | Financial | Price Last: $347.42 | % Realized: +19.97% | RSI: 67.4 | % above MA200: +11.8% | Trend: Above MA20, MA50, MA200
Chubb Limited is a global insurance company providing property and casualty insurance, reinsurance, and life insurance products. Investors should care about its ability to manage risk and price policies profitably amidst changing global conditions.
Chubb's current technical situation indicates strong momentum: RSI(14) is 67.4, and the stock is in a sustained uptrend with price > MA20 > MA50 > MA200. It's 0.0% below its 52-Week high, nearing a potential breakout.
Related headlines
- Chubb Limited to Hold its Second Quarter Earnings Conference Call on Wednesday, July 22, 2026
- Strait of Hormuz Operating in War Zone Environment, Chubb CEO Says
- Evan Greenberg's Chubb Is a P&C Insurance 'Masterpiece'
- Chubb Limited Shareholders Approve 33rd Consecutive Annual Dividend Increase; Chubb Limited Board Declares Record Date for First Dividend Installment and Authorizes New Share Repurchase Program
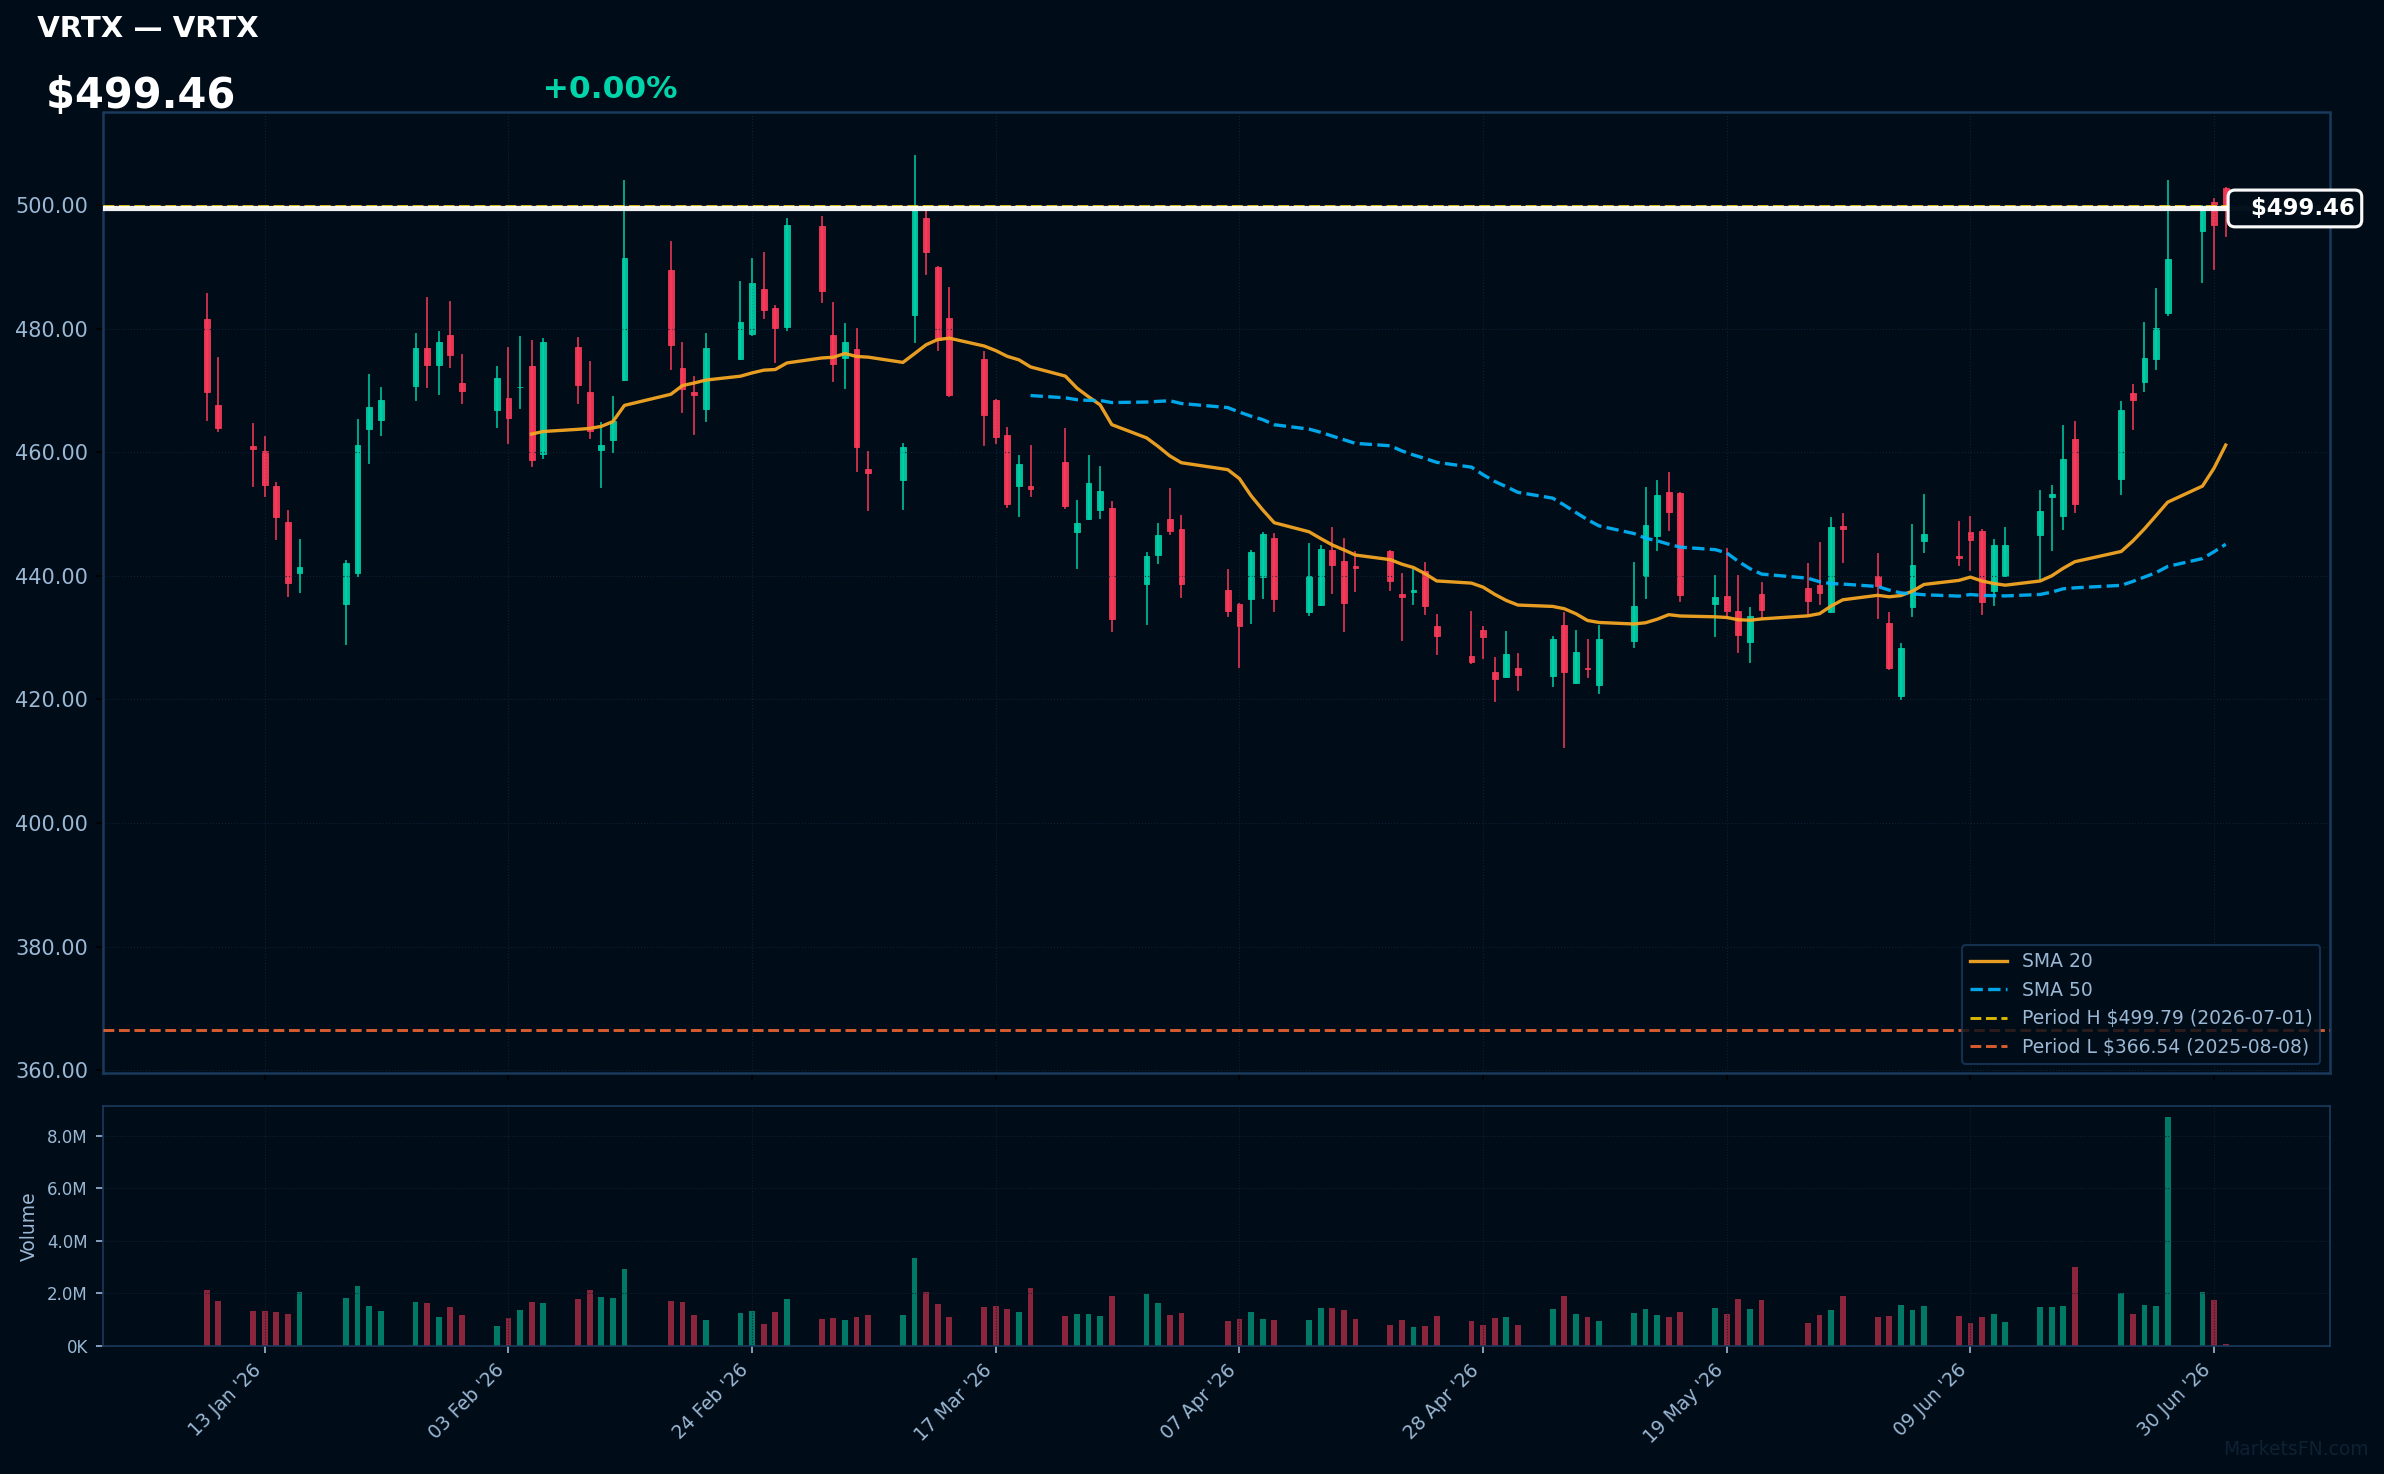
VRTX | Vertex Pharmaceuticals, Inc | Healthcare | Price Last: $499.79 | % Realized: +10.53% | RSI: 74.0 | % above MA200: +12.8% | Trend: Above MA20, MA50, MA200
Vertex Pharmaceuticals, Inc is a biotechnology company that develops and commercializes therapies for cystic fibrosis and other serious diseases, with a focus on treating the underlying cause of the condition, making it an attractive investment for those seeking exposure to the pharmaceutical industry.
Vertex Pharmaceuticals shows strong technical momentum with an RSI(14) of 74.0 and a bullish MA alignment (price > MA20 > MA50 > MA200), indicating a sustained uptrend. The stock is 0.0% below its 52-Week high, suggesting a potential breakout.
Related headlines
- Vertex Pharmaceuticals CFOs case for thinking like a portfolio manager
- Vertex Presents New Data on CASGEVY, Including First European Presentation of Data in Children Ages 5-11, at the European Hematology Association Congress and Announces Additional Global Regulatory Submissions
- Vertex Presents New Data on ALYFTREK at European Cystic Fibrosis Conference
- Vertex to Participate in the Goldman Sachs 47th Annual Global Healthcare Conference on June 10
📉 Nearest to 52-Week Low
Sectors represented: Consumer Cyclical (2), Utilities (1), Consumer Defensive (1), Real Estate (1)
| Ticker | Company | Sector | Price Last | % Realized | 52-Week Low Date | RSI | % above MA200 | Trend |
|---|---|---|---|---|---|---|---|---|
| CEG | Constellation Energy Corporation | Utilities | $239.86 | -22.10% | 2026-07-01 | 33.4 | -24.4% | Below MA20, MA50, MA200 |
| KR | Kroger Co | Consumer Defensive | $54.55 | -23.55% | 2026-07-01 | 28.6 | -17.4% | Below MA20, MA50, MA200 |
| LVS | Las Vegas Sands Corp | Consumer Cyclical | $45.92 | -3.08% | 2026-07-01 | 31.4 | -18.7% | Below MA20, MA50, MA200 |
| ULTA | Ulta Beauty Inc | Consumer Cyclical | $449.31 | -5.10% | 2026-07-01 | 38.5 | -20.0% | Below MA20, MA50, MA200 |
| CCI | Crown Castle Inc | Real Estate | $75.77 | -26.95% | 2026-06-30 | 30.3 | -14.8% | Below MA20, MA50, MA200 |
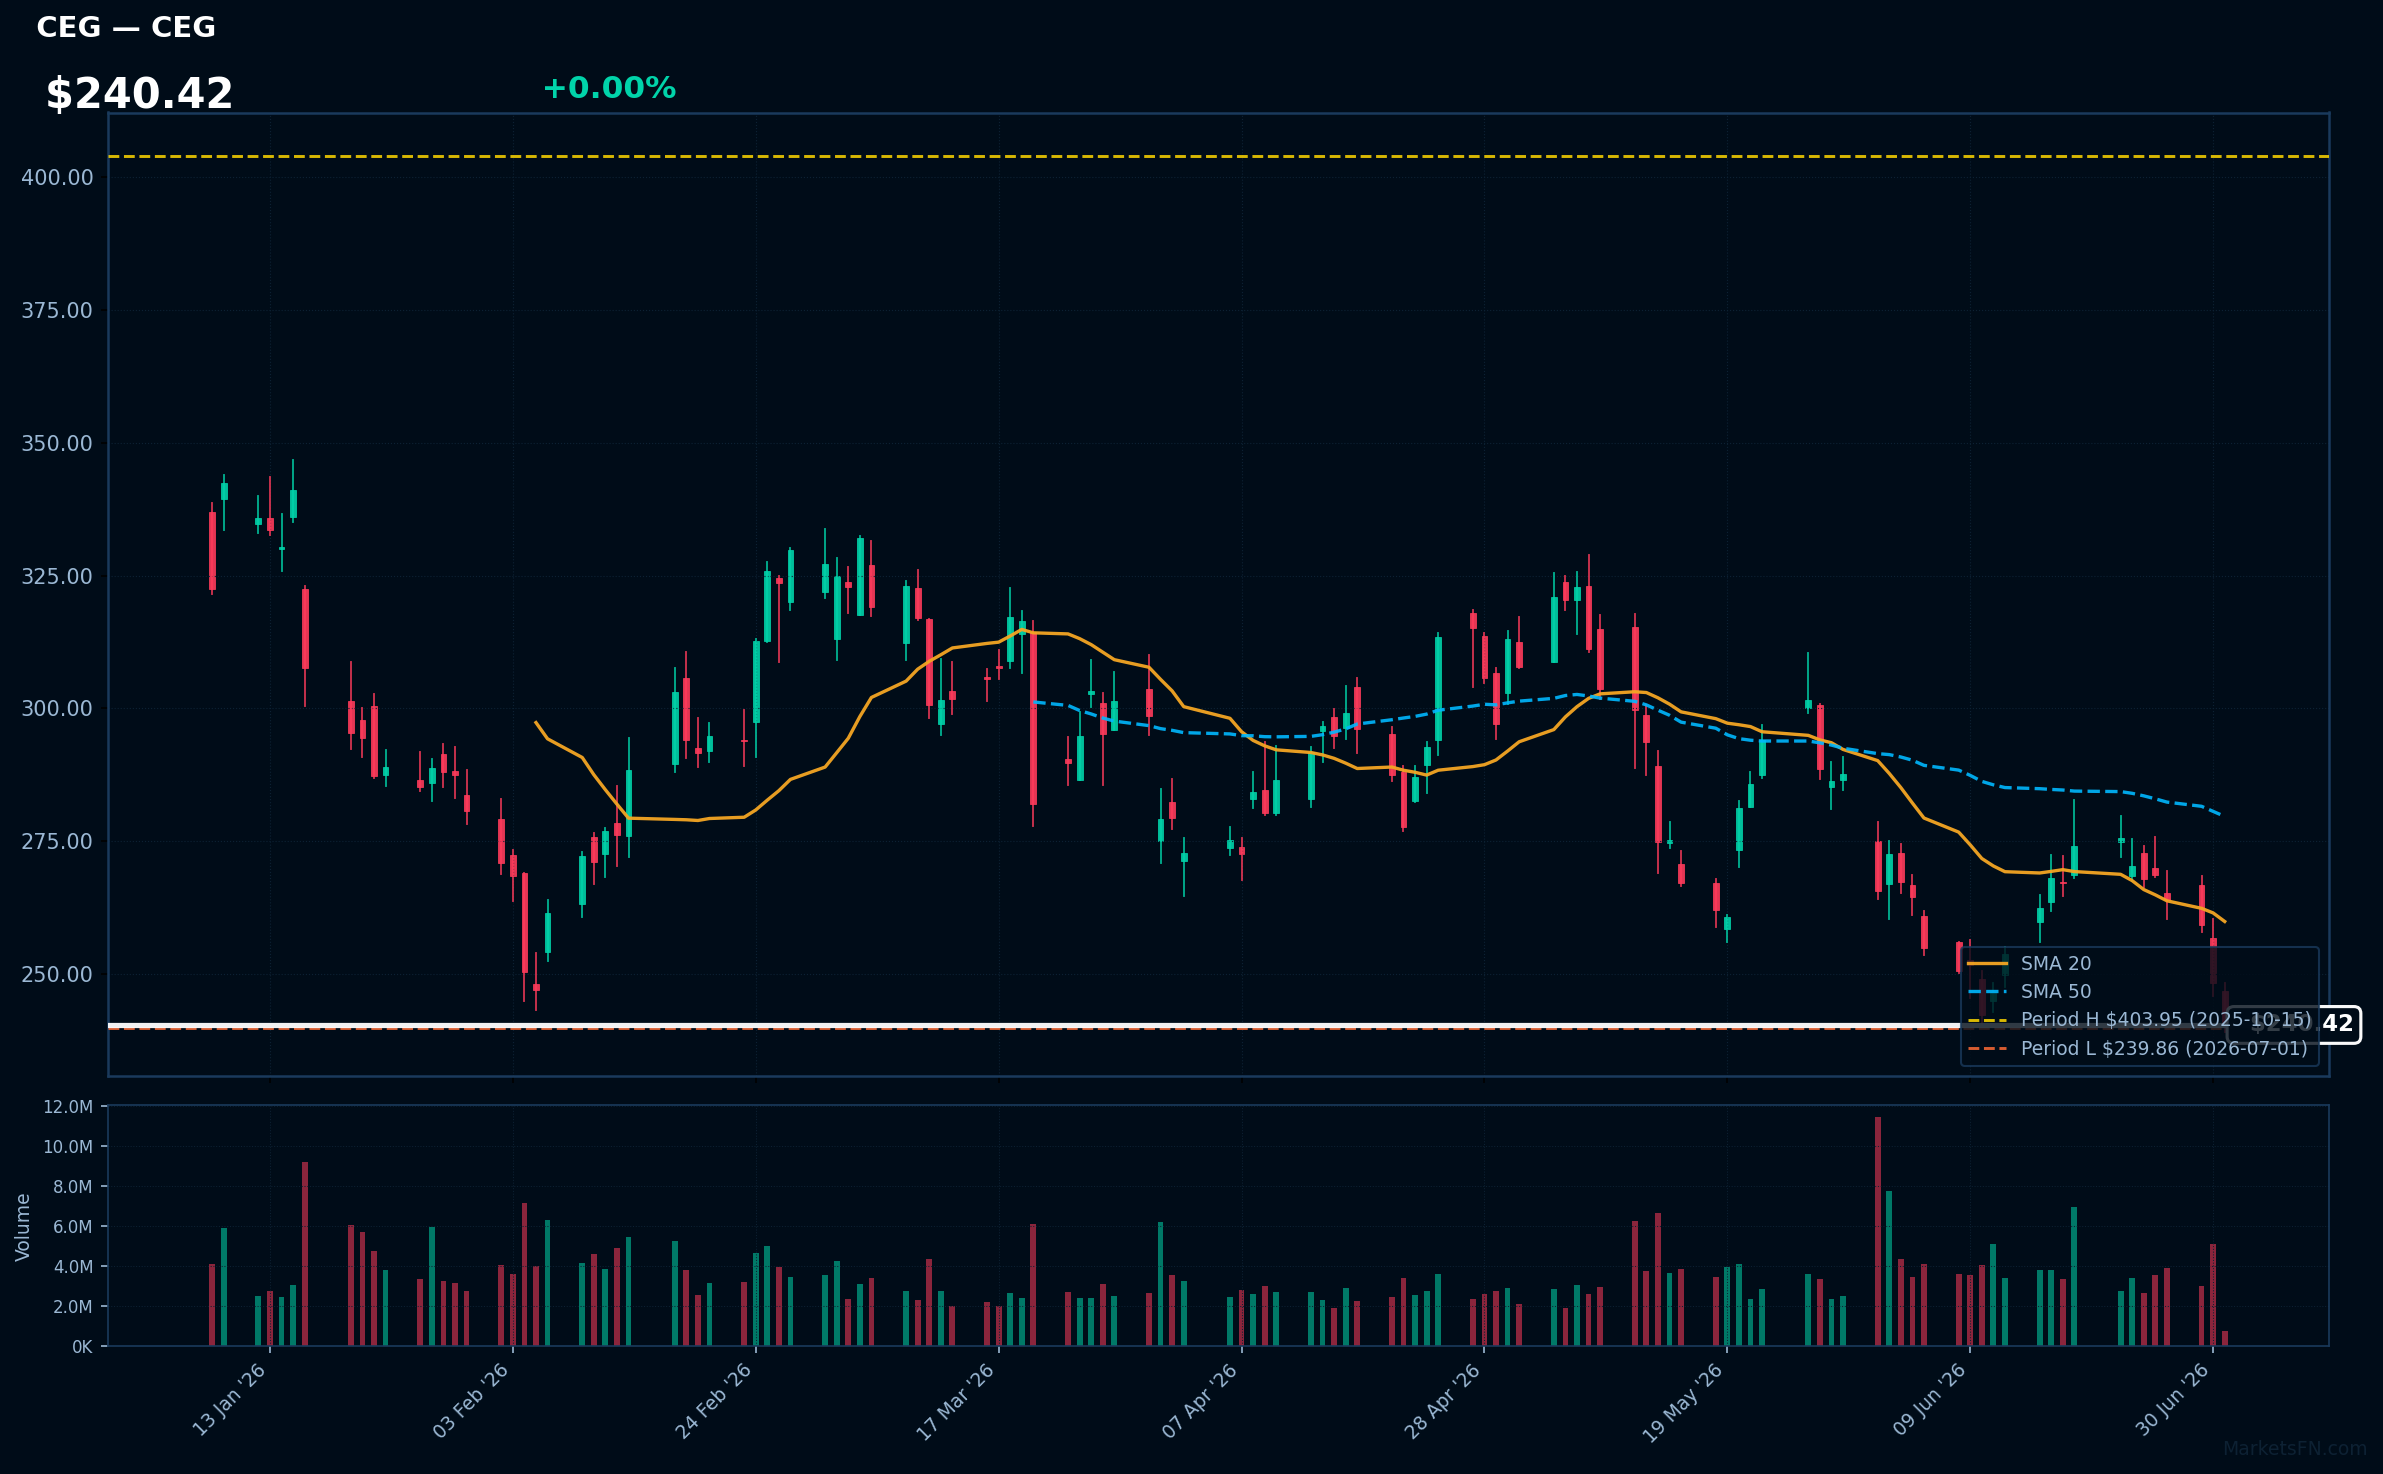
CEG | Constellation Energy Corporation | Utilities | Price Last: $239.86 | % Realized: -22.10% | RSI: 33.4 | % above MA200: -24.4% | Trend: Below MA20, MA50, MA200
Constellation Energy Corporation is a leading energy company that generates and supplies electricity and natural gas. Investors should care because its performance is tied to energy demand and market volatility, impacting its stock price and potential for returns.
Constellation Energy's technical situation is bearish, with an RSI(14) of 33.4 indicating oversold conditions and a sustained downtrend as price ($240.42) remains below MA20, MA50, and MA200, with the stock testing its 52-Week low.
Related headlines
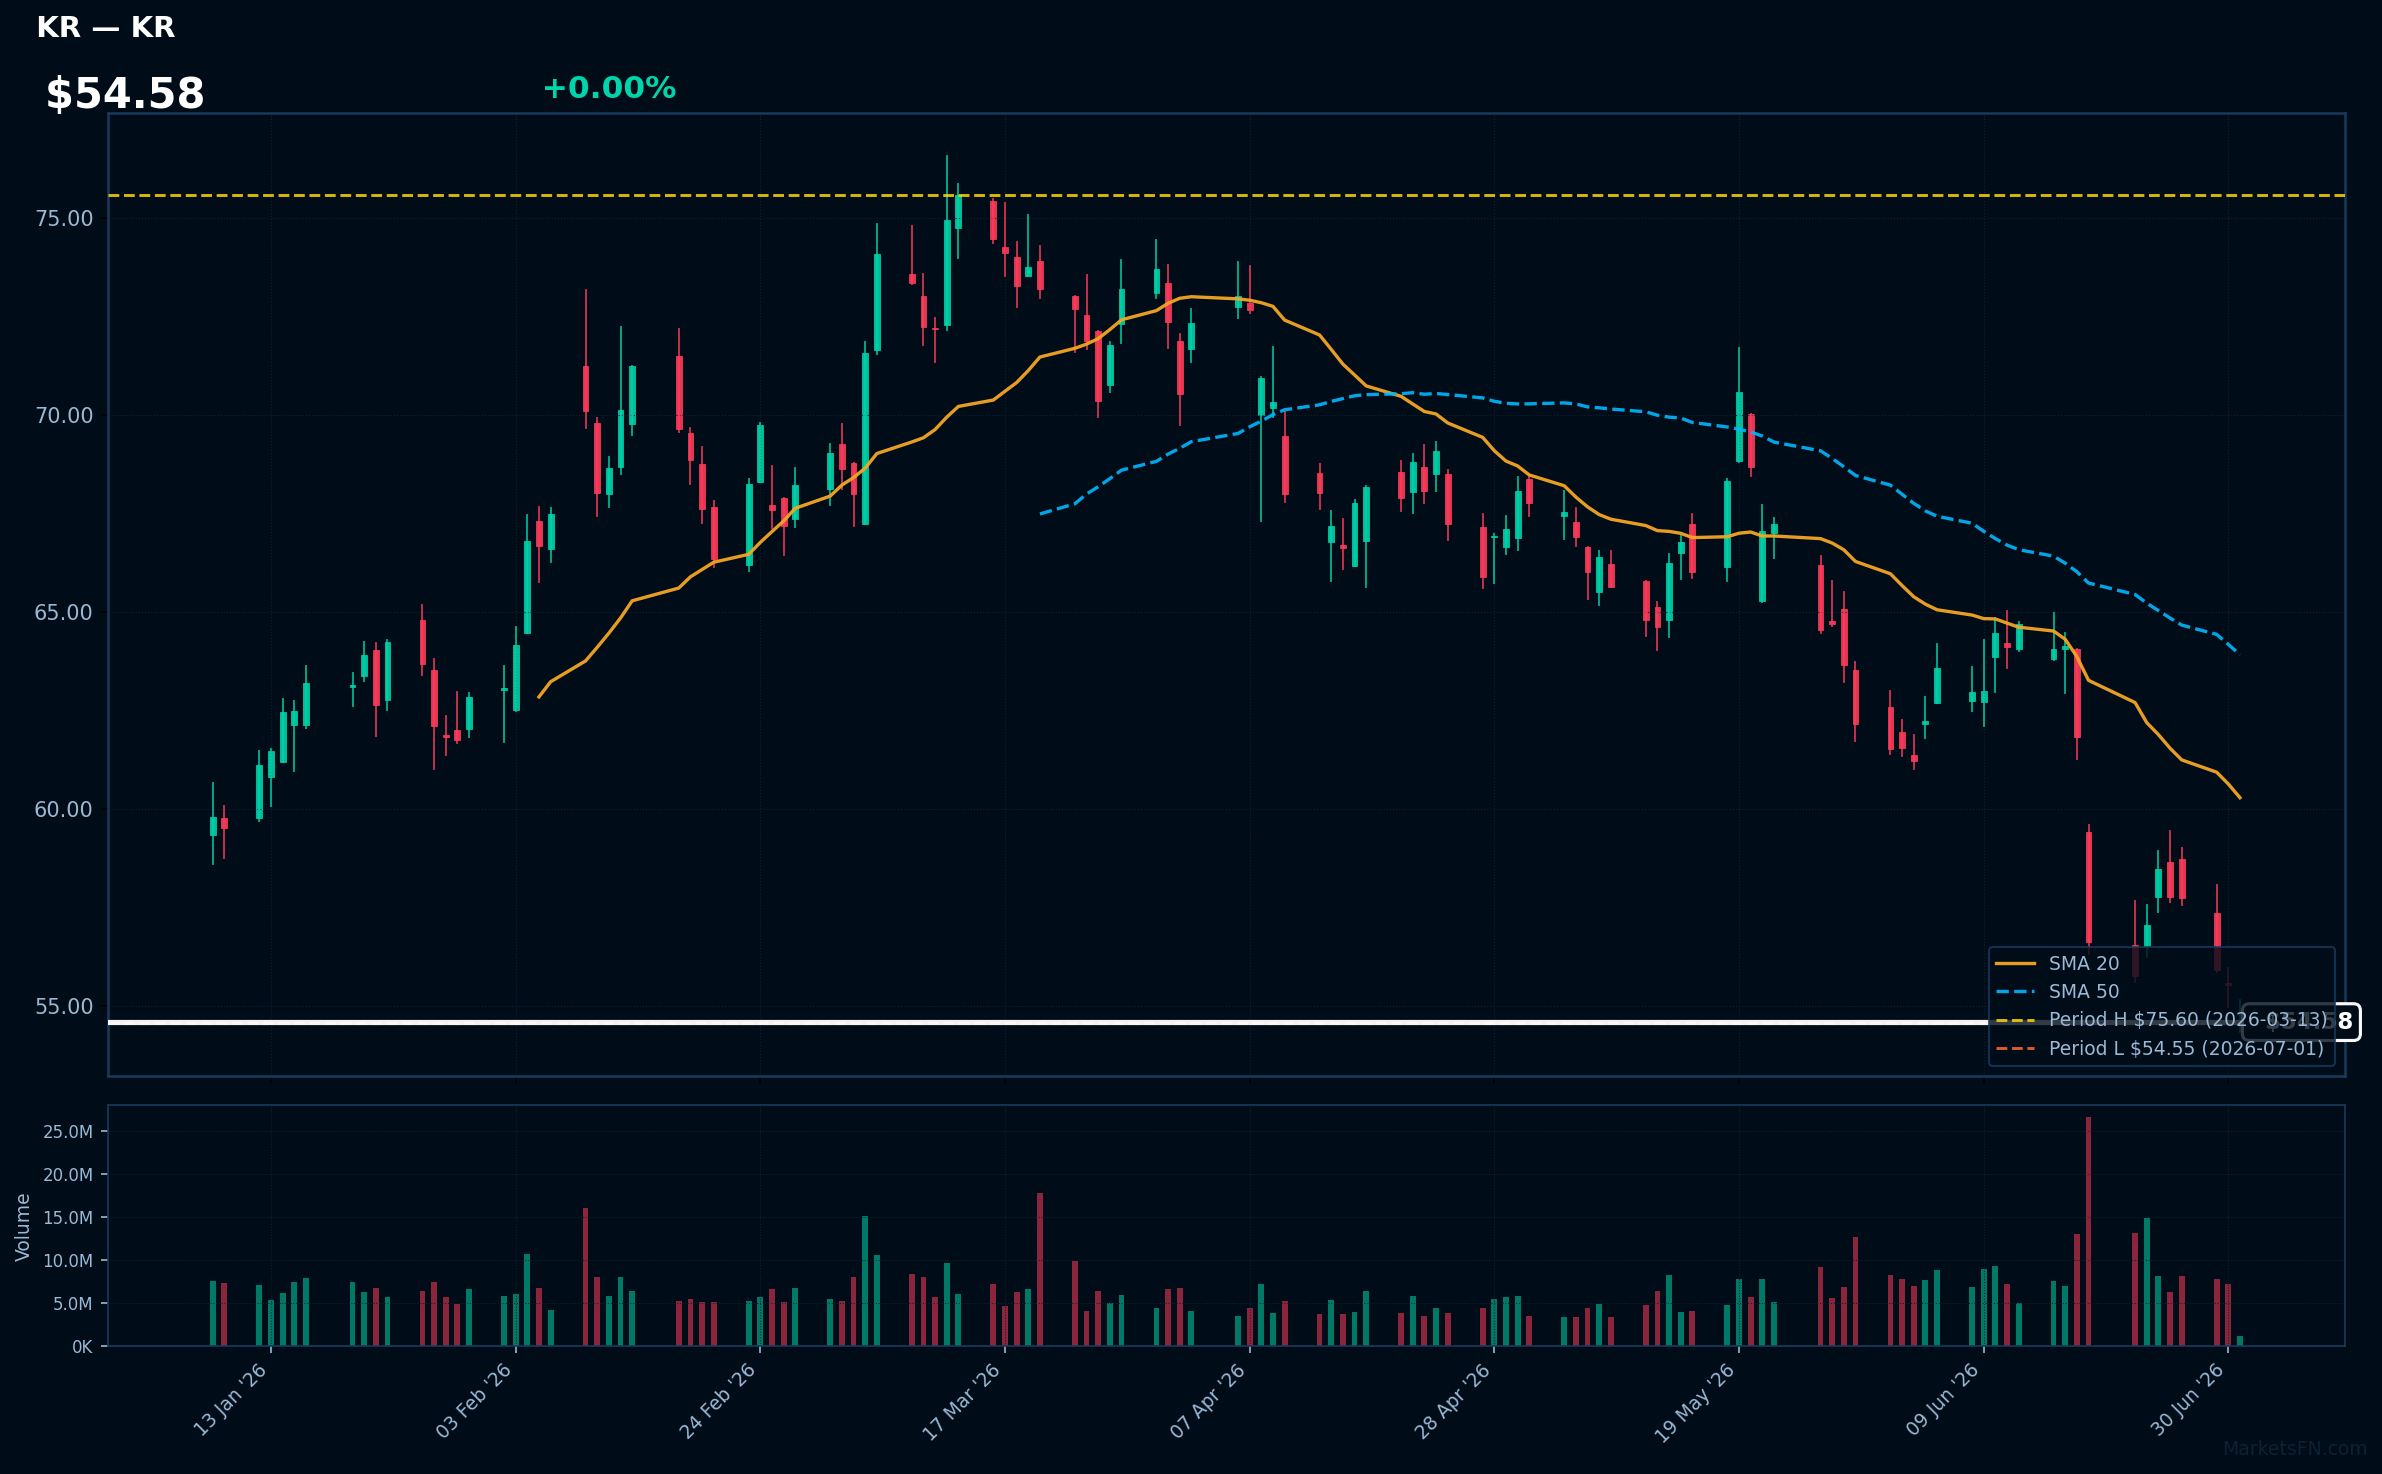
KR | Kroger Co | Consumer Defensive | Price Last: $54.55 | % Realized: -23.55% | RSI: 28.6 | % above MA200: -17.4% | Trend: Below MA20, MA50, MA200
Kroger Co operates supermarkets, offering groceries, general merchandise, and fuel. Investors should care about its performance as it indicates consumer spending trends and competitive positioning in the retail grocery market.
Kroger Co's technicals indicate a sustained downtrend with price ($54.58) below MA20, MA50, and MA200. RSI(14) at 28.6 suggests oversold conditions, and the stock is at its 52-Week low, testing major support, potentially a warning sign.
Related headlines
- Kroger to acquire Giant Eagle in $1.65 billion deal
- Kroger buying regional grocer and pharmacy retailer Giant Eagle in deal valued at $1.65 billion
- Kroger Bets On Regional Expansion With $1.65B Giant Eagle Deal CEO Sees Growth In Attractive Adjacent Markets
- Kroger to Buy Food & Pharmacy Retailer Giant Eagle for $1.65 Billion
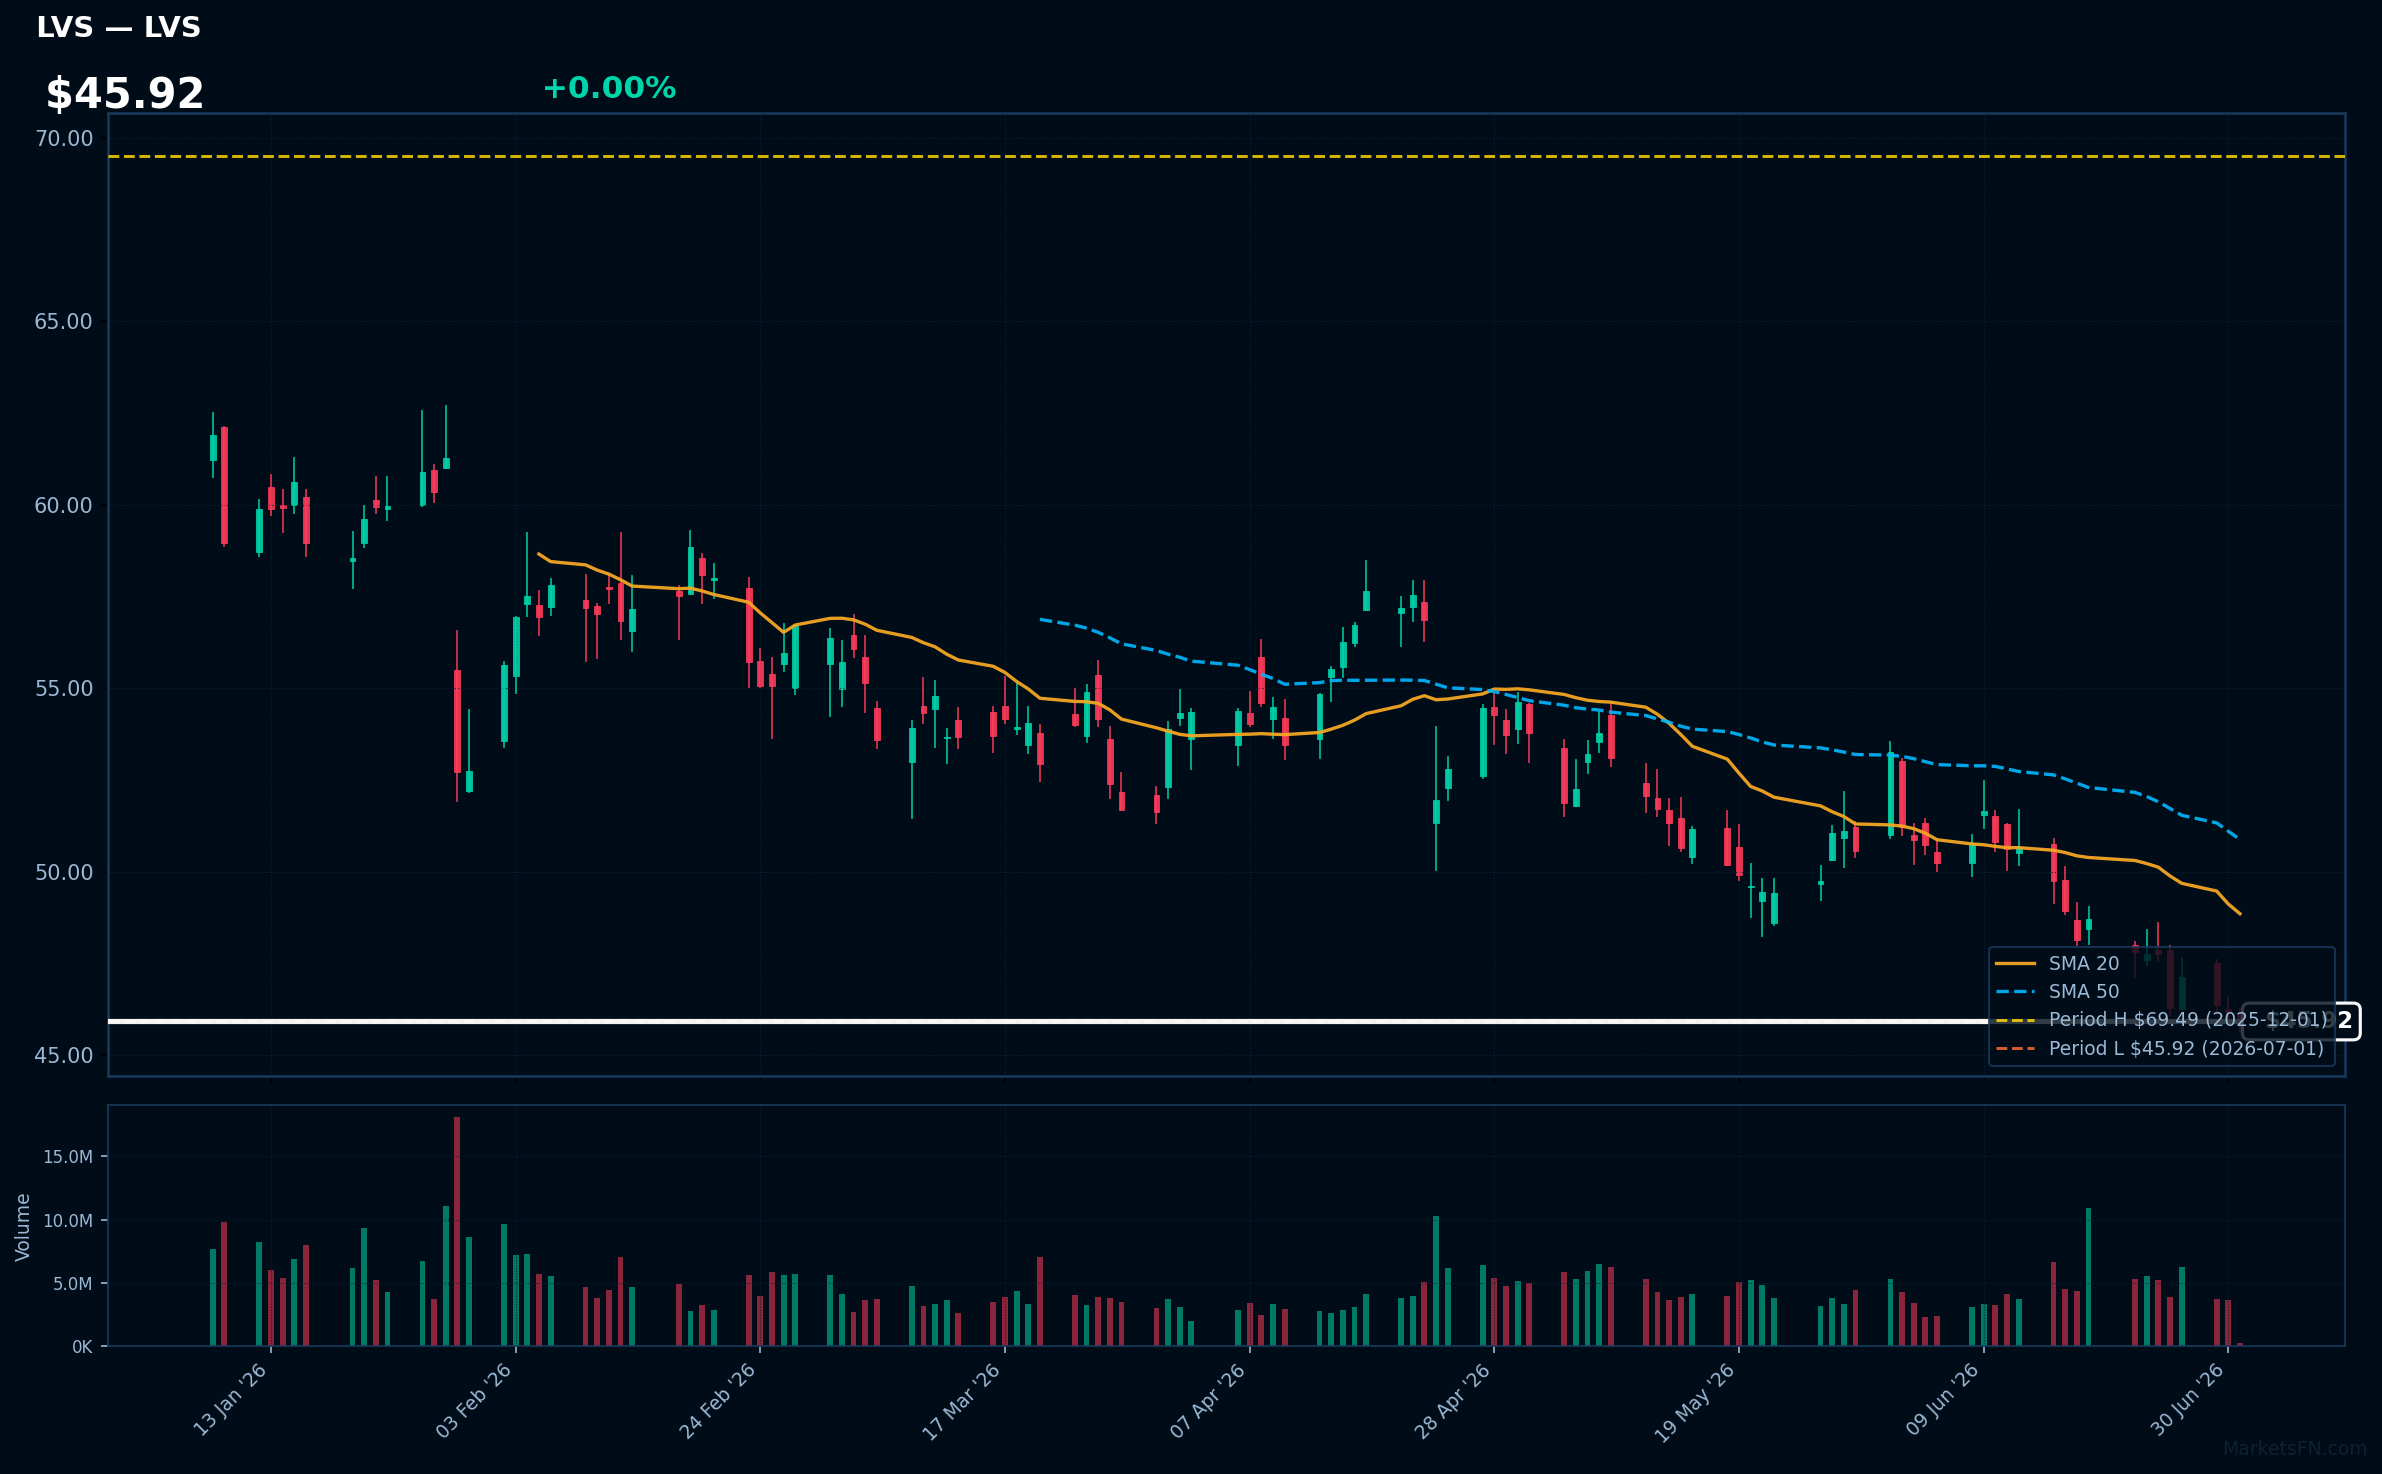
LVS | Las Vegas Sands Corp | Consumer Cyclical | Price Last: $45.92 | % Realized: -3.08% | RSI: 31.4 | % above MA200: -18.7% | Trend: Below MA20, MA50, MA200
Las Vegas Sands Corp operates integrated resorts, including casinos and entertainment venues, generating revenue primarily from gaming and hospitality services, making it sensitive to tourism and economic trends, which investors should monitor for potential impacts on the company's financial performance.
The stock is in a sustained downtrend with price ($45.92) below MA20, MA50, and MA200, and an RSI(14) of 31.4, indicating oversold conditions near its 52-Week low, potentially a warning sign as it tests major support with a 52-Week return of -3.1%.
Related headlines
- Las Vegas Sands Continues its Commitment to Ending Youth Homelessness in Nevada with a $300,000 Donation to Nevada Partnership for Homeless Youth
- Las Vegas Sands Donates $150,000 to The LGBTQ+ Center of Las Vegas for a Workforce Development Program Supporting Housing-Insecure Youth
- MGMs $18B Bid Proves Las Vegas Sands Is Undervalued
- Las Vegas Sands Continues on the Dow Jones Best-in-Class Indices for World and North America
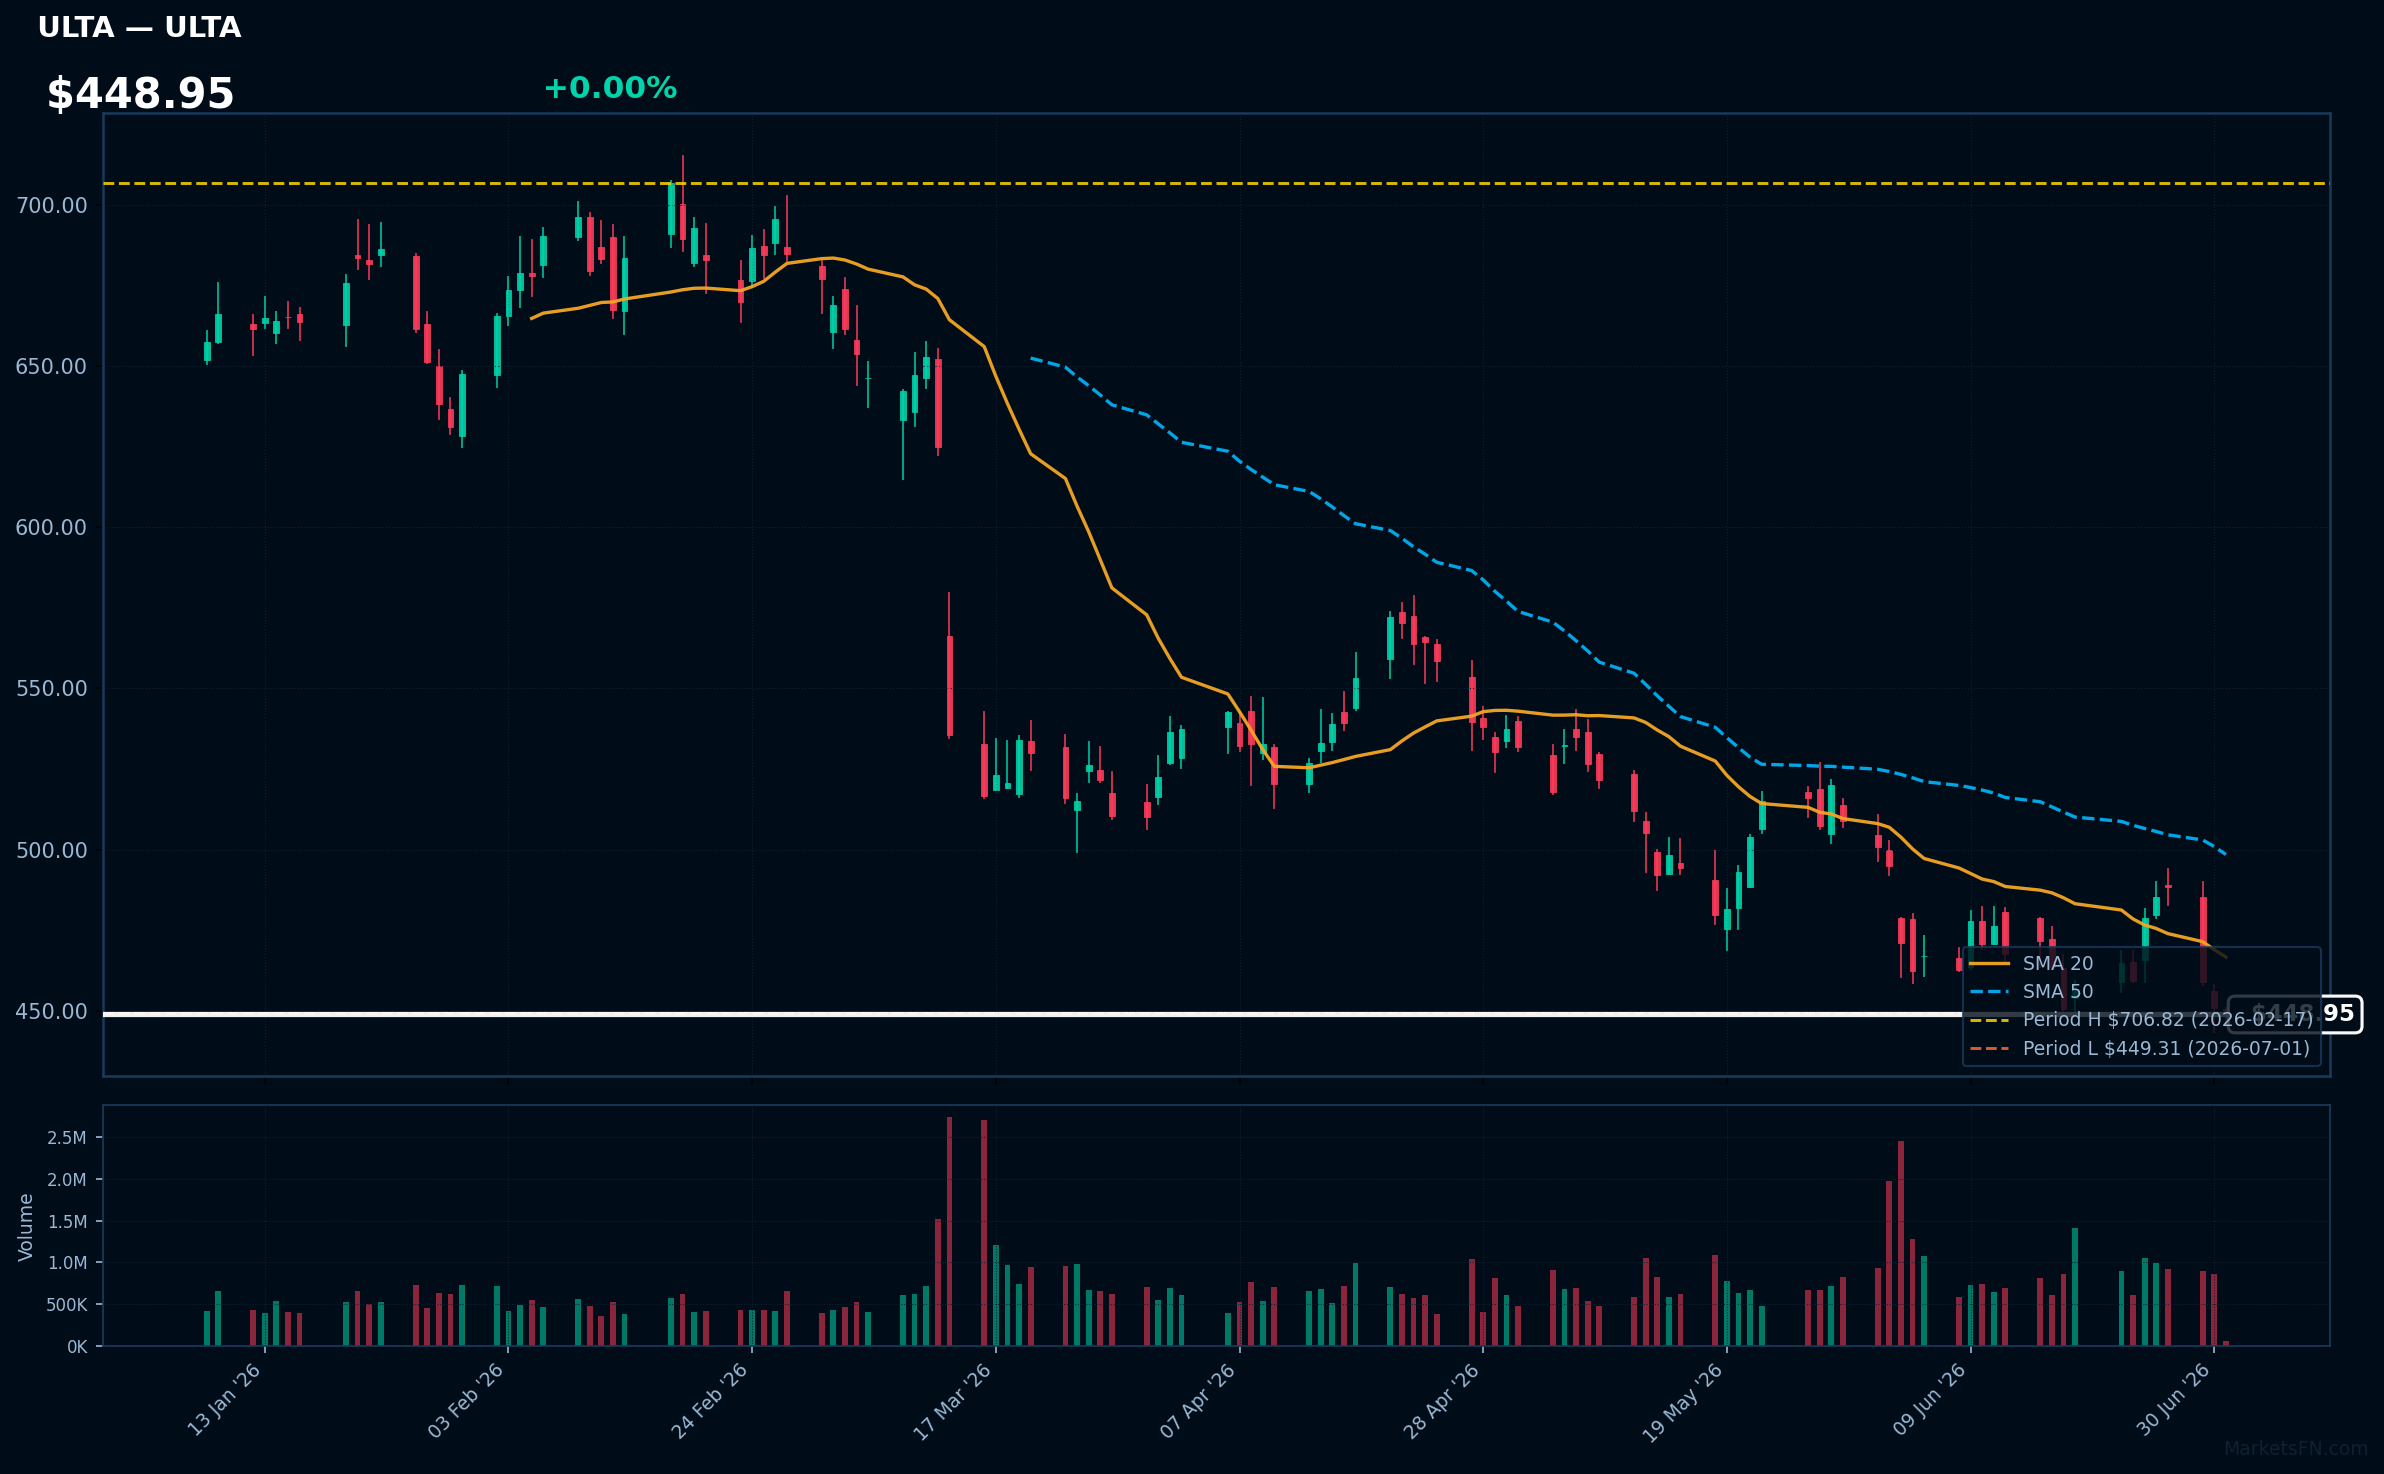
ULTA | Ulta Beauty Inc | Consumer Cyclical | Price Last: $449.31 | % Realized: -5.10% | RSI: 38.5 | % above MA200: -20.0% | Trend: Below MA20, MA50, MA200
Ulta Beauty Inc operates as a beauty retailer offering cosmetics, skincare, fragrances, and salon services through its stores and website, catering to a wide range of consumers and providing a one-stop shopping experience for beauty products and services.
Ulta Beauty Inc's current technical situation indicates a warning sign with an RSI(14) of 38.5, bearish MA alignment (price < MA20 < MA50 < MA200), and the stock testing major support at its 52-Week low, suggesting sustained downtrend.
Related headlines
- Target to replace Ulta shops in 600+ stores with its in-house Beauty Studio
- Bath & Body Works Ulta Beauty launch may expand reach, but channel shift risks remain: Jefferies
- Ulta Beauty CMO on Evolving a 47 Million-Member Loyalty Program into a Relationship Engine
- Bath & Body Works is bringing its products to 600 Ulta Beauty stores
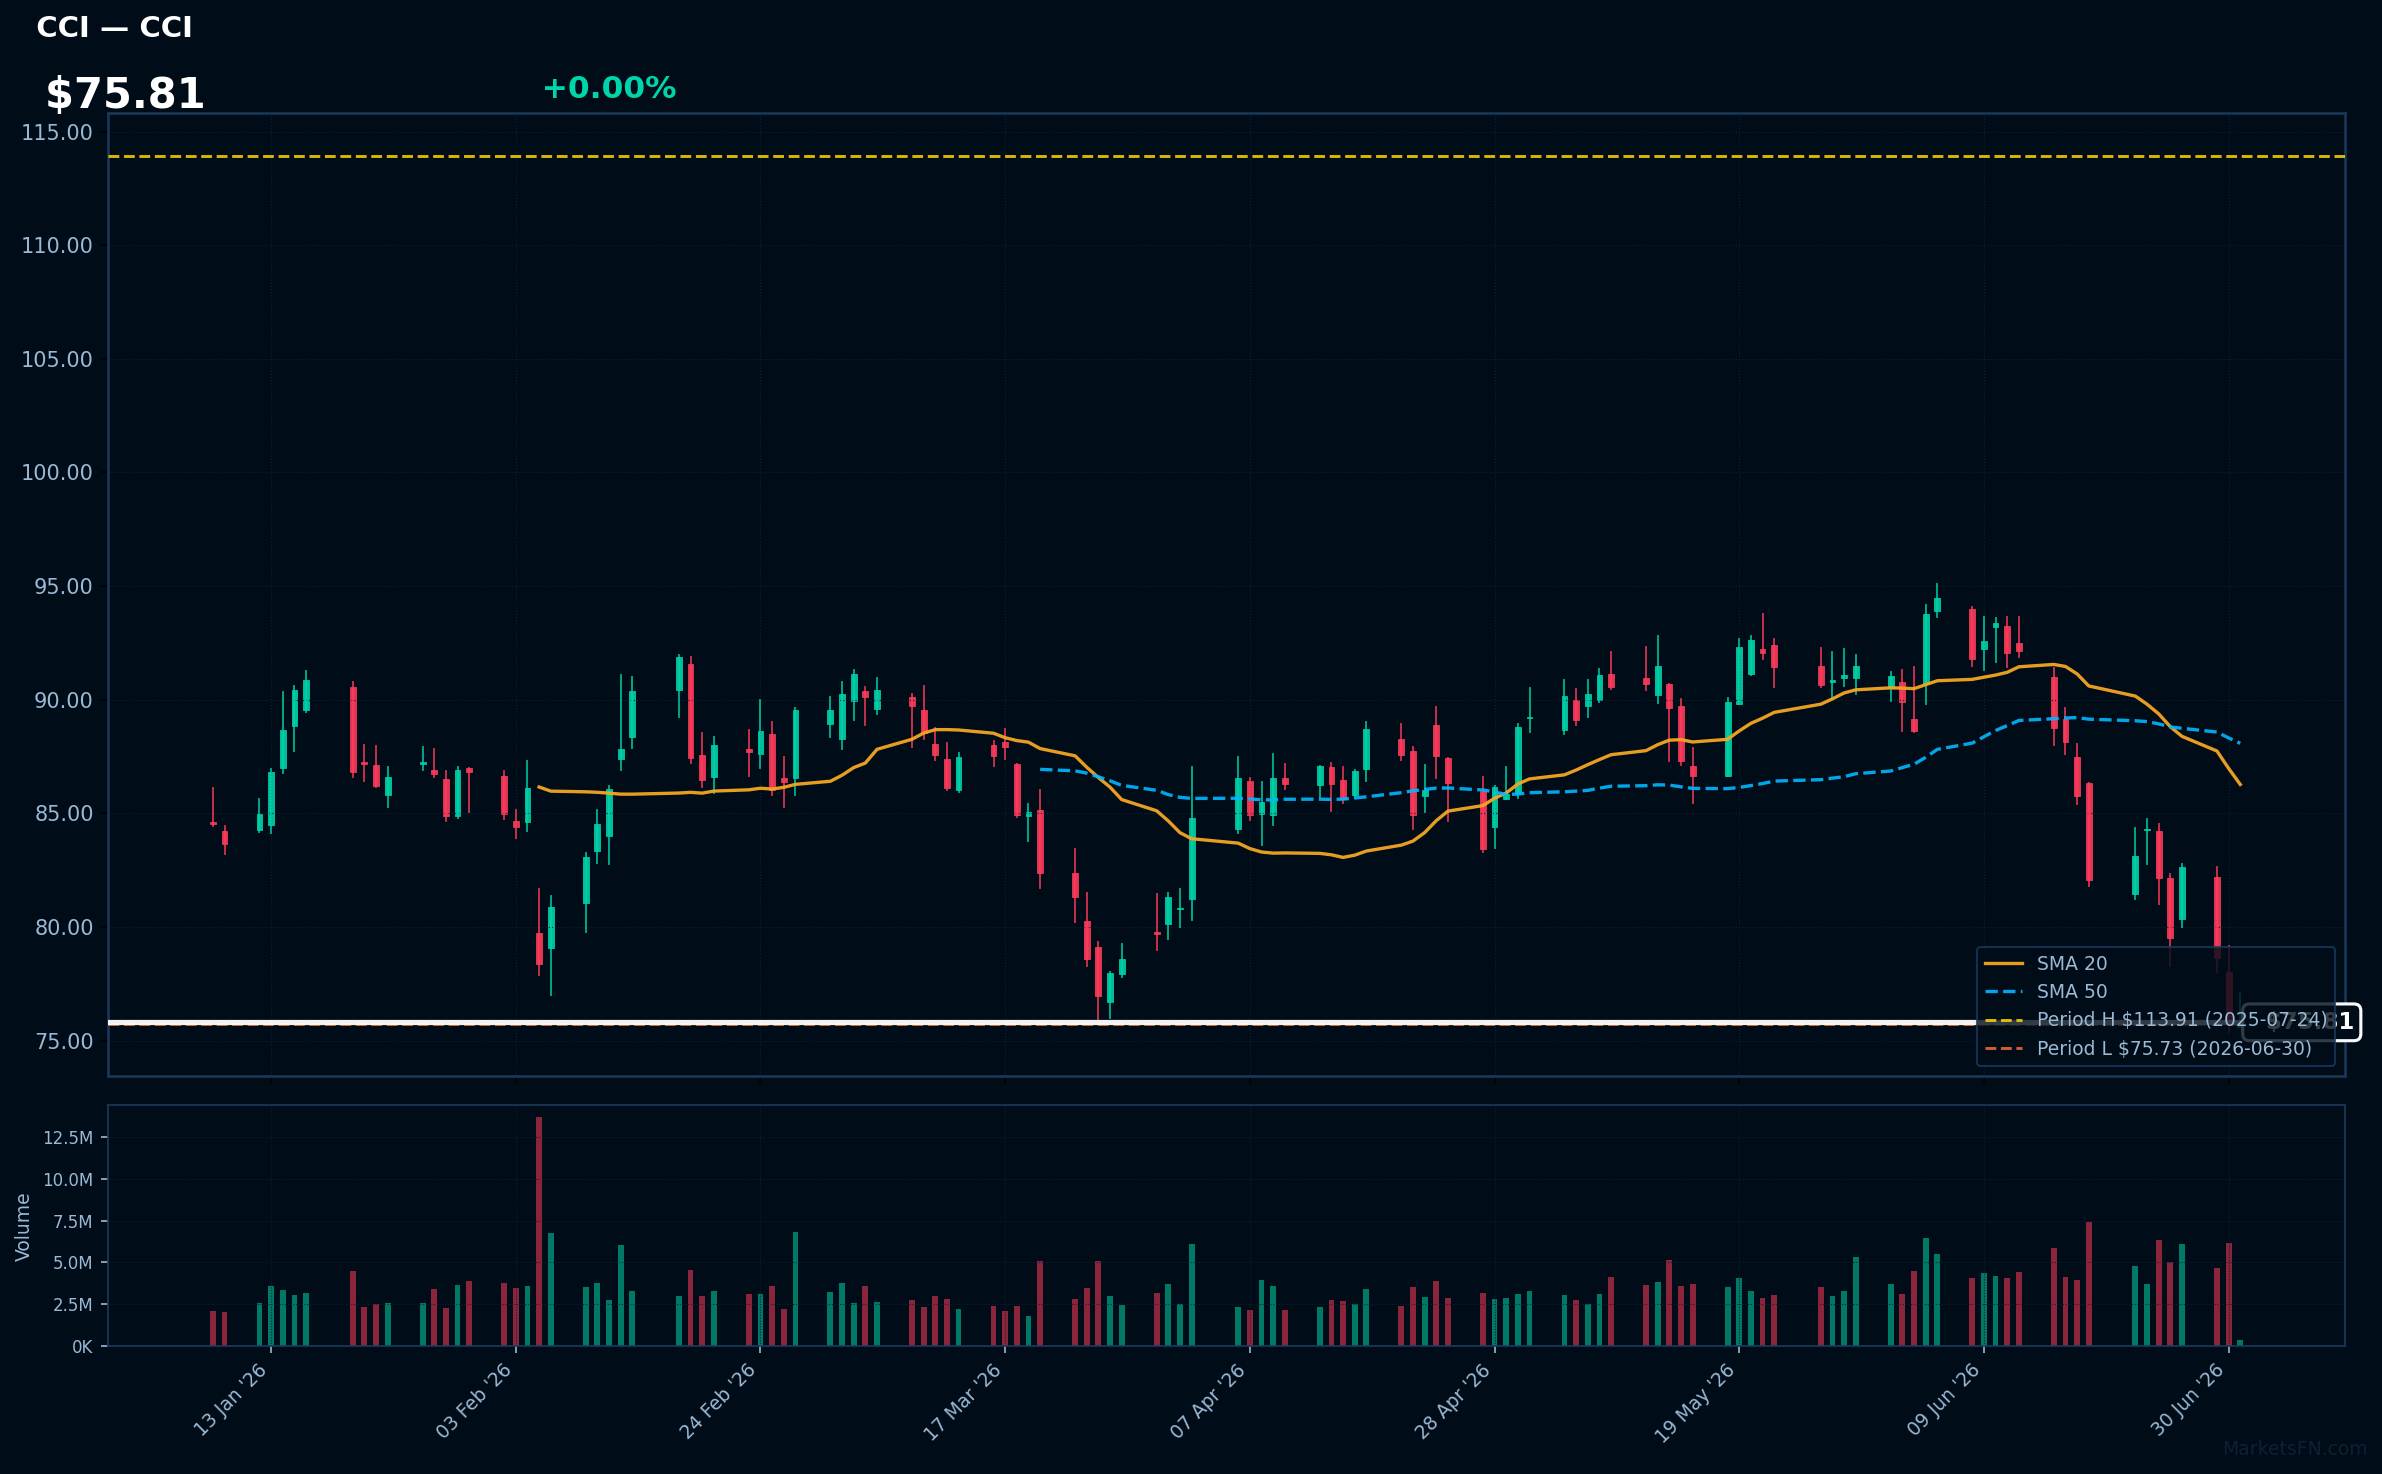
CCI | Crown Castle Inc | Real Estate | Price Last: $75.77 | % Realized: -26.95% | RSI: 30.3 | % above MA200: -14.8% | Trend: Below MA20, MA50, MA200
Crown Castle Inc (CCI) owns and operates a large portfolio of cell towers and fiber infrastructure, crucial for wireless carriers' operations. Investors care due to its steady cash flows and exposure to the growing demand for wireless data.
CCI's technicals indicate a sustained downtrend with price ($75.81) below MA20, MA50, and MA200. RSI(14) is 30.3, nearing oversold territory. The stock is 0.1% above its 52-Week low, testing major support, with a -26.9% 52-Week return, signaling potential further downside.
Related headlines
- Crown Castle Announces Second Quarter 2026 Earnings Conference Call Details
- Crown Castle Inc. stock outperforms competitors on strong trading day
- Crown Castle Names Kris Hinson as Chief Commercial Officer and Mark Lennon as Chief Information Officer
- Crown Castle Declares Quarterly Common Stock Dividend
Market Commentary
The S&P 500 stocks listed near 52-week extremes indicate a significant price movement, with some reaching new highs and others hitting lows. The stocks at 52-week highs include GE Aerospace (GE), Palo Alto Networks Inc (PANW), Welltower Inc (WELL), Chubb Limited (CB), and Vertex Pharmaceuticals, Inc (VRTX), all at their peak price. Conversely, CEG (Constellation Energy Corporation), KR (Kroger Co), LVS (Las Vegas Sands Corp), ULTA (Ulta Beauty Inc), and CCI (Crown Castle Inc) are near their 52-week lows.
The stocks near 52-week highs are from diverse sectors, including industrials (GE), technology (PANW, VRTX), real estate (WELL), and finance (CB), potentially indicating broad market strength. In contrast, the stocks near 52-week lows are from consumer staples (KR), consumer discretionary (LVS, ULTA), and communications (CCI), possibly signaling sector rotation or specific company challenges.
Key levels to watch include the current prices of these stocks, as they are either at their 52-week highs or just above their lows. Potential catalysts could include earnings reports, macroeconomic data releases, or industry-specific news that may further influence these stocks' prices and overall market direction.
Methodology: All 503 S&P 500 constituents screened. 52-week high = highest daily close over the past 252 trading days (approx. 1 year). 52-week low = lowest daily close over the same period. Distance = (current price / extreme − 1) × 100. Technical indicators computed on up to 1 year of daily OHLCV data.
Disclaimer: For informational purposes only. Not investment advice. Past performance is not indicative of future results.