S&P 500 Bull & Bear Radar — July 01, 2026
· Stocks · QuoteReporter
S&P 500 Bull & Bear Radar — July 01, 2026
A daily technical sweep of 496 S&P 500 constituents ranked by session performance, enriched with RSI, MA20/MA50/MA200 trend signals, Bloomberg-style charts, and recent news.
Index-Wide Breadth
| Constituents tracked | 496 |
| Advancing | 333 (67.1%) |
| Declining | 160 (32.3%) |
| Average daily change | +0.64% |
| Above MA200 | 11 (2.2%) |
Top 10 Gainers
Today's strongest S&P 500 performers. Sector leadership: Consumer Defensive (3), Technology (2), Communication Services (2), Financial (2), Industrials (1).
| Ticker | Company | Sector | Price | Day % | 1W % | 1M % | RSI | vs MA200 | Trend |
|---|---|---|---|---|---|---|---|---|---|
| CRWD | Crowdstrike Holdings Inc | Technology | $777.02 | +10.83% | +15.28% | +16.04% | 71.8 | +56.1% | Above MA20, MA50, MA200 |
| META | Meta Platforms Inc | Communication Services | $613.75 | +8.96% | +10.01% | +2.17% | 58.6 | -5.2% | Above MA20, MA50 · Below MA200 |
| GIS | General Mills, Inc | Consumer Defensive | $37.83 | +8.72% | +8.71% | +12.49% | 67.8 | -10.7% | Above MA20, MA50 · Below MA200 |
| PLTR | Palantir Technologies Inc | Technology | $124.85 | +7.01% | +10.05% | -22.25% | 47.6 | -21.0% | Below MA20, MA50, MA200 |
| COIN | Coinbase Global Inc | Financial | $156.13 | +6.80% | +4.13% | -14.40% | 45.2 | -32.6% | Below MA20, MA50, MA200 |
| CAG | Conagra Brands Inc | Consumer Defensive | $14.32 | +6.43% | +5.29% | +9.31% | 59.9 | -13.6% | Above MA20, MA50 · Below MA200 |
| AXON | Axon Enterprise Inc | Industrials | $593.24 | +5.82% | +29.81% | +24.32% | 76.5 | +11.0% | Above MA20, MA50, MA200 |
| CPB | Campbells Co | Consumer Defensive | $23.55 | +5.75% | +5.94% | +11.76% | 63.9 | -9.7% | Above MA20, MA50 · Below MA200 |
| TTD | Trade Desk Inc | Communication Services | $19.05 | +5.37% | +7.79% | -17.83% | 47.5 | -41.3% | Above MA20 · Below MA50, MA200 |
| FDS | Factset Research Systems Inc | Financial | $241.74 | +5.07% | +11.75% | -10.69% | 56.1 | -3.9% | Above MA20, MA50 · Below MA200 |
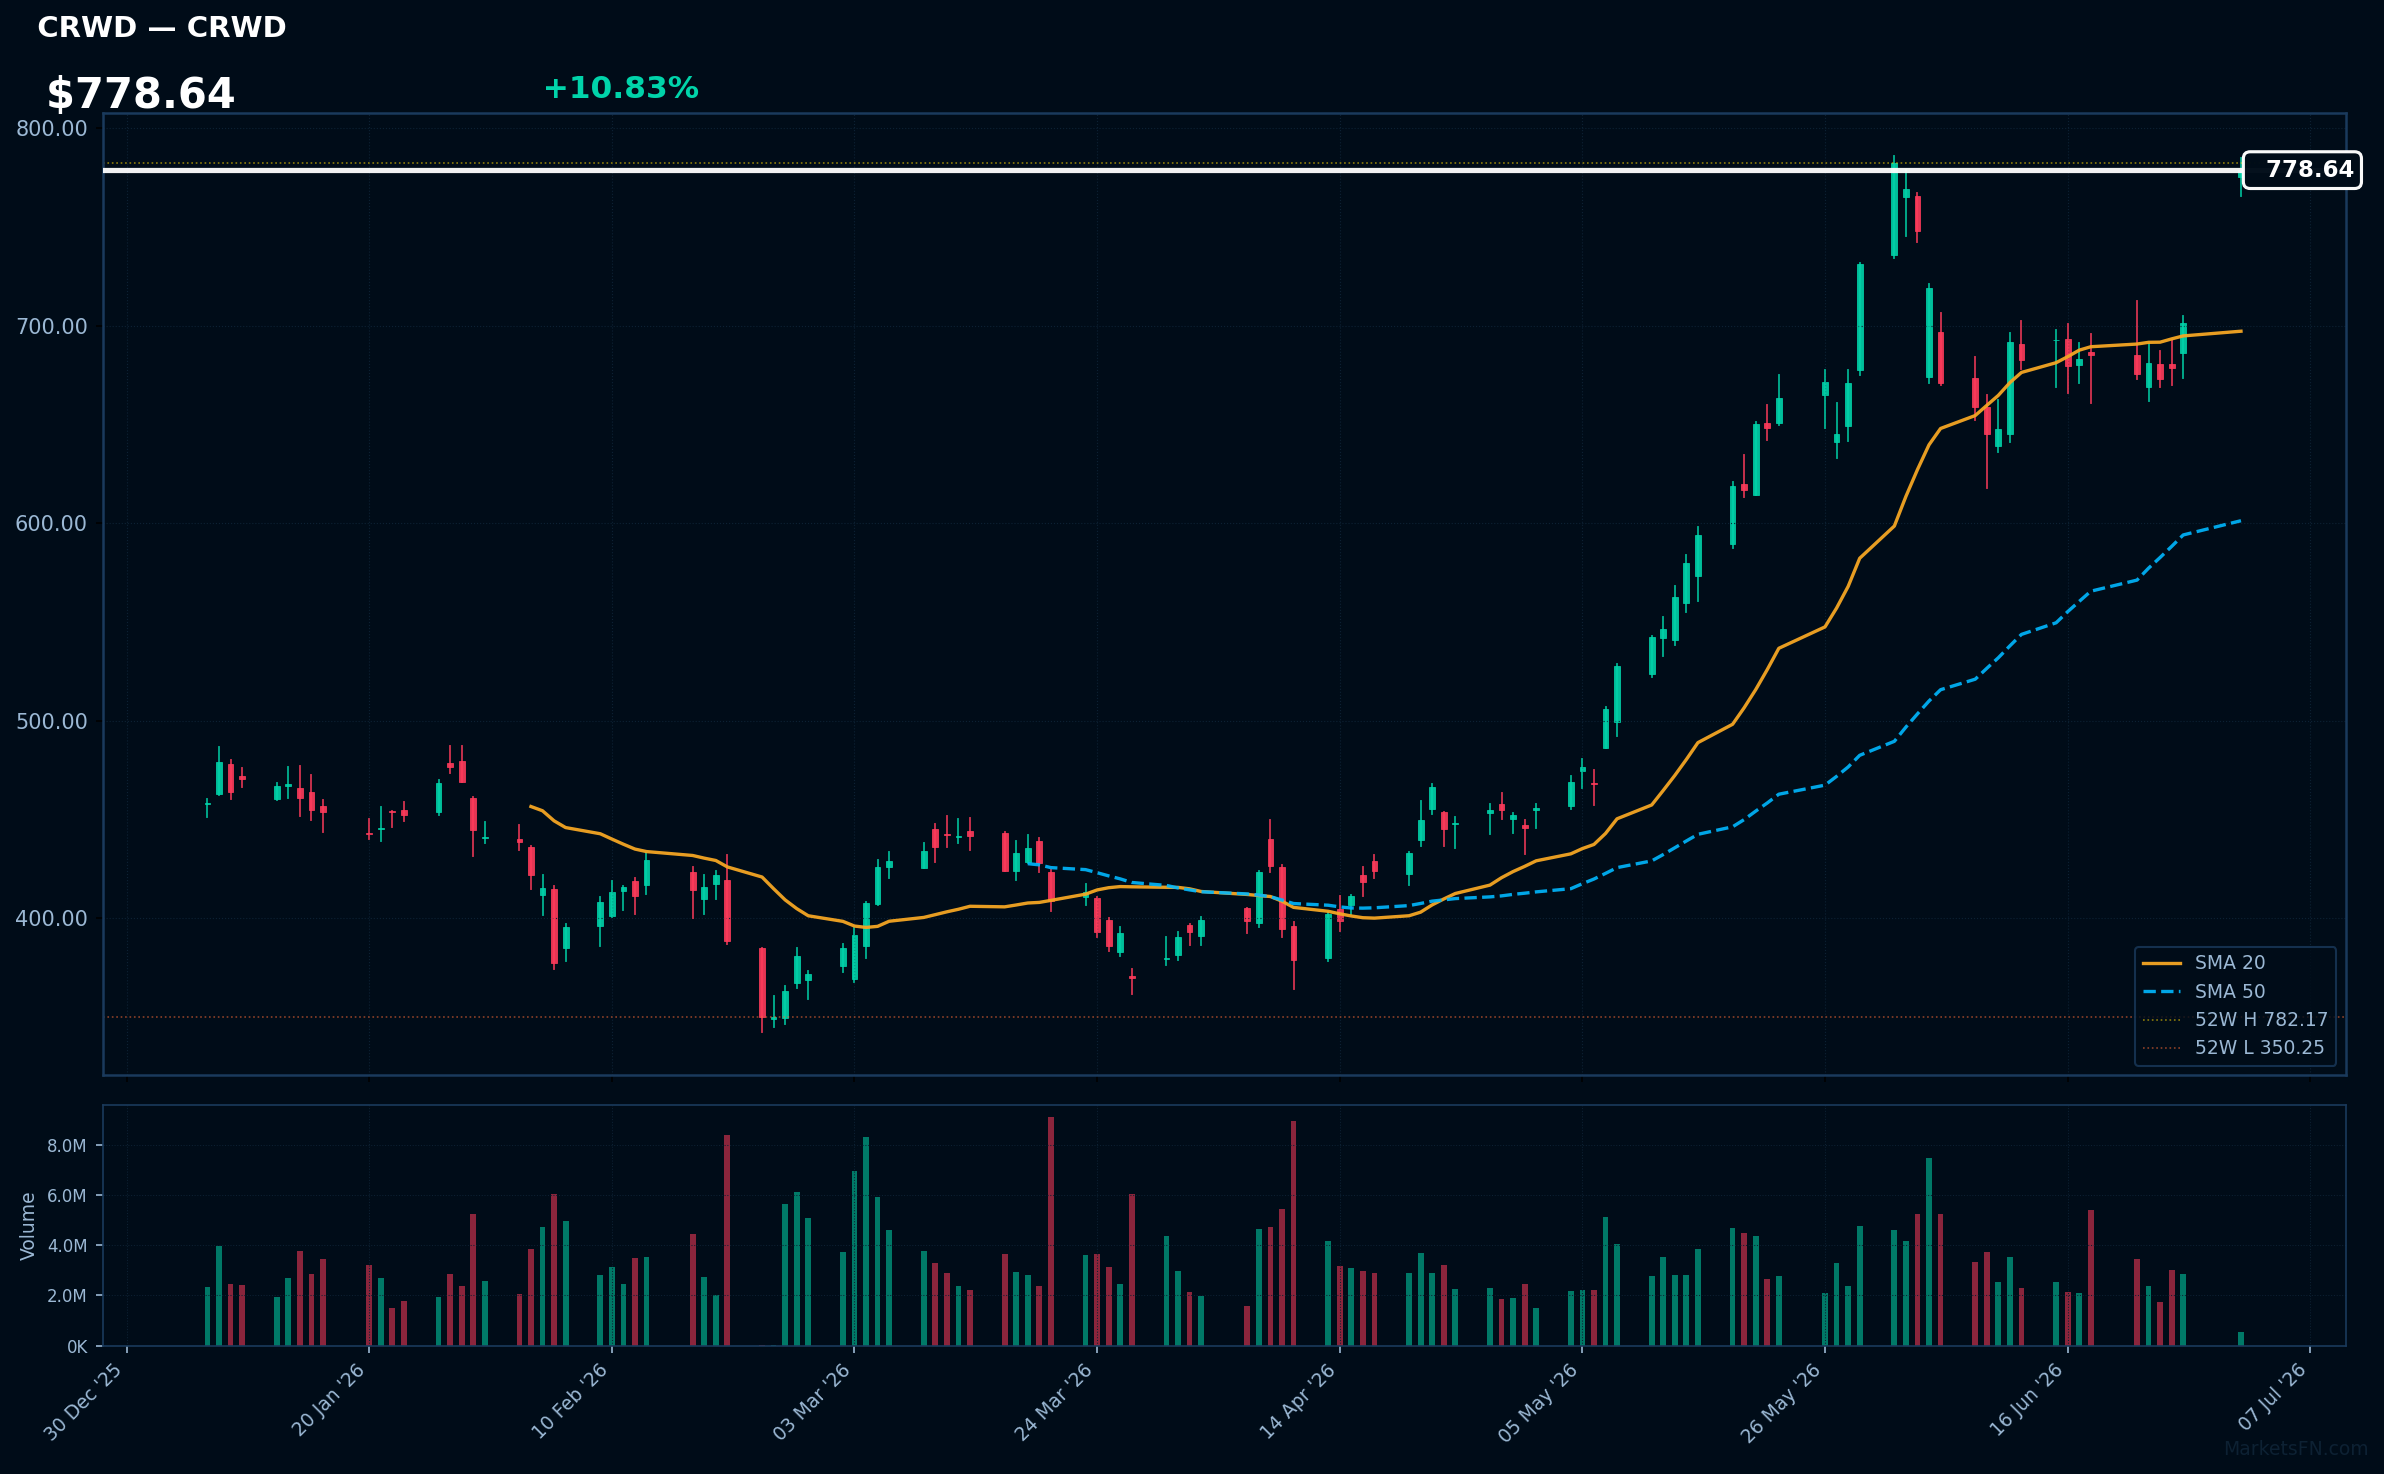
CRWD | Crowdstrike Holdings Inc | Technology | Price: $777.02 | Day: +10.83% | 1W: +15.28% | 1M: +16.04% | RSI: 71.8 | vs MA200: +56.1% | Trend: Above MA20, MA50, MA200
Recent headlines (last 12h)
- Data Shows Why This Software ETF is Poised to Rally
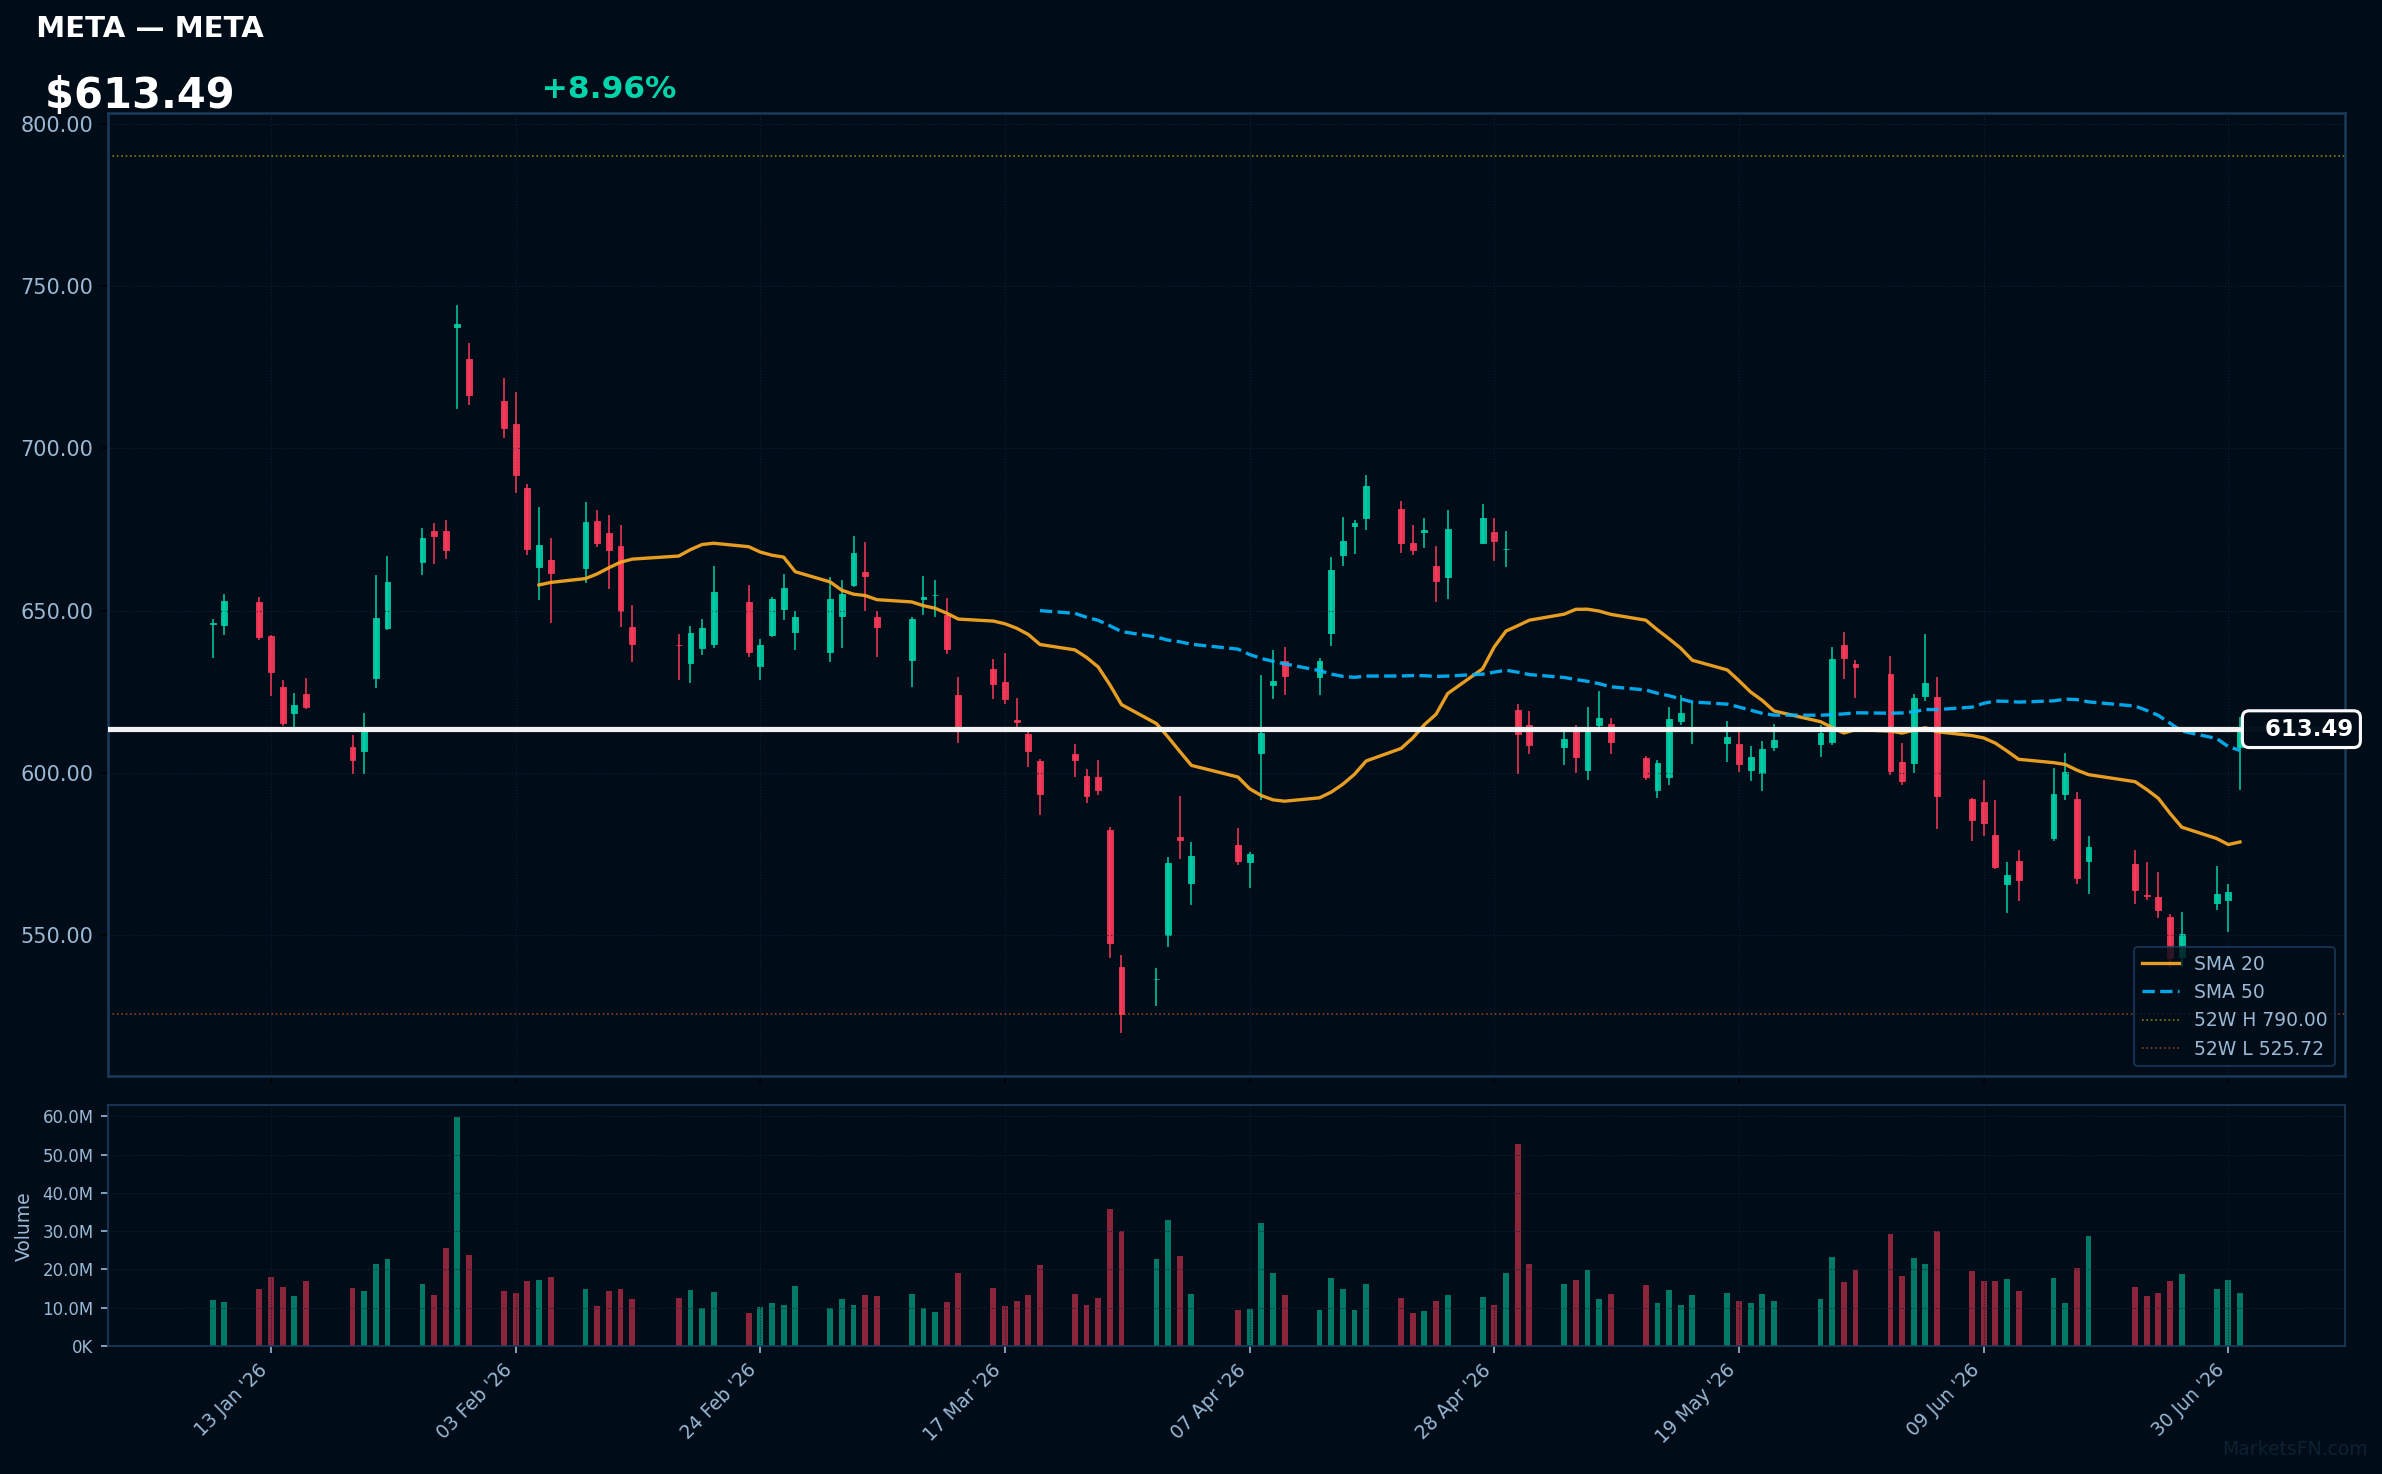
META | Meta Platforms Inc | Communication Services | Price: $613.75 | Day: +8.96% | 1W: +10.01% | 1M: +2.17% | RSI: 58.6 | vs MA200: -5.2% | Trend: Above MA20, MA50 · Below MA200
Recent headlines (last 12h)
- Meta stock pops on news it will reportedly start a cloud computing business
- Scared of an AI stock bubble? Then don't look at this chart.
- Meta shares jump on plans to commercialise excess AI computing capacity
- Meta turns its AI spending spree into a business of its own
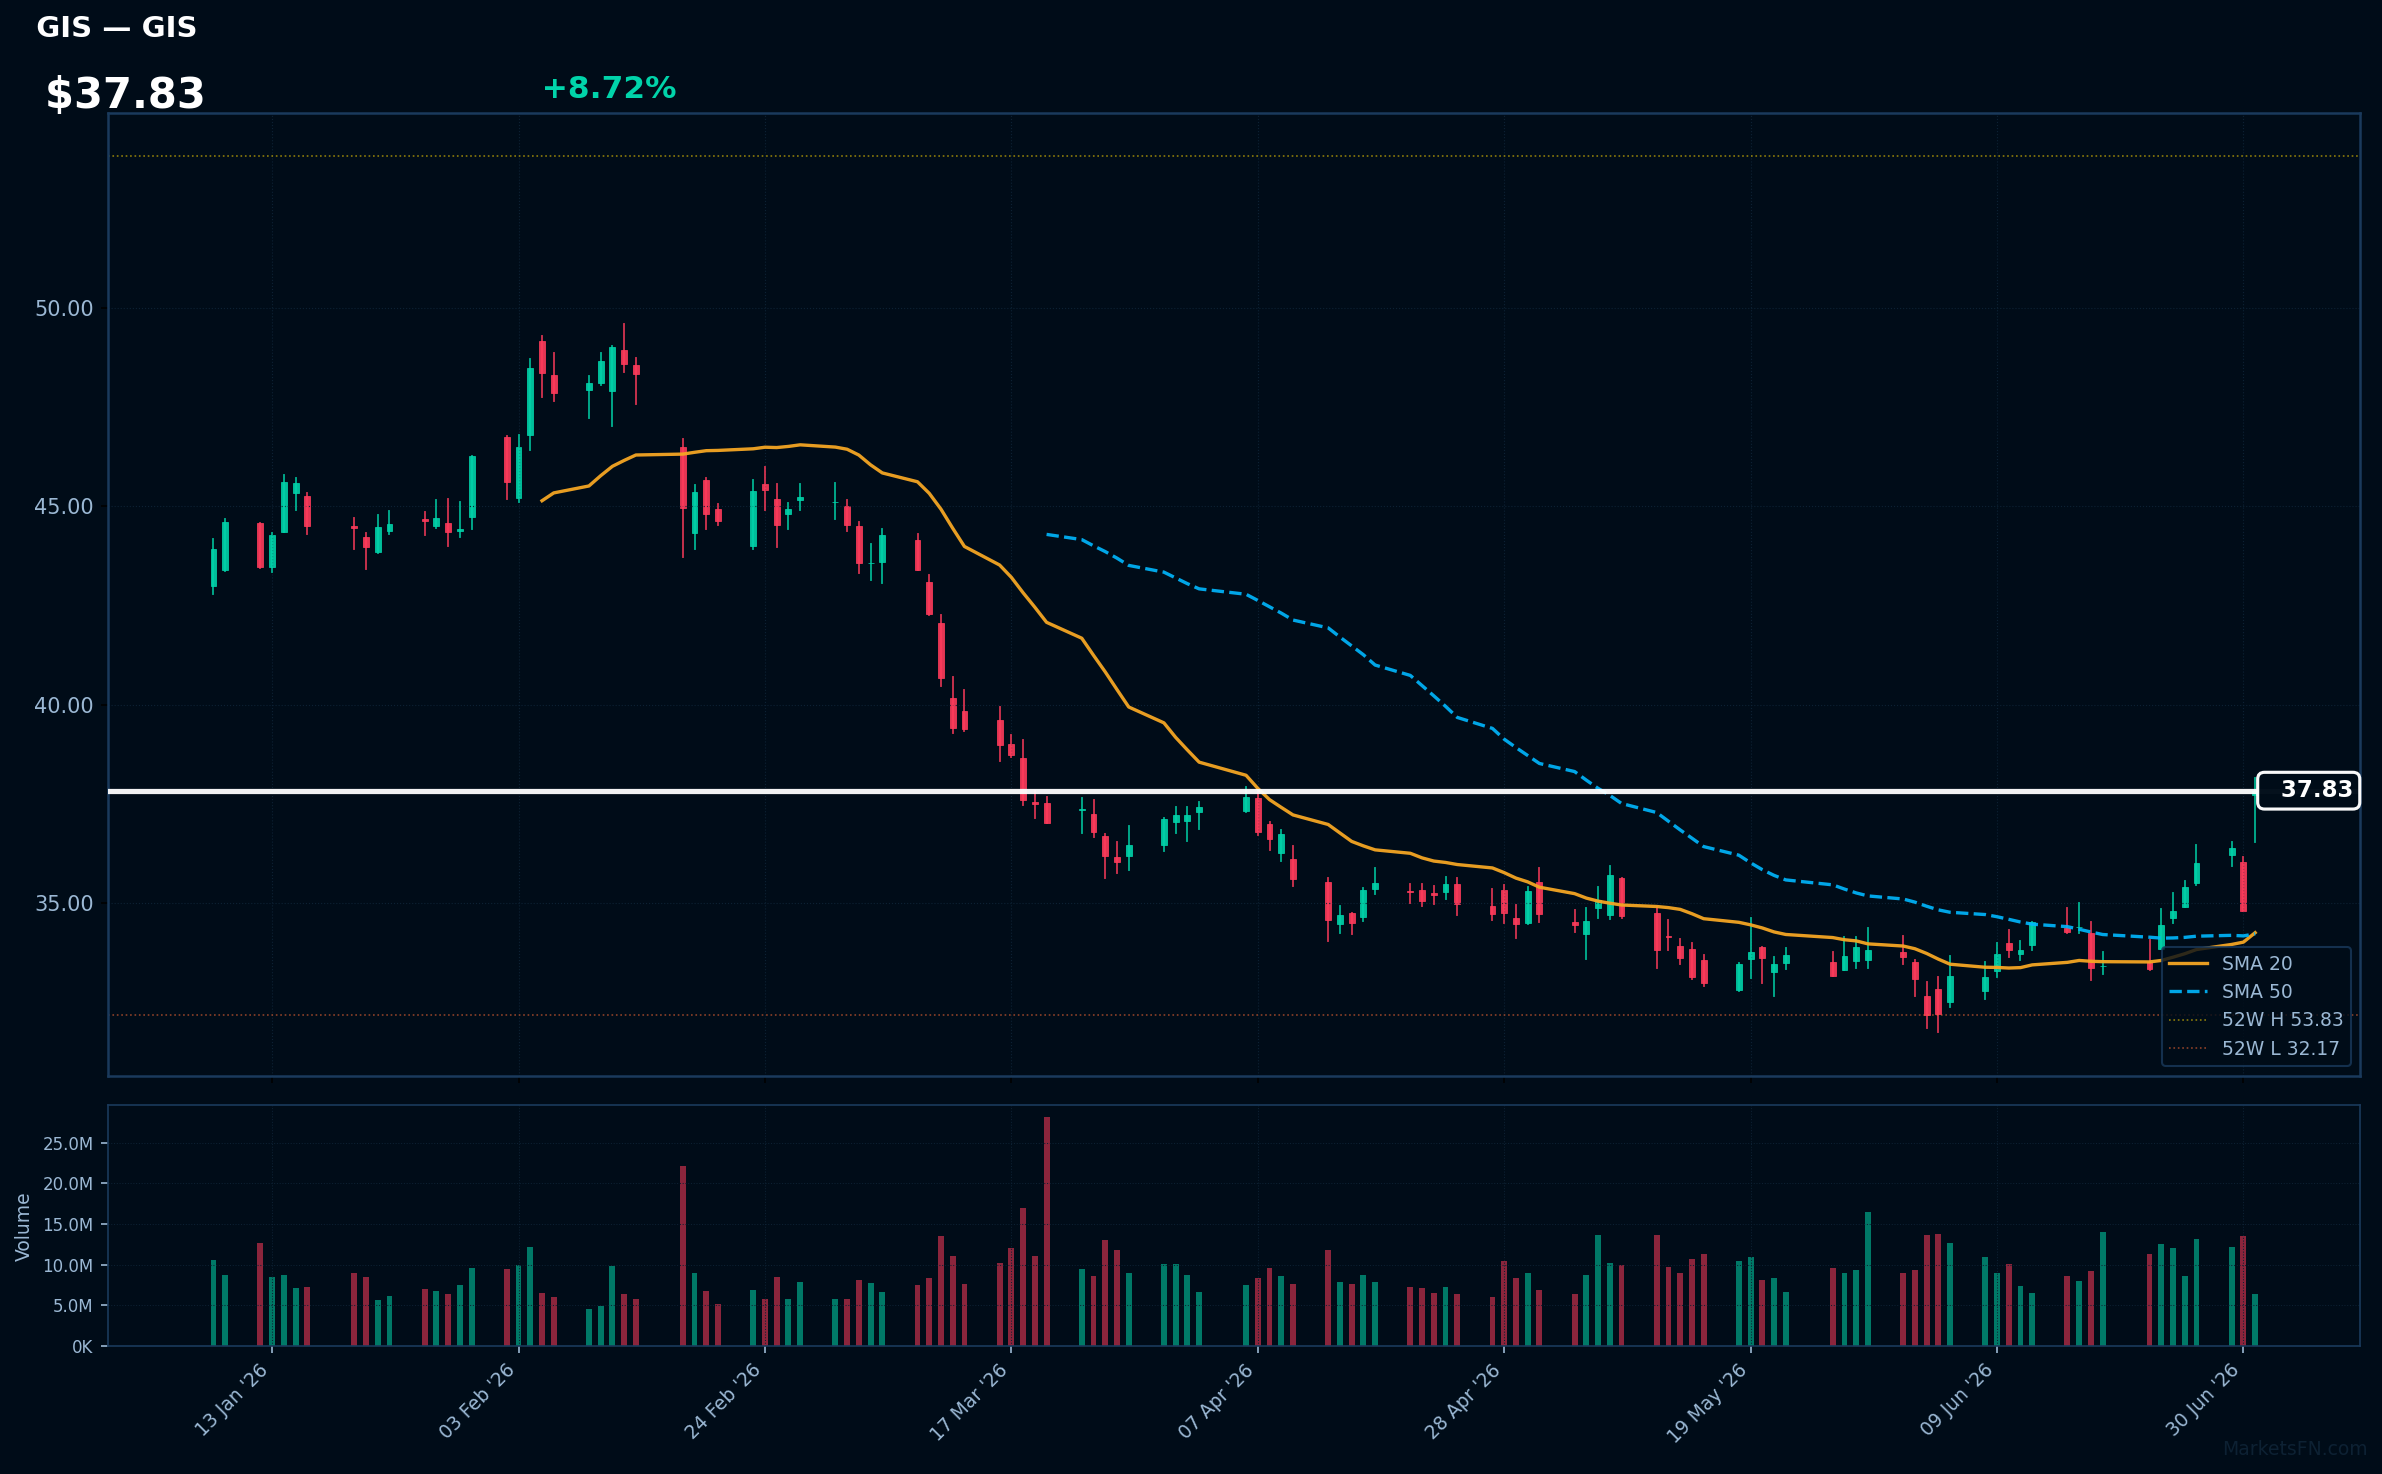
GIS | General Mills, Inc | Consumer Defensive | Price: $37.83 | Day: +8.72% | 1W: +8.71% | 1M: +12.49% | RSI: 67.8 | vs MA200: -10.7% | Trend: Above MA20, MA50 · Below MA200
Recent headlines (last 12h)
- General Mills Shares Gain On Higher Q4 Adj. Earnings, Sales Growth; $3 Bln Cost Savings Target
- General Mills tops quarterly expectations despite cautious FY2027 outlook
- ?? Earnings Snippet: General Mills
- General Mills Swings to Loss, Works to Win Back 'Challenging' Consumers
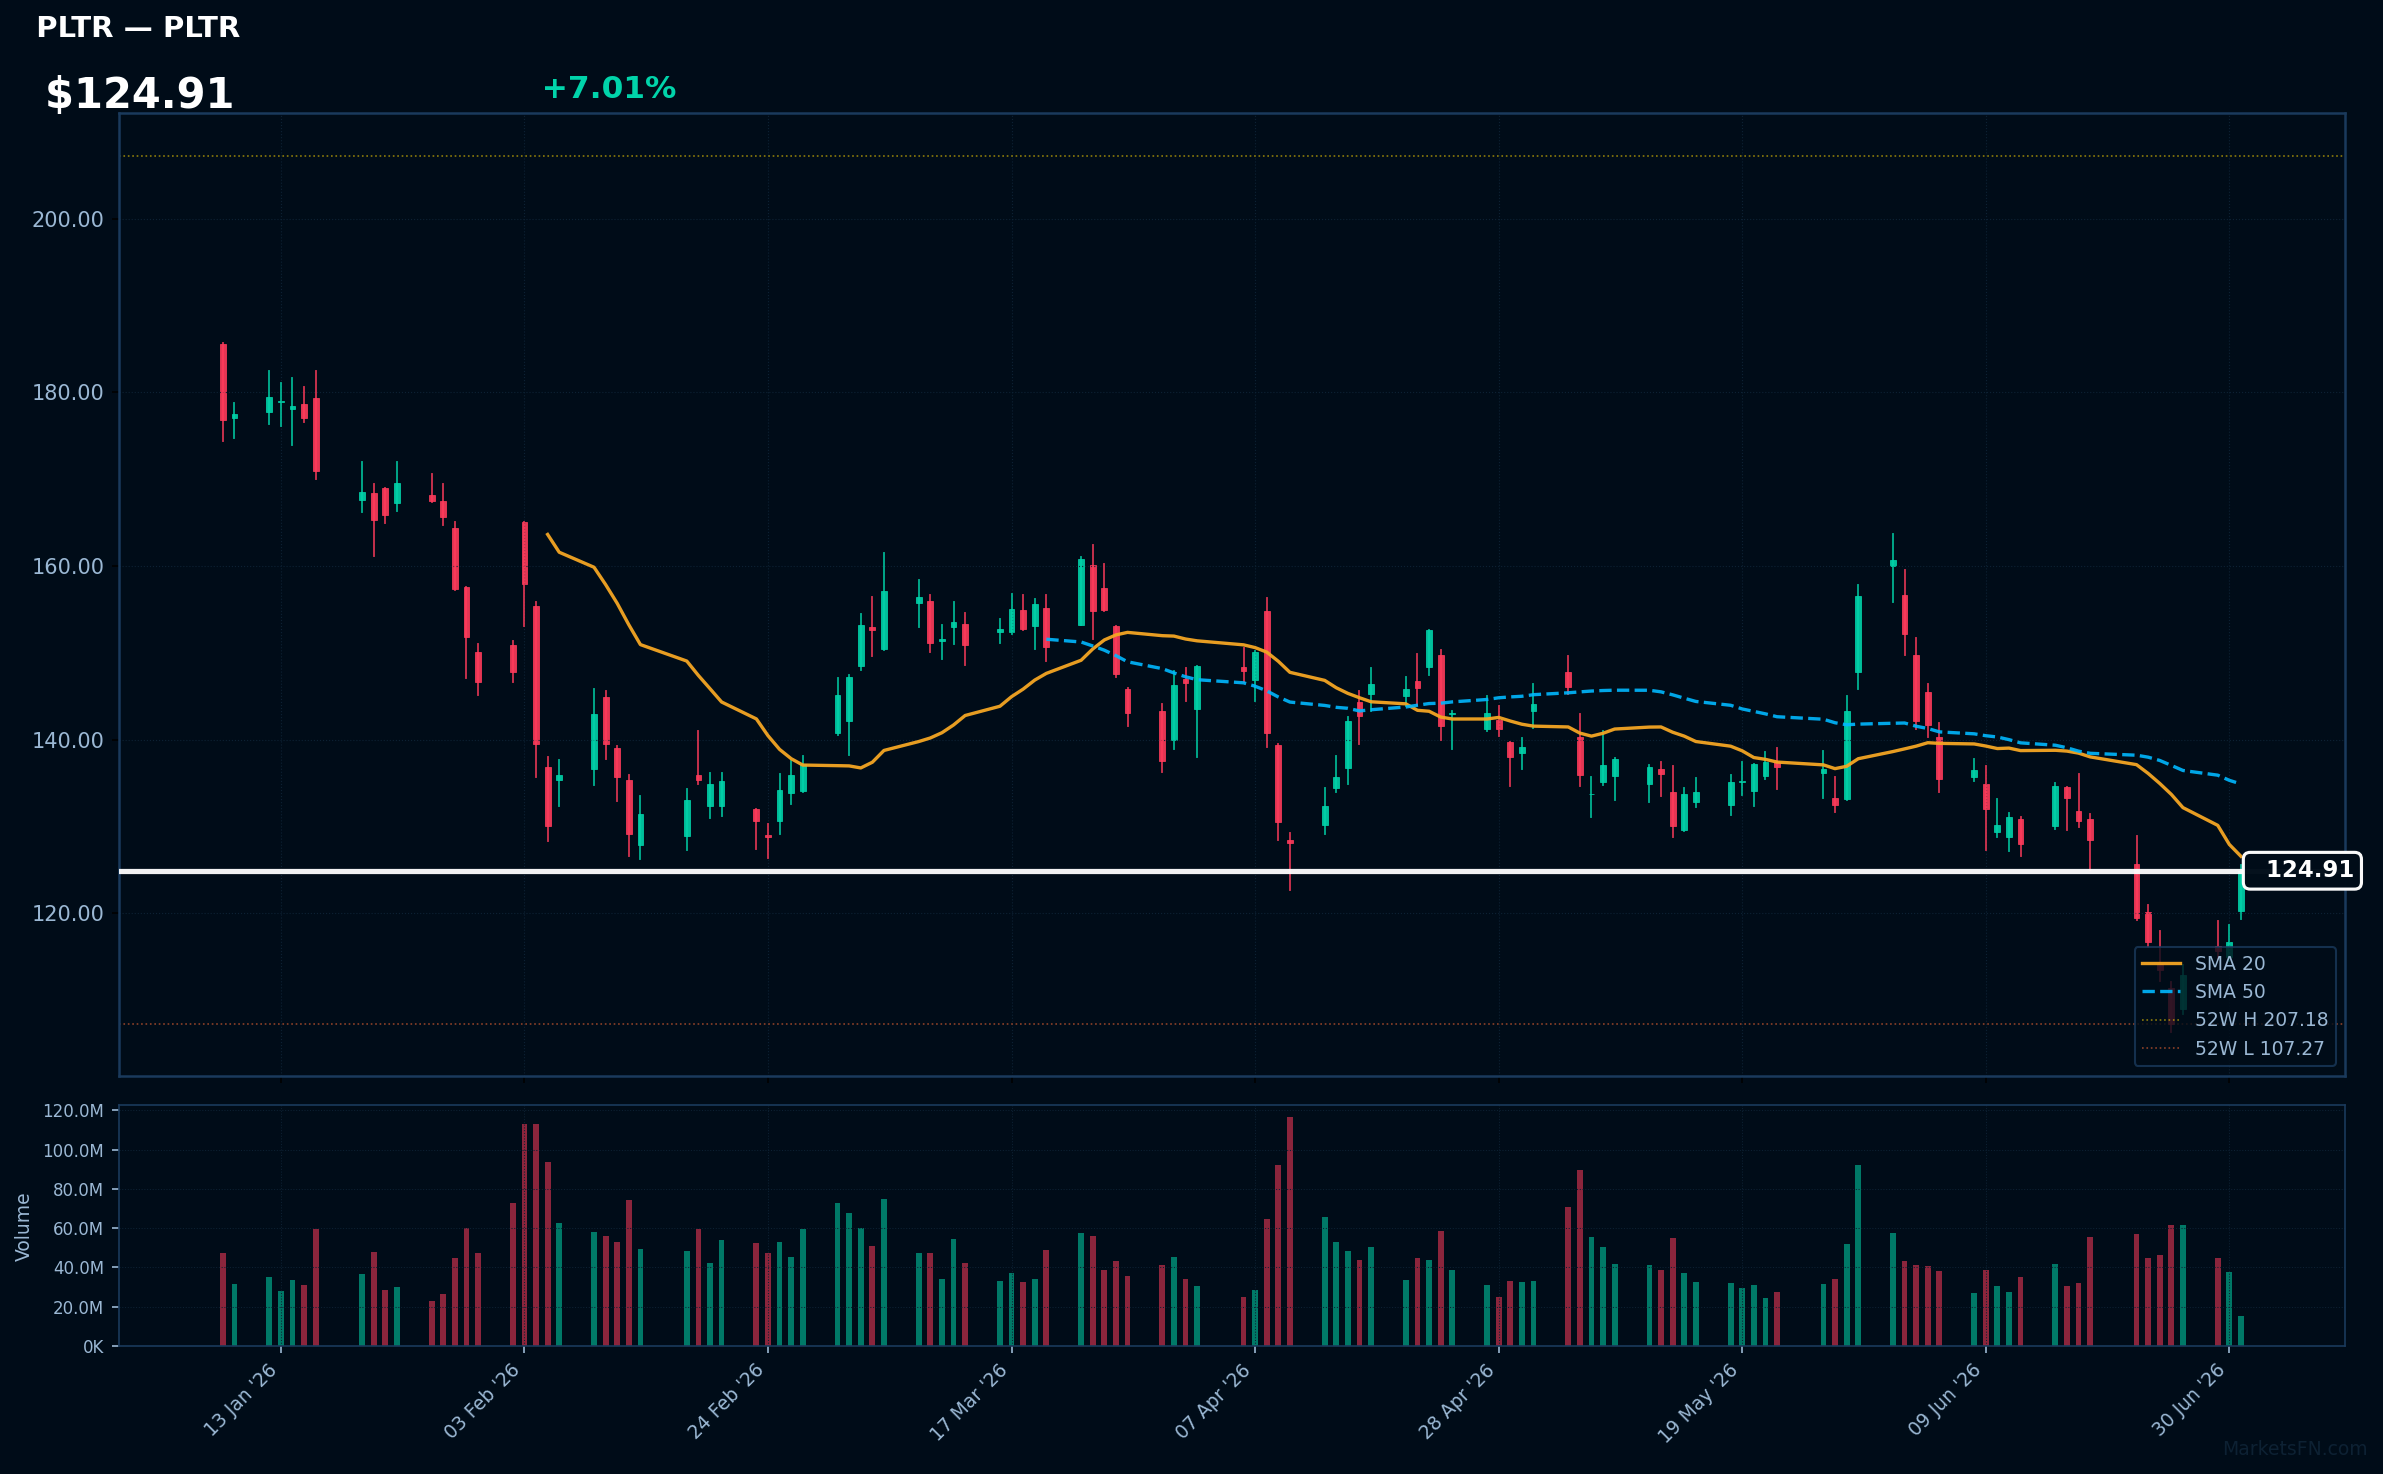
PLTR | Palantir Technologies Inc | Technology | Price: $124.85 | Day: +7.01% | 1W: +10.05% | 1M: -22.25% | RSI: 47.6 | vs MA200: -21.0% | Trend: Below MA20, MA50, MA200
Recent headlines (last 12h)
- Alex Karp Touts Palantir-Nvidia Partnership For Secure AI, Criticizes OpenAI And Anthropic Over Lack Of IP Protection
- President Trump Reveals Million-Dollar Apple and Palantir Stakes
- Cathie Wood's Biggest Portfolio Moves Reveal Where She's Betting Next
- Trump's Crypto Billions, Apple Stock, and More From His Latest Financial Filing
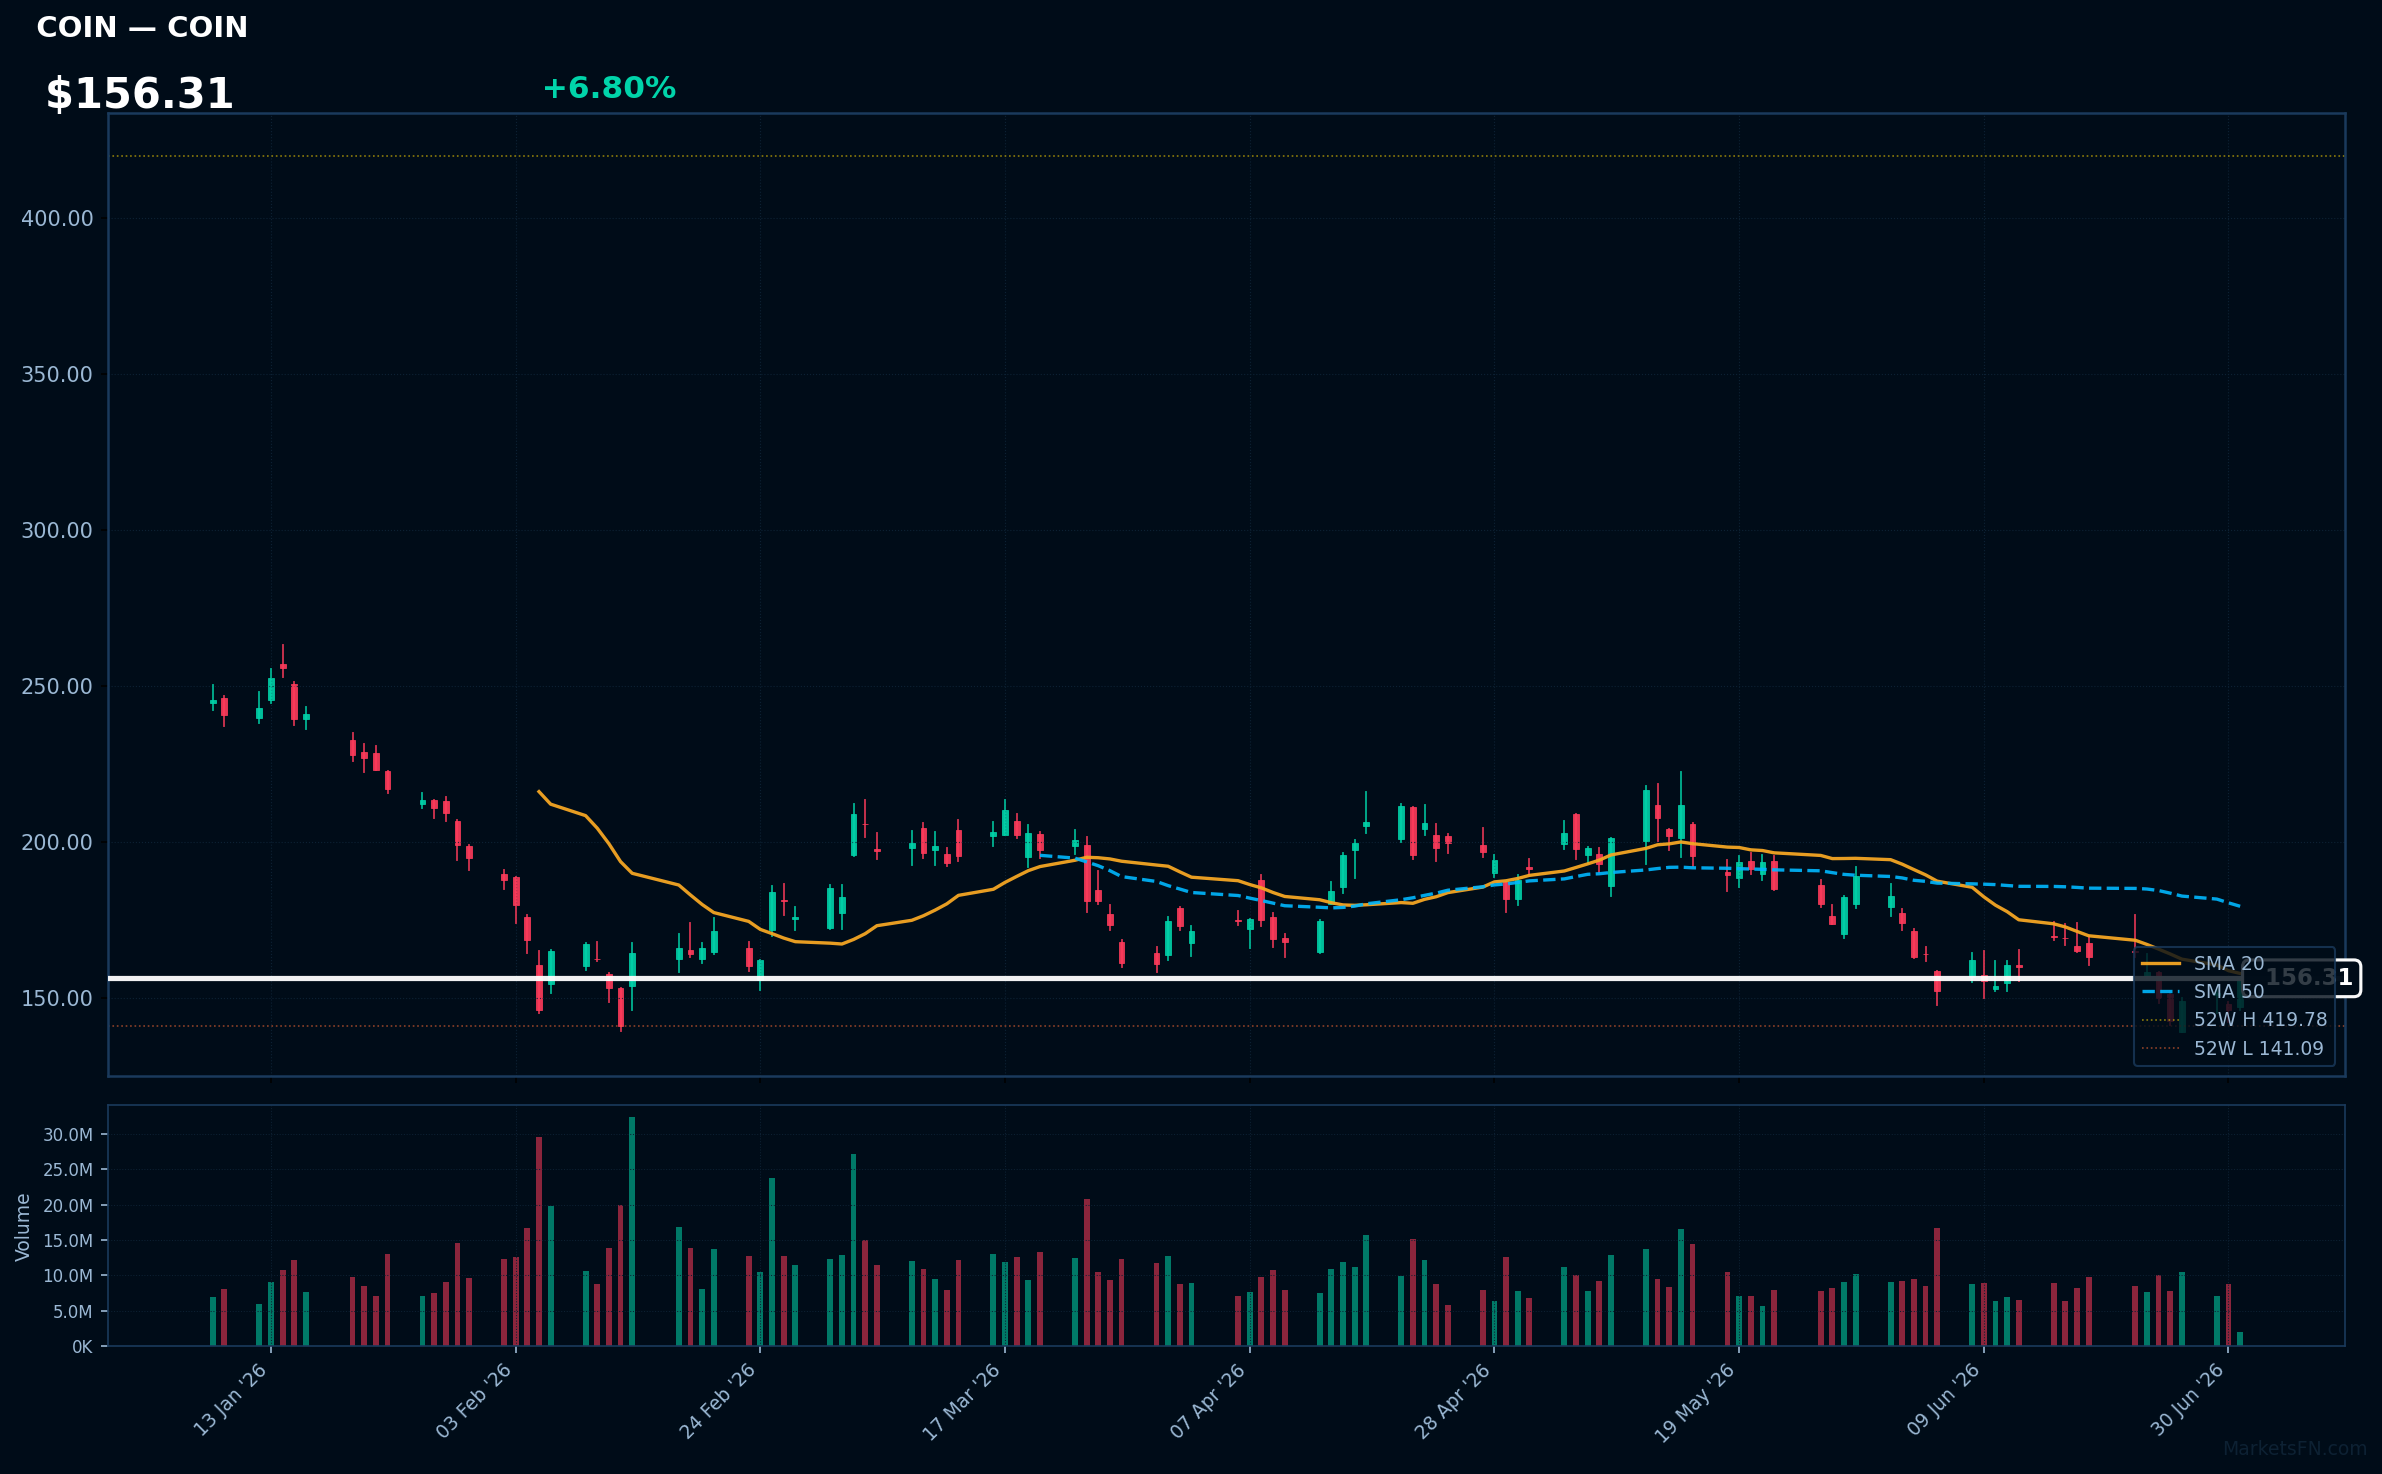
COIN | Coinbase Global Inc | Financial | Price: $156.13 | Day: +6.80% | 1W: +4.13% | 1M: -14.40% | RSI: 45.2 | vs MA200: -32.6% | Trend: Below MA20, MA50, MA200
Recent headlines (last 12h)
- Cathie Wood's Biggest Portfolio Moves Reveal Where She's Betting Next
- The Battle For Digital Dollar Just Got Real And Wall Street Cannot Agree On The Winner
- Visa, Mastercard, Coinbase and BlackRock Unite Behind Open USD (OUSD): The First Real Threat to USDT and USDC?
- The 8-Week Bitcoin Demand Drought Points to Where the Money Went
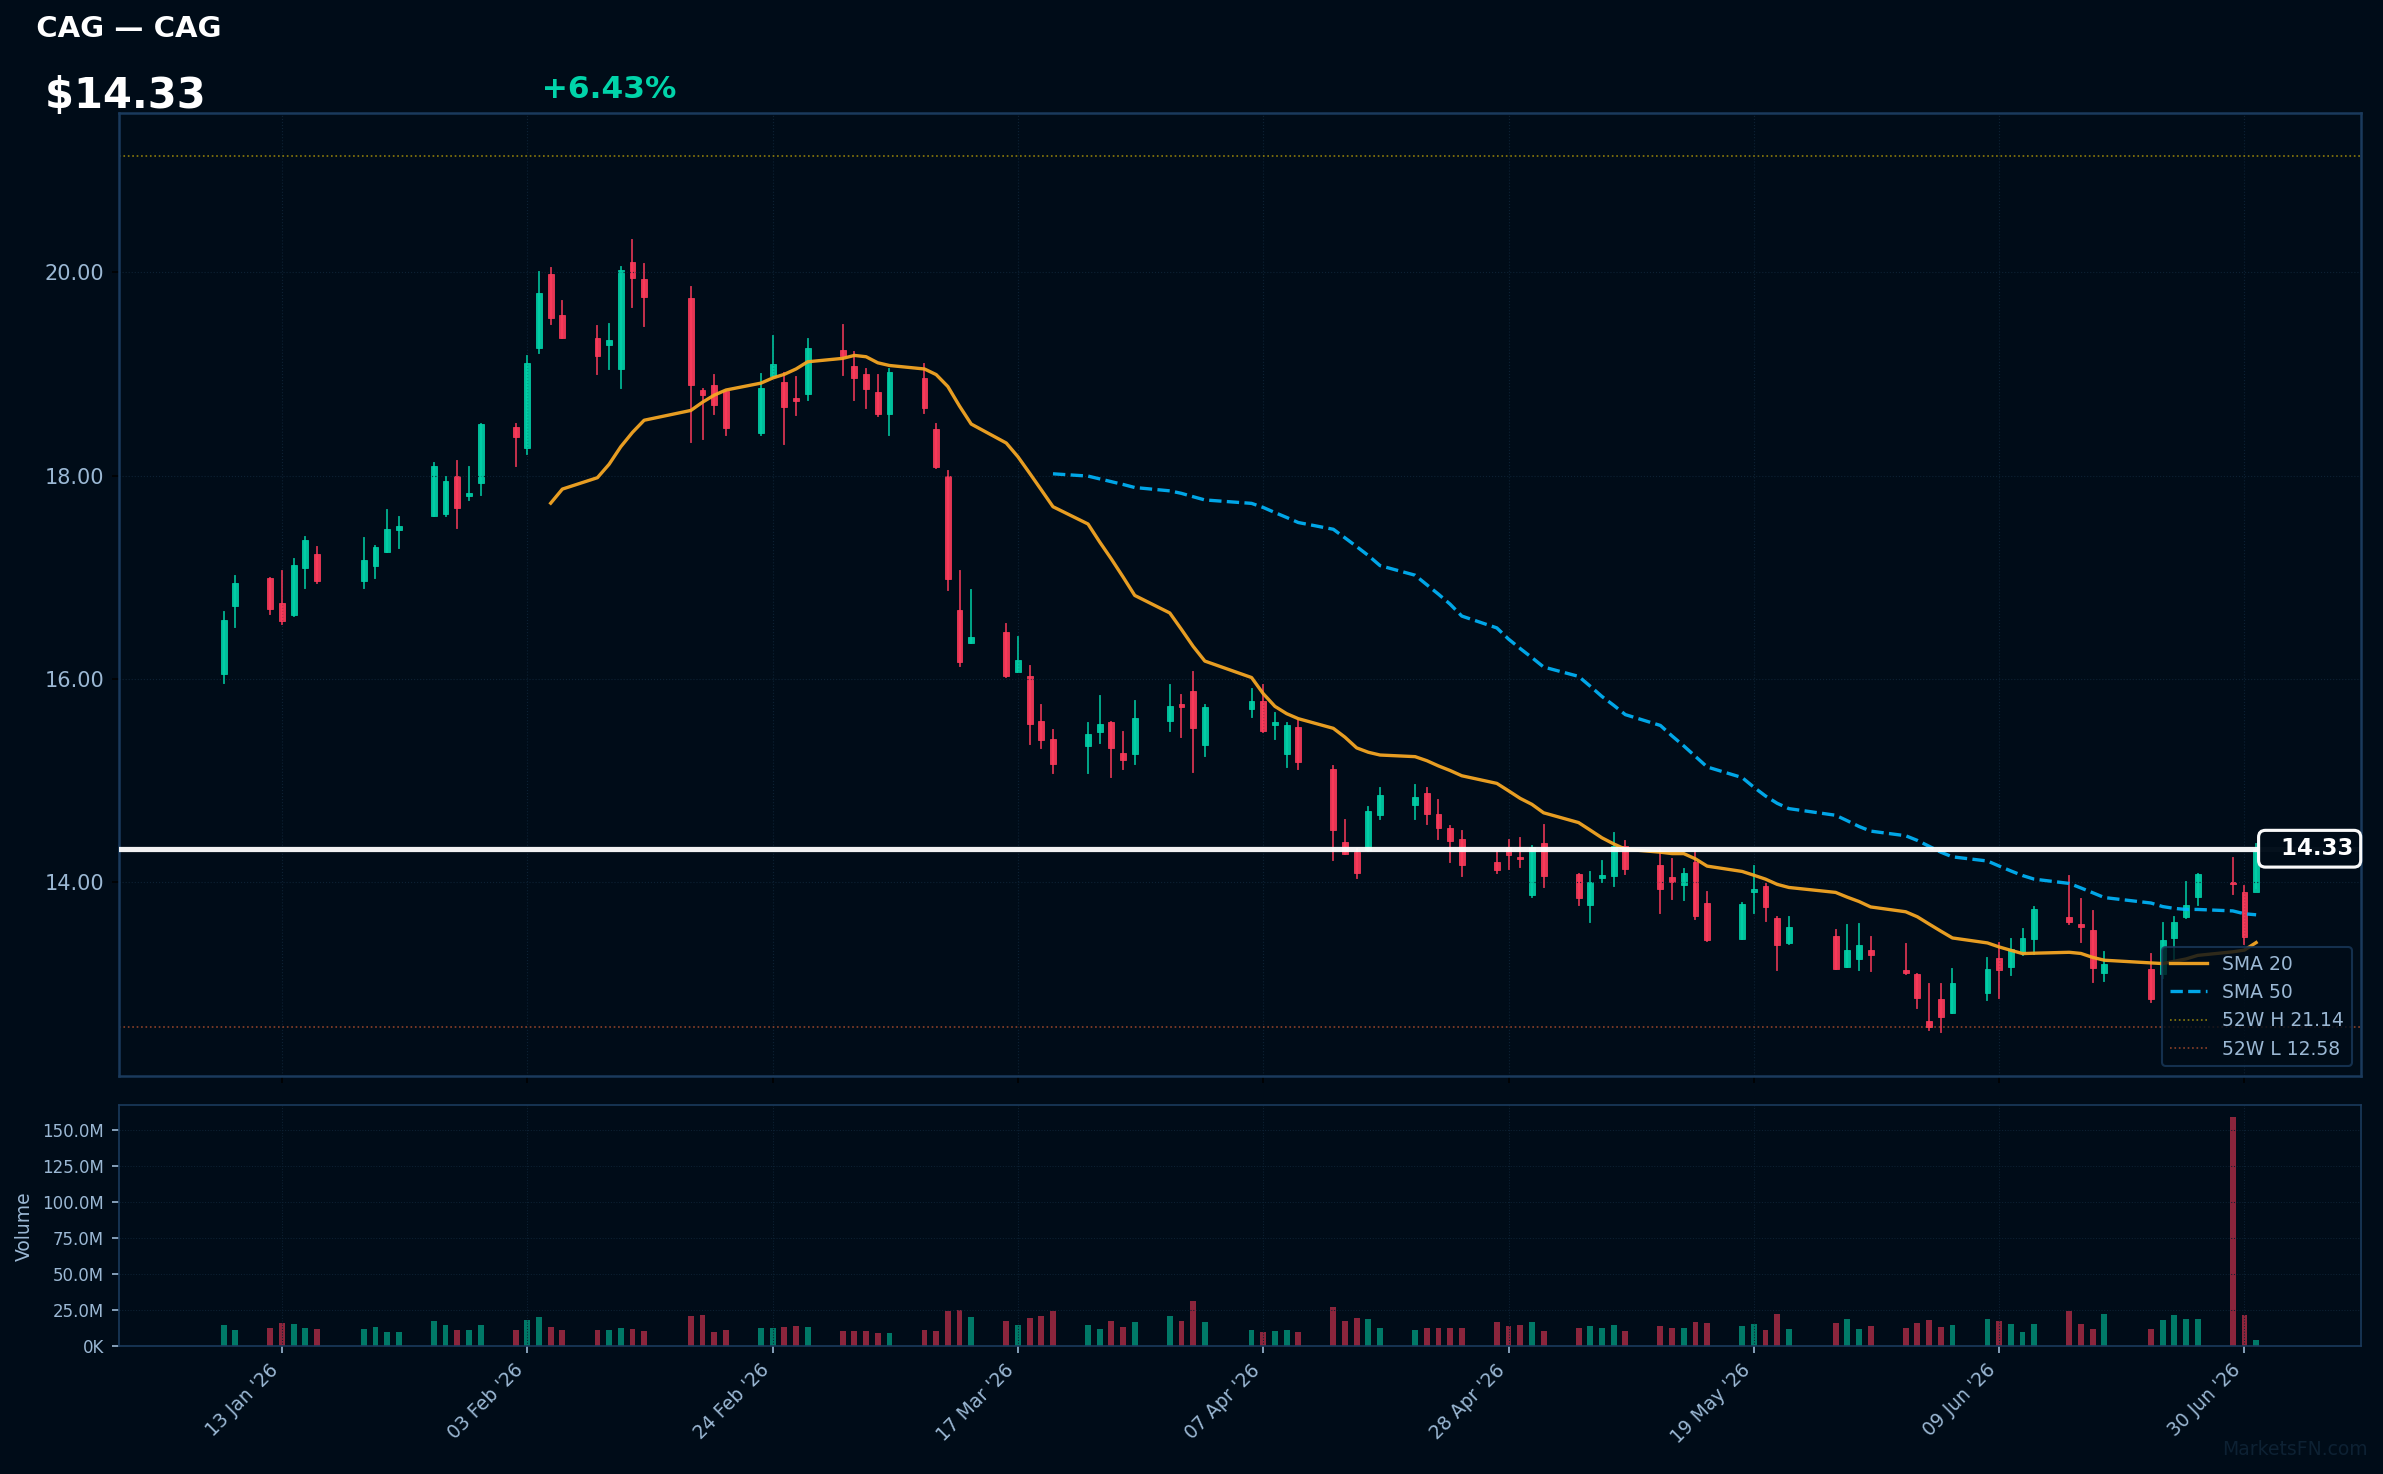
CAG | Conagra Brands Inc | Consumer Defensive | Price: $14.32 | Day: +6.43% | 1W: +5.29% | 1M: +9.31% | RSI: 59.9 | vs MA200: -13.6% | Trend: Above MA20, MA50 · Below MA200
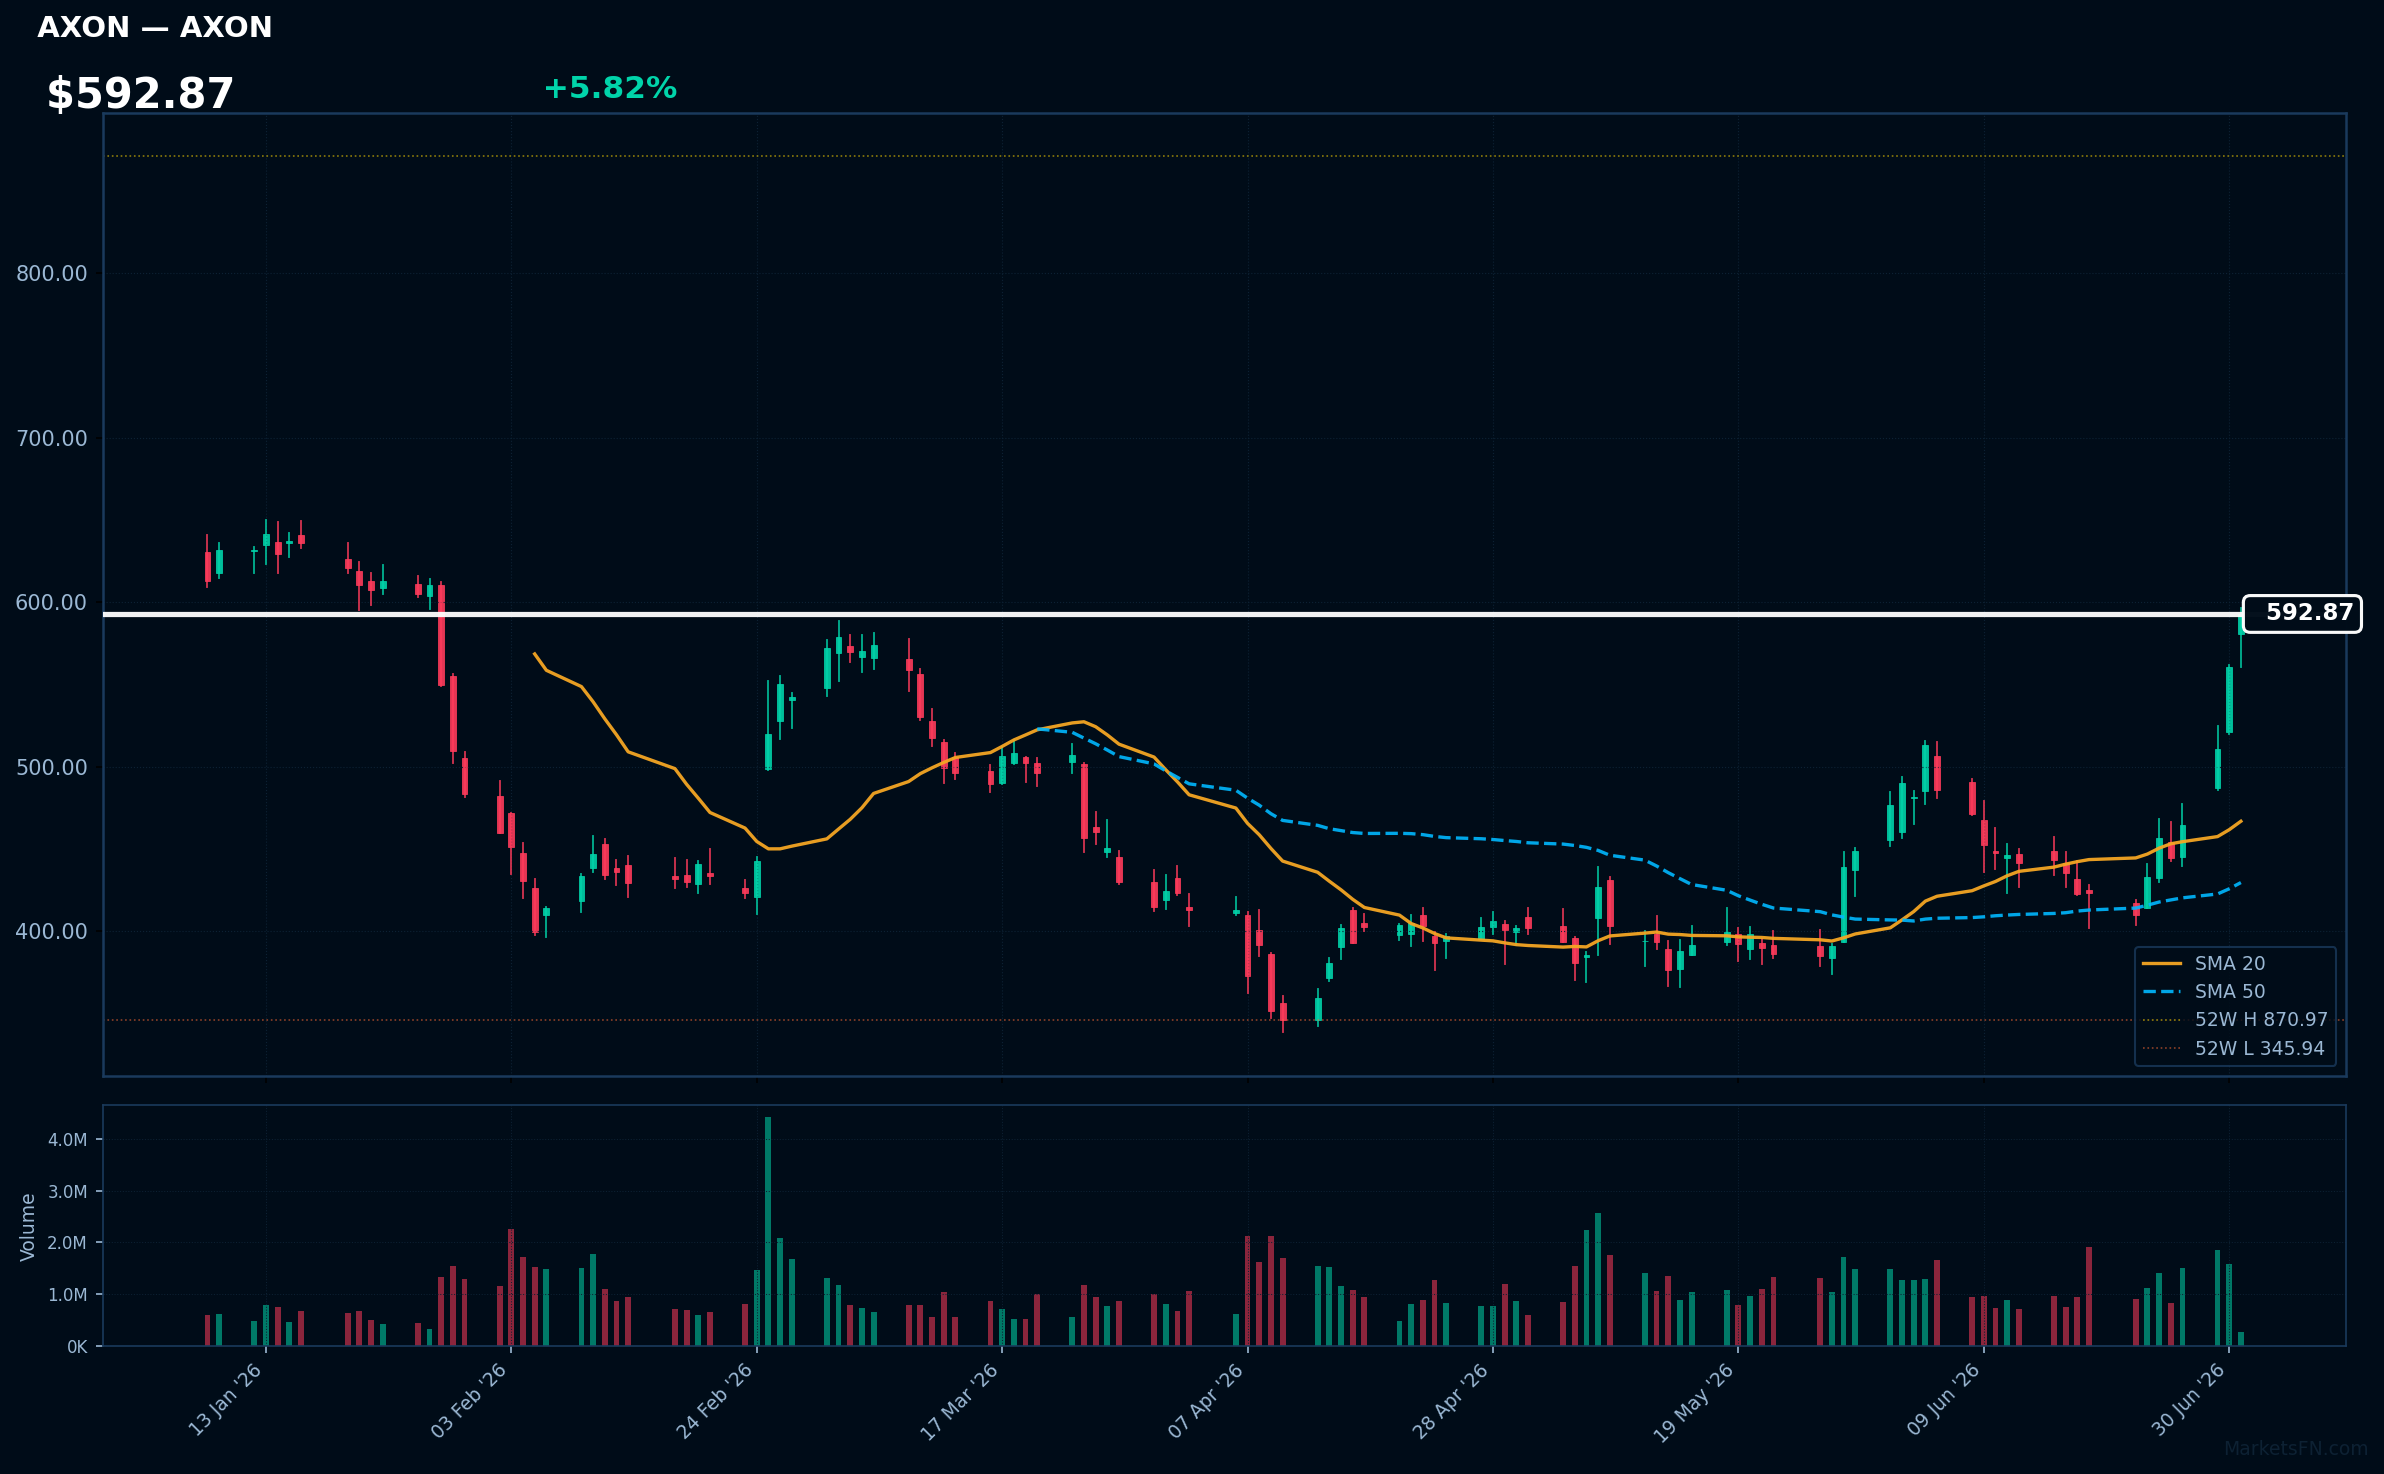
AXON | Axon Enterprise Inc | Industrials | Price: $593.24 | Day: +5.82% | 1W: +29.81% | 1M: +24.32% | RSI: 76.5 | vs MA200: +11.0% | Trend: Above MA20, MA50, MA200
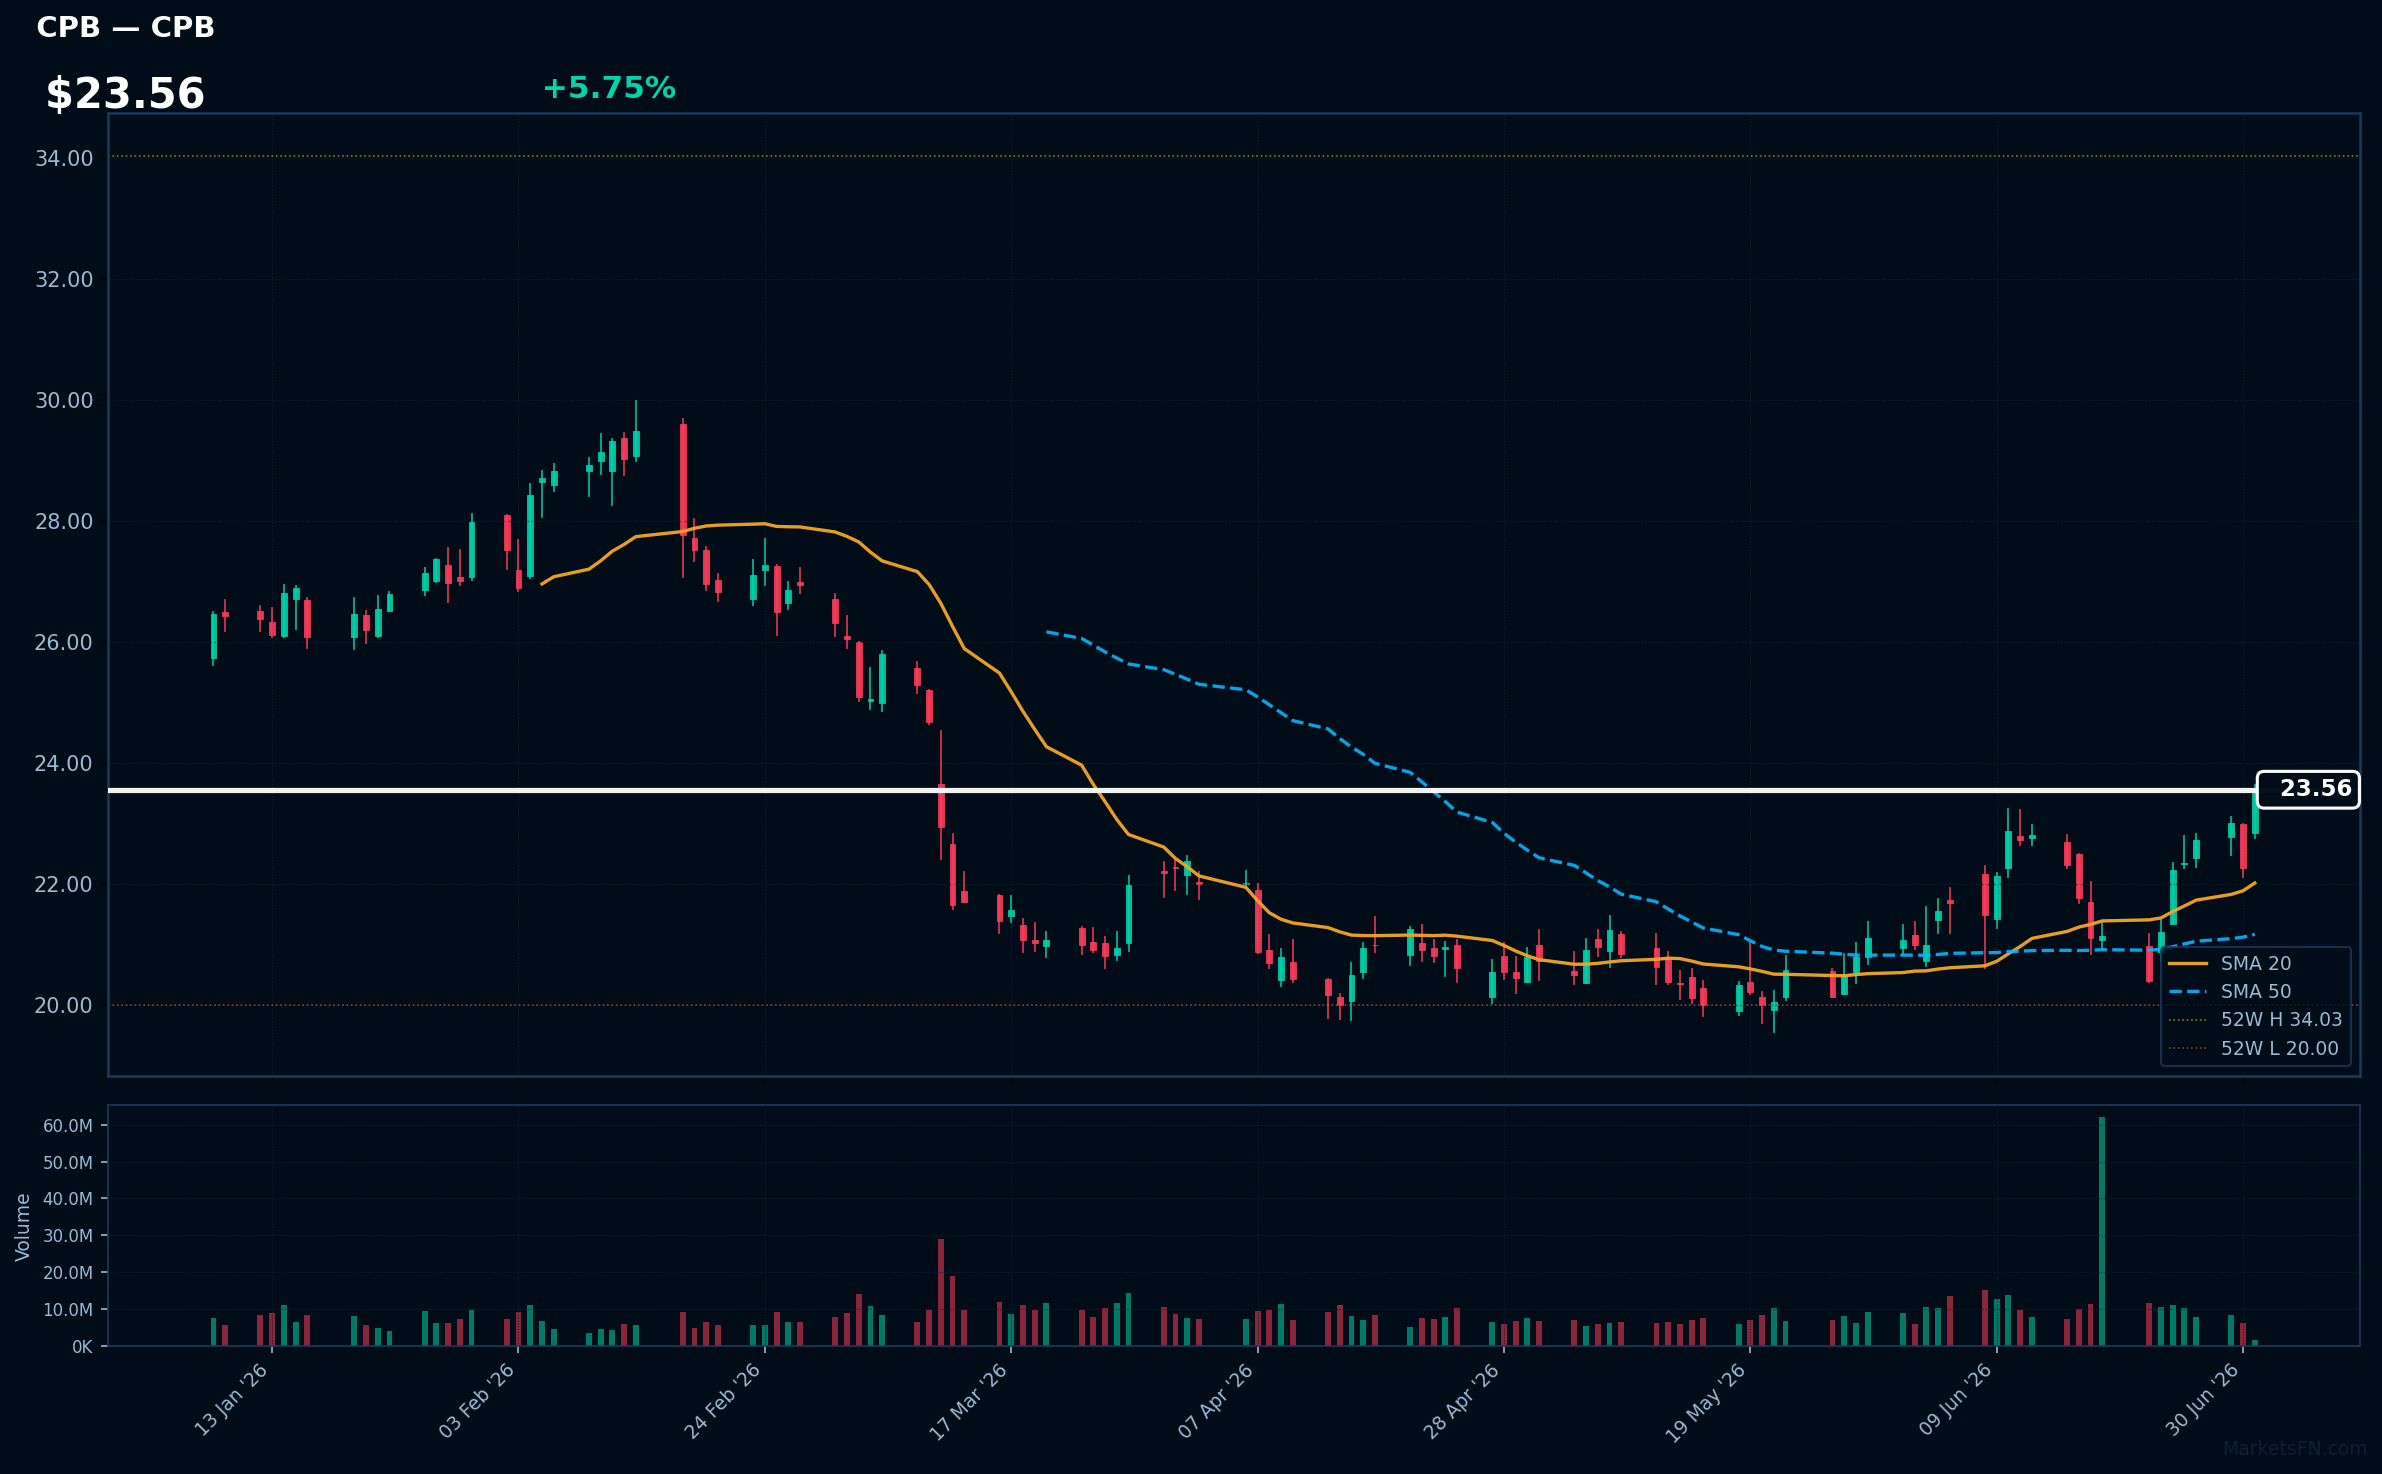
CPB | Campbells Co | Consumer Defensive | Price: $23.55 | Day: +5.75% | 1W: +5.94% | 1M: +11.76% | RSI: 63.9 | vs MA200: -9.7% | Trend: Above MA20, MA50 · Below MA200
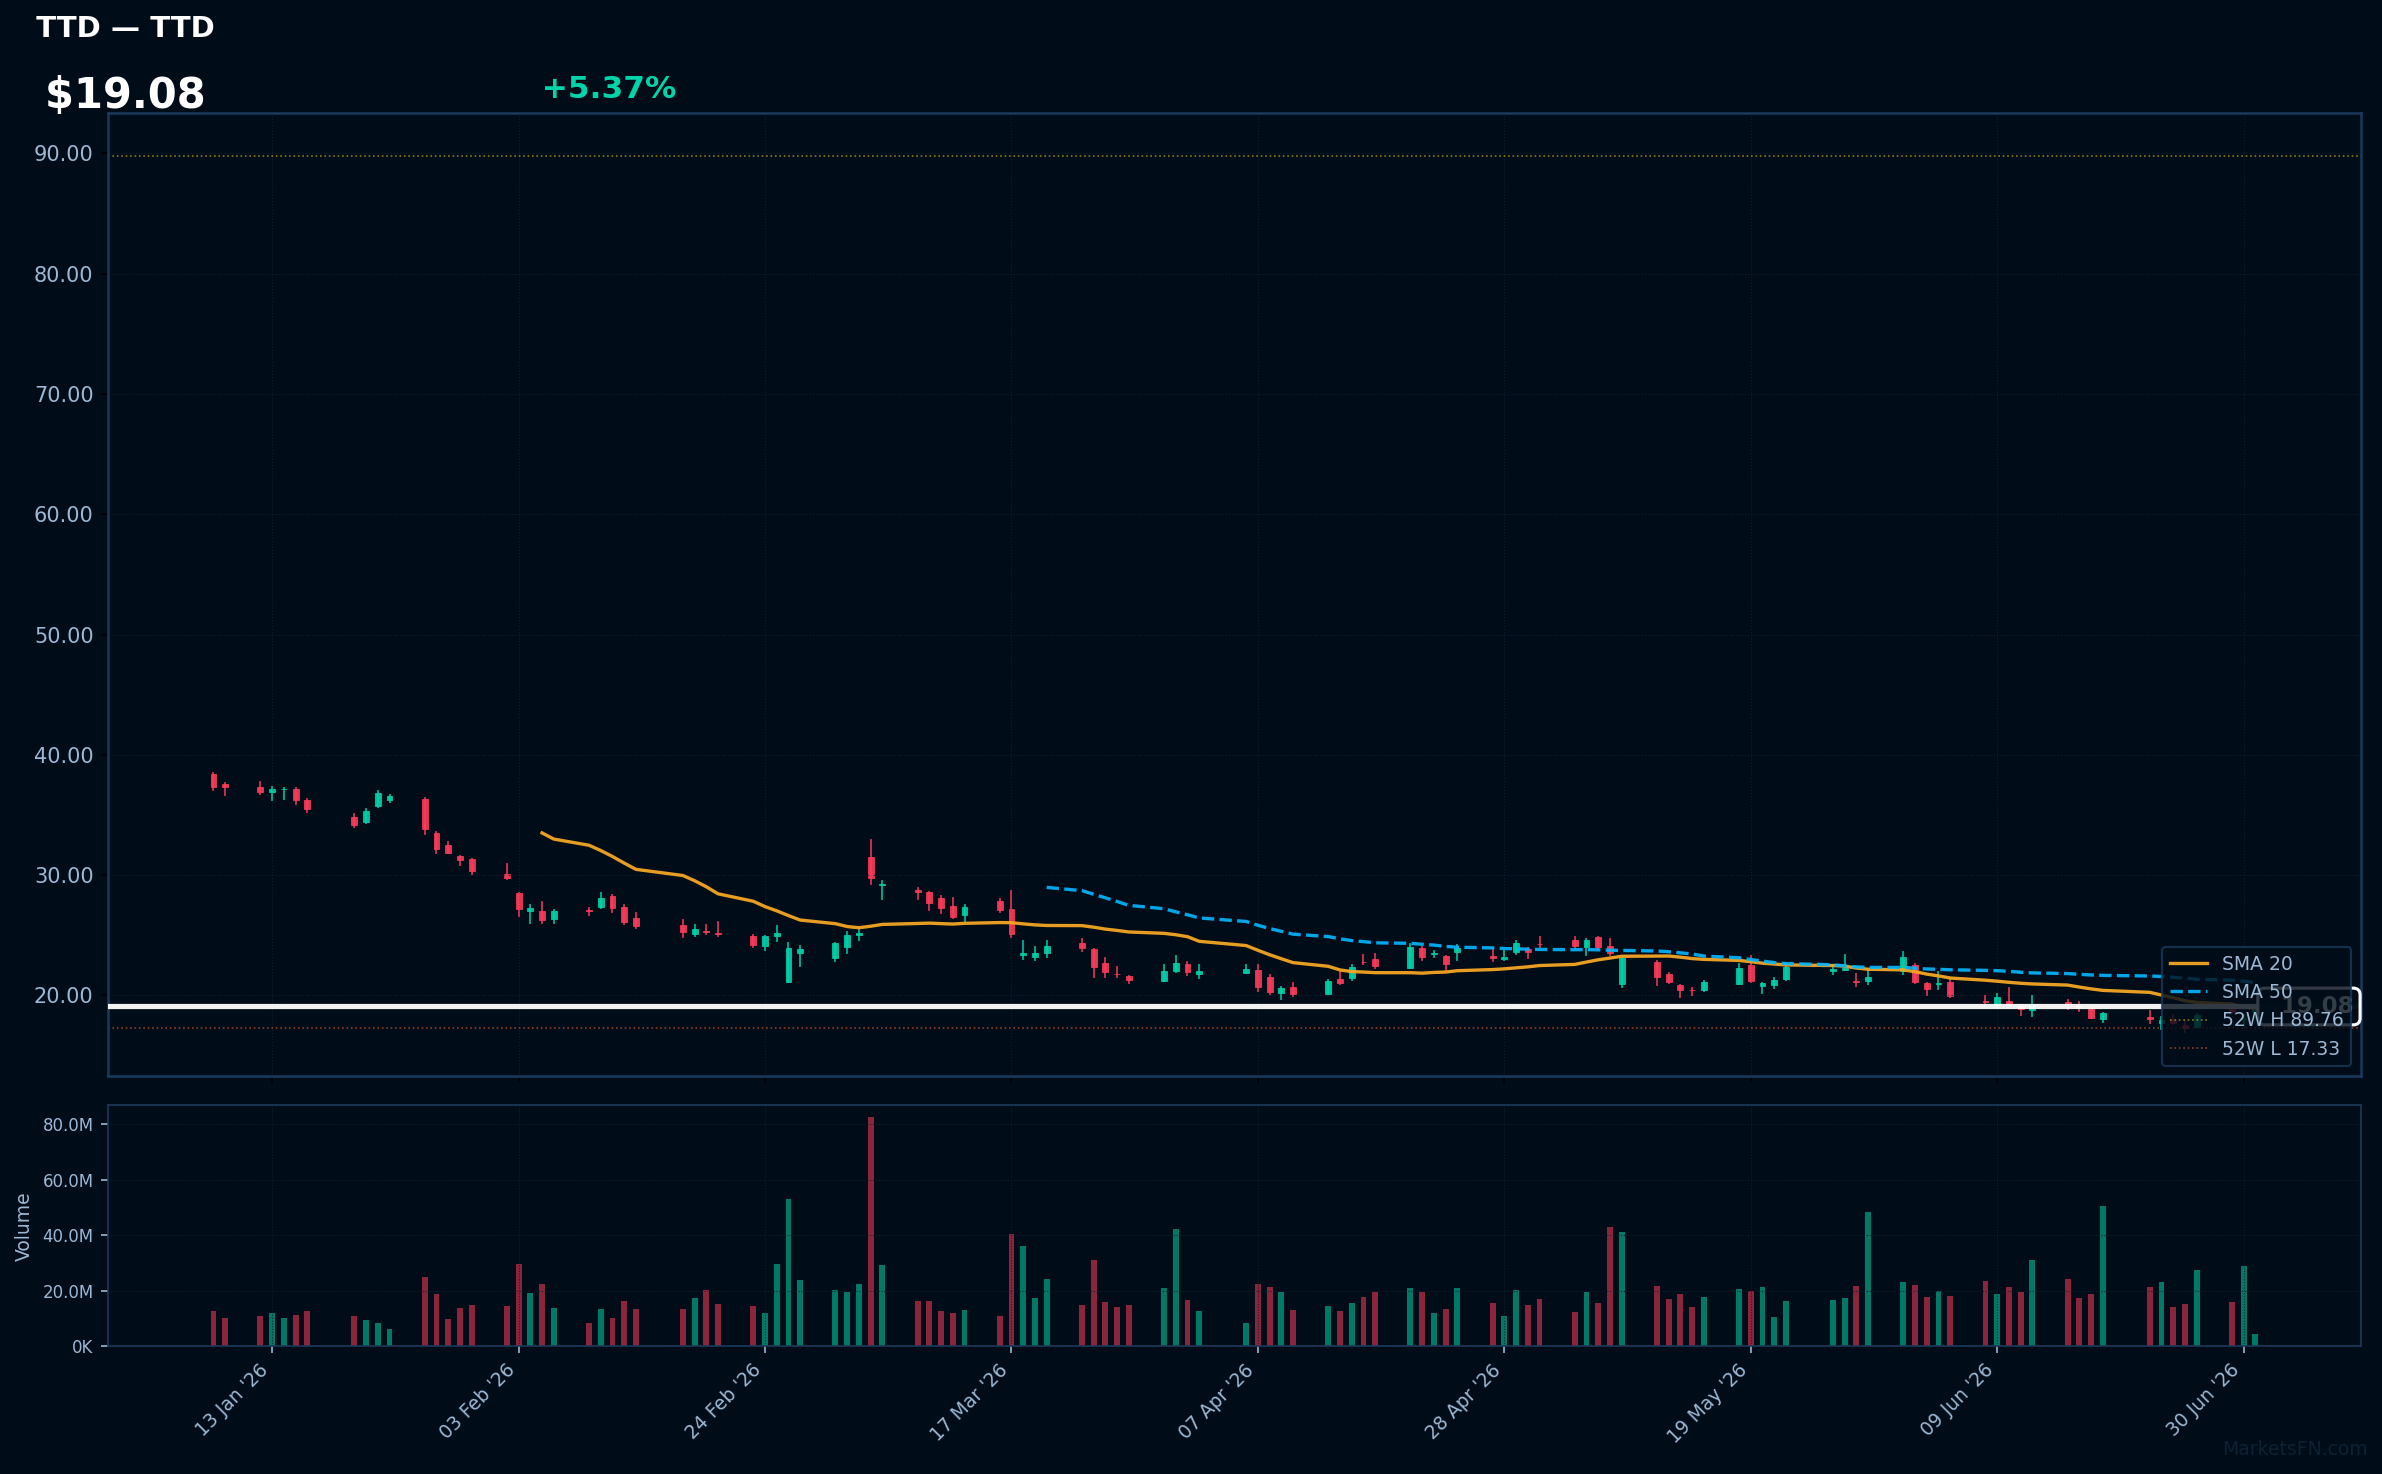
TTD | Trade Desk Inc | Communication Services | Price: $19.05 | Day: +5.37% | 1W: +7.79% | 1M: -17.83% | RSI: 47.5 | vs MA200: -41.3% | Trend: Above MA20 · Below MA50, MA200
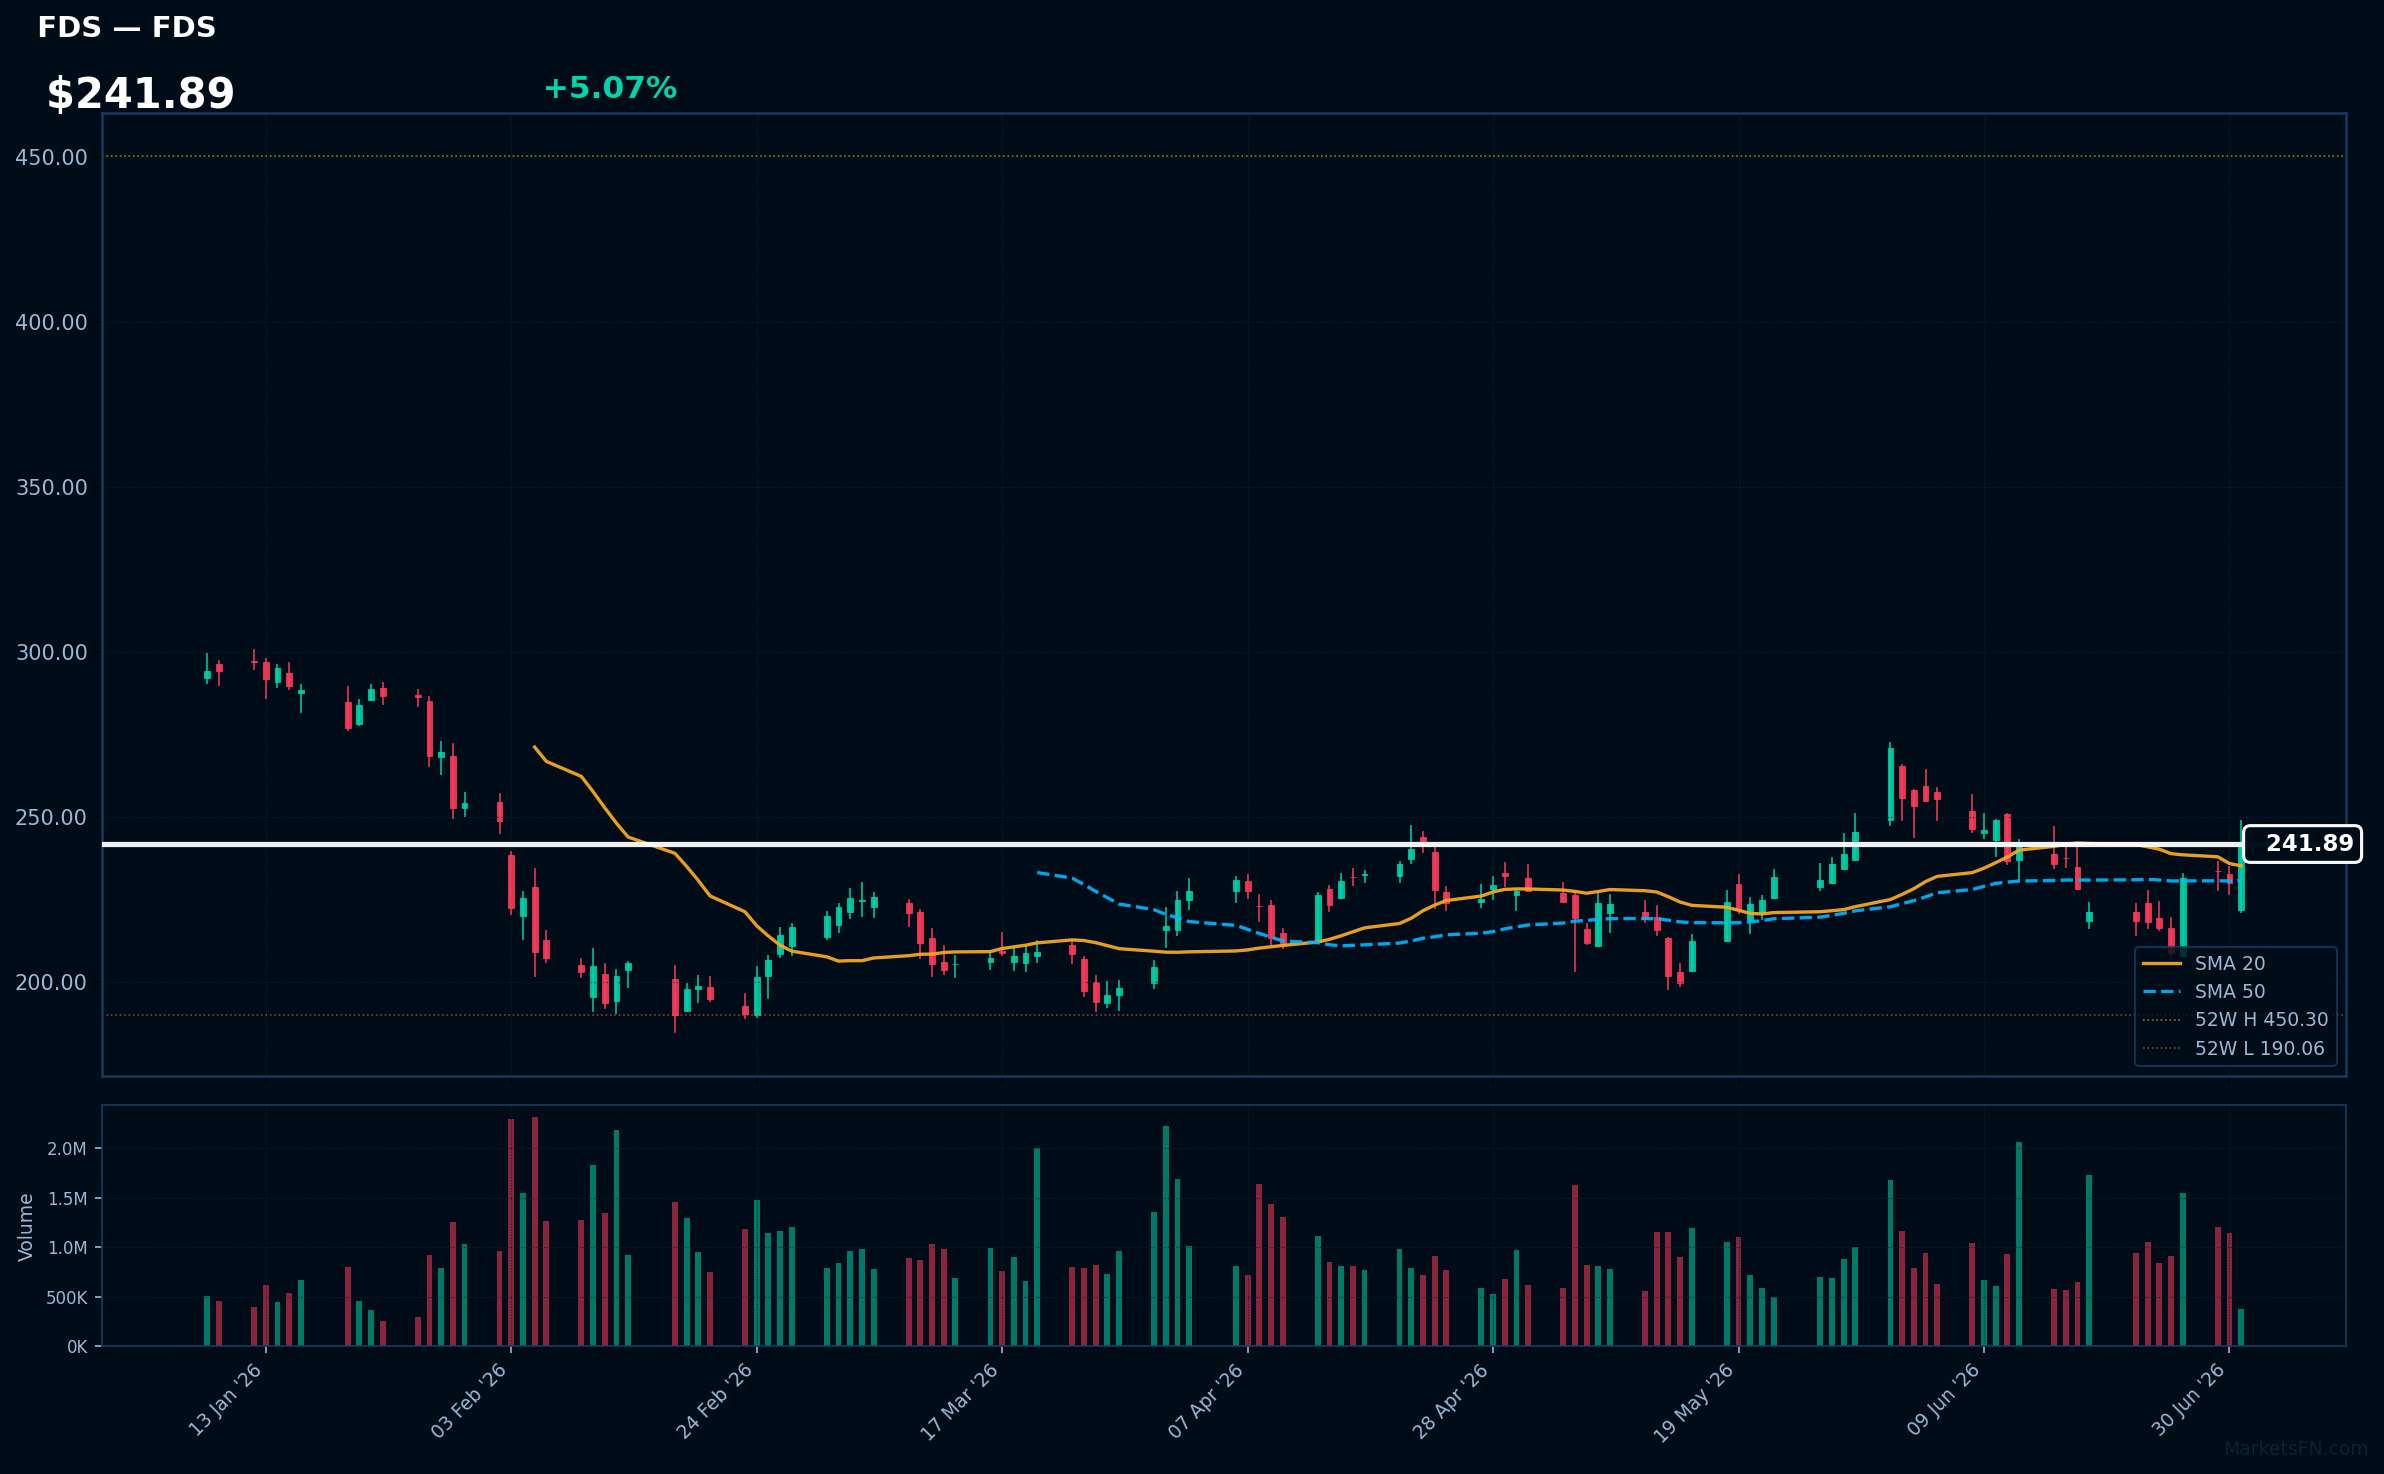
FDS | Factset Research Systems Inc | Financial | Price: $241.74 | Day: +5.07% | 1W: +11.75% | 1M: -10.69% | RSI: 56.1 | vs MA200: -3.9% | Trend: Above MA20, MA50 · Below MA200
Recent headlines (last 12h)
- FactSet tops quarterly profit estimates on steady demand for data, analytics services
- FactSet: Fiscal Q3 Earnings Snapshot
- FactSet Reports Results for Third Quarter 2026
- General Mills earnings on tap after a poor period for the company's stock
Top 10 Losers
Today's weakest S&P 500 performers. Sector drag: Technology (9), Consumer Defensive (1).
| Ticker | Company | Sector | Price | Day % | 1W % | 1M % | RSI | vs MA200 | Trend |
|---|---|---|---|---|---|---|---|---|---|
| STX | Seagate Technology Holdings Plc | Technology | $927.19 | -3.92% | -6.60% | +0.70% | 50.3 | +104.3% | Above MA50, MA200 · Below MA20 |
| INTC | Intel Corp | Technology | $133.23 | -4.58% | +1.33% | +22.02% | 58.0 | +122.5% | Above MA20, MA50, MA200 |
| WMT | Walmart Inc | Consumer Defensive | $108.01 | -4.64% | -9.33% | -5.85% | 24.8 | -7.7% | Below MA20, MA50, MA200 |
| WDC | Western Digital Corp | Technology | $606.96 | -4.97% | -5.73% | +11.12% | 51.4 | +110.4% | Above MA50, MA200 · Below MA20 |
| AMAT | Applied Materials Inc | Technology | $685.21 | -5.23% | +16.21% | +49.38% | 65.4 | +103.1% | Above MA20, MA50, MA200 |
| LRCX | Lam Research Corp | Technology | $407.73 | -5.91% | +8.91% | +28.72% | 60.2 | +83.9% | Above MA20, MA50, MA200 |
| KLAC | KLA Corp | Technology | $282.77 | -6.28% | +17.33% | +45.44% | 63.2 | +86.8% | Above MA20, MA50, MA200 |
| MU | Micron Technology Inc | Technology | $1078.71 | -6.55% | +3.04% | +4.33% | 54.7 | +144.9% | Above MA20, MA50, MA200 |
| TER | Teradyne, Inc | Technology | $452.04 | -6.57% | +5.81% | +22.35% | 56.4 | +69.4% | Above MA20, MA50, MA200 |
| GLW | Corning, Inc | Technology | $229.09 | -10.31% | +11.59% | +29.99% | 58.6 | +80.9% | Above MA20, MA50, MA200 |
STX | Seagate Technology Holdings Plc | Technology | Price: $927.19 | Day: -3.92% | 1W: -6.60% | 1M: +0.70% | RSI: 50.3 | vs MA200: +104.3% | Trend: Above MA50, MA200 · Below MA20
Recent headlines (last 12h)
- MU, SNDK, STX, WDC Stocks Slide Premarket: Is The Red-Hot Memory Rally Cooling?
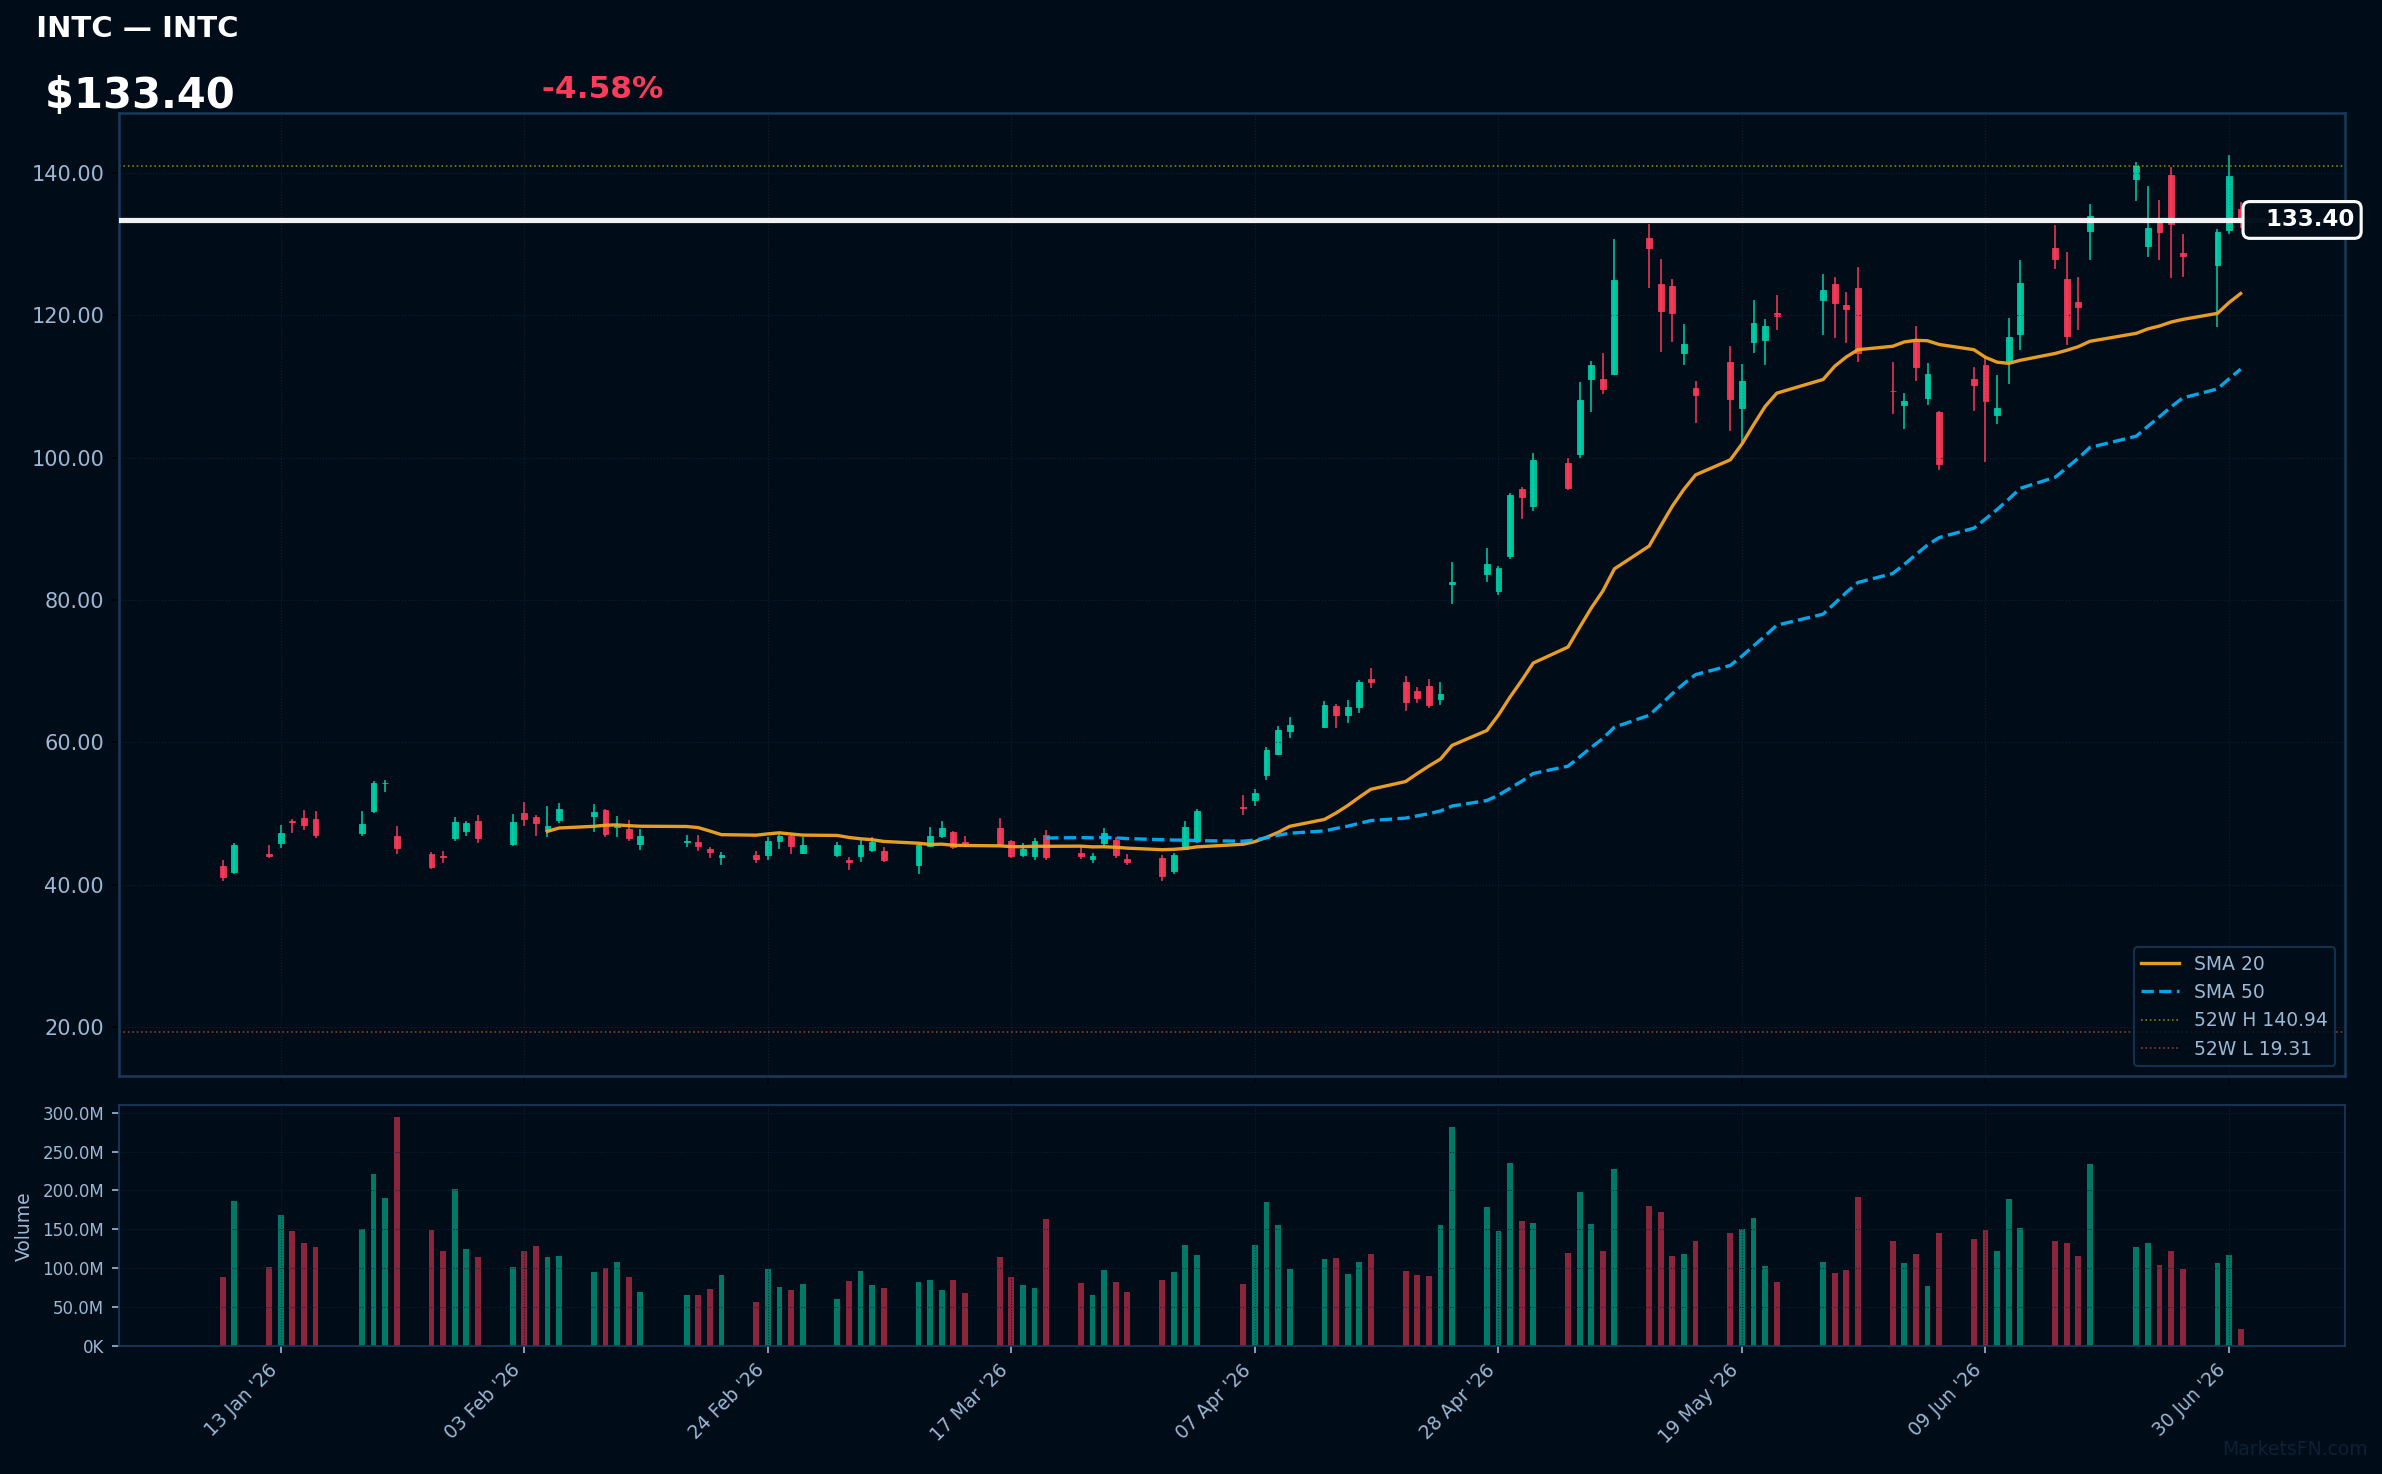
INTC | Intel Corp | Technology | Price: $133.23 | Day: -4.58% | 1W: +1.33% | 1M: +22.02% | RSI: 58.0 | vs MA200: +122.5% | Trend: Above MA20, MA50, MA200
Recent headlines (last 12h)
- Why Did INTC, AMD, BB Stocks Surge To 52-Week Highs?
- Big Tech's first half was a story of hardware versus software
- Micron, Intel, AMD stock surge Q2 2026 AI chip rally
- Stock futures slip after chip stocks gained $2 trillion in Q2
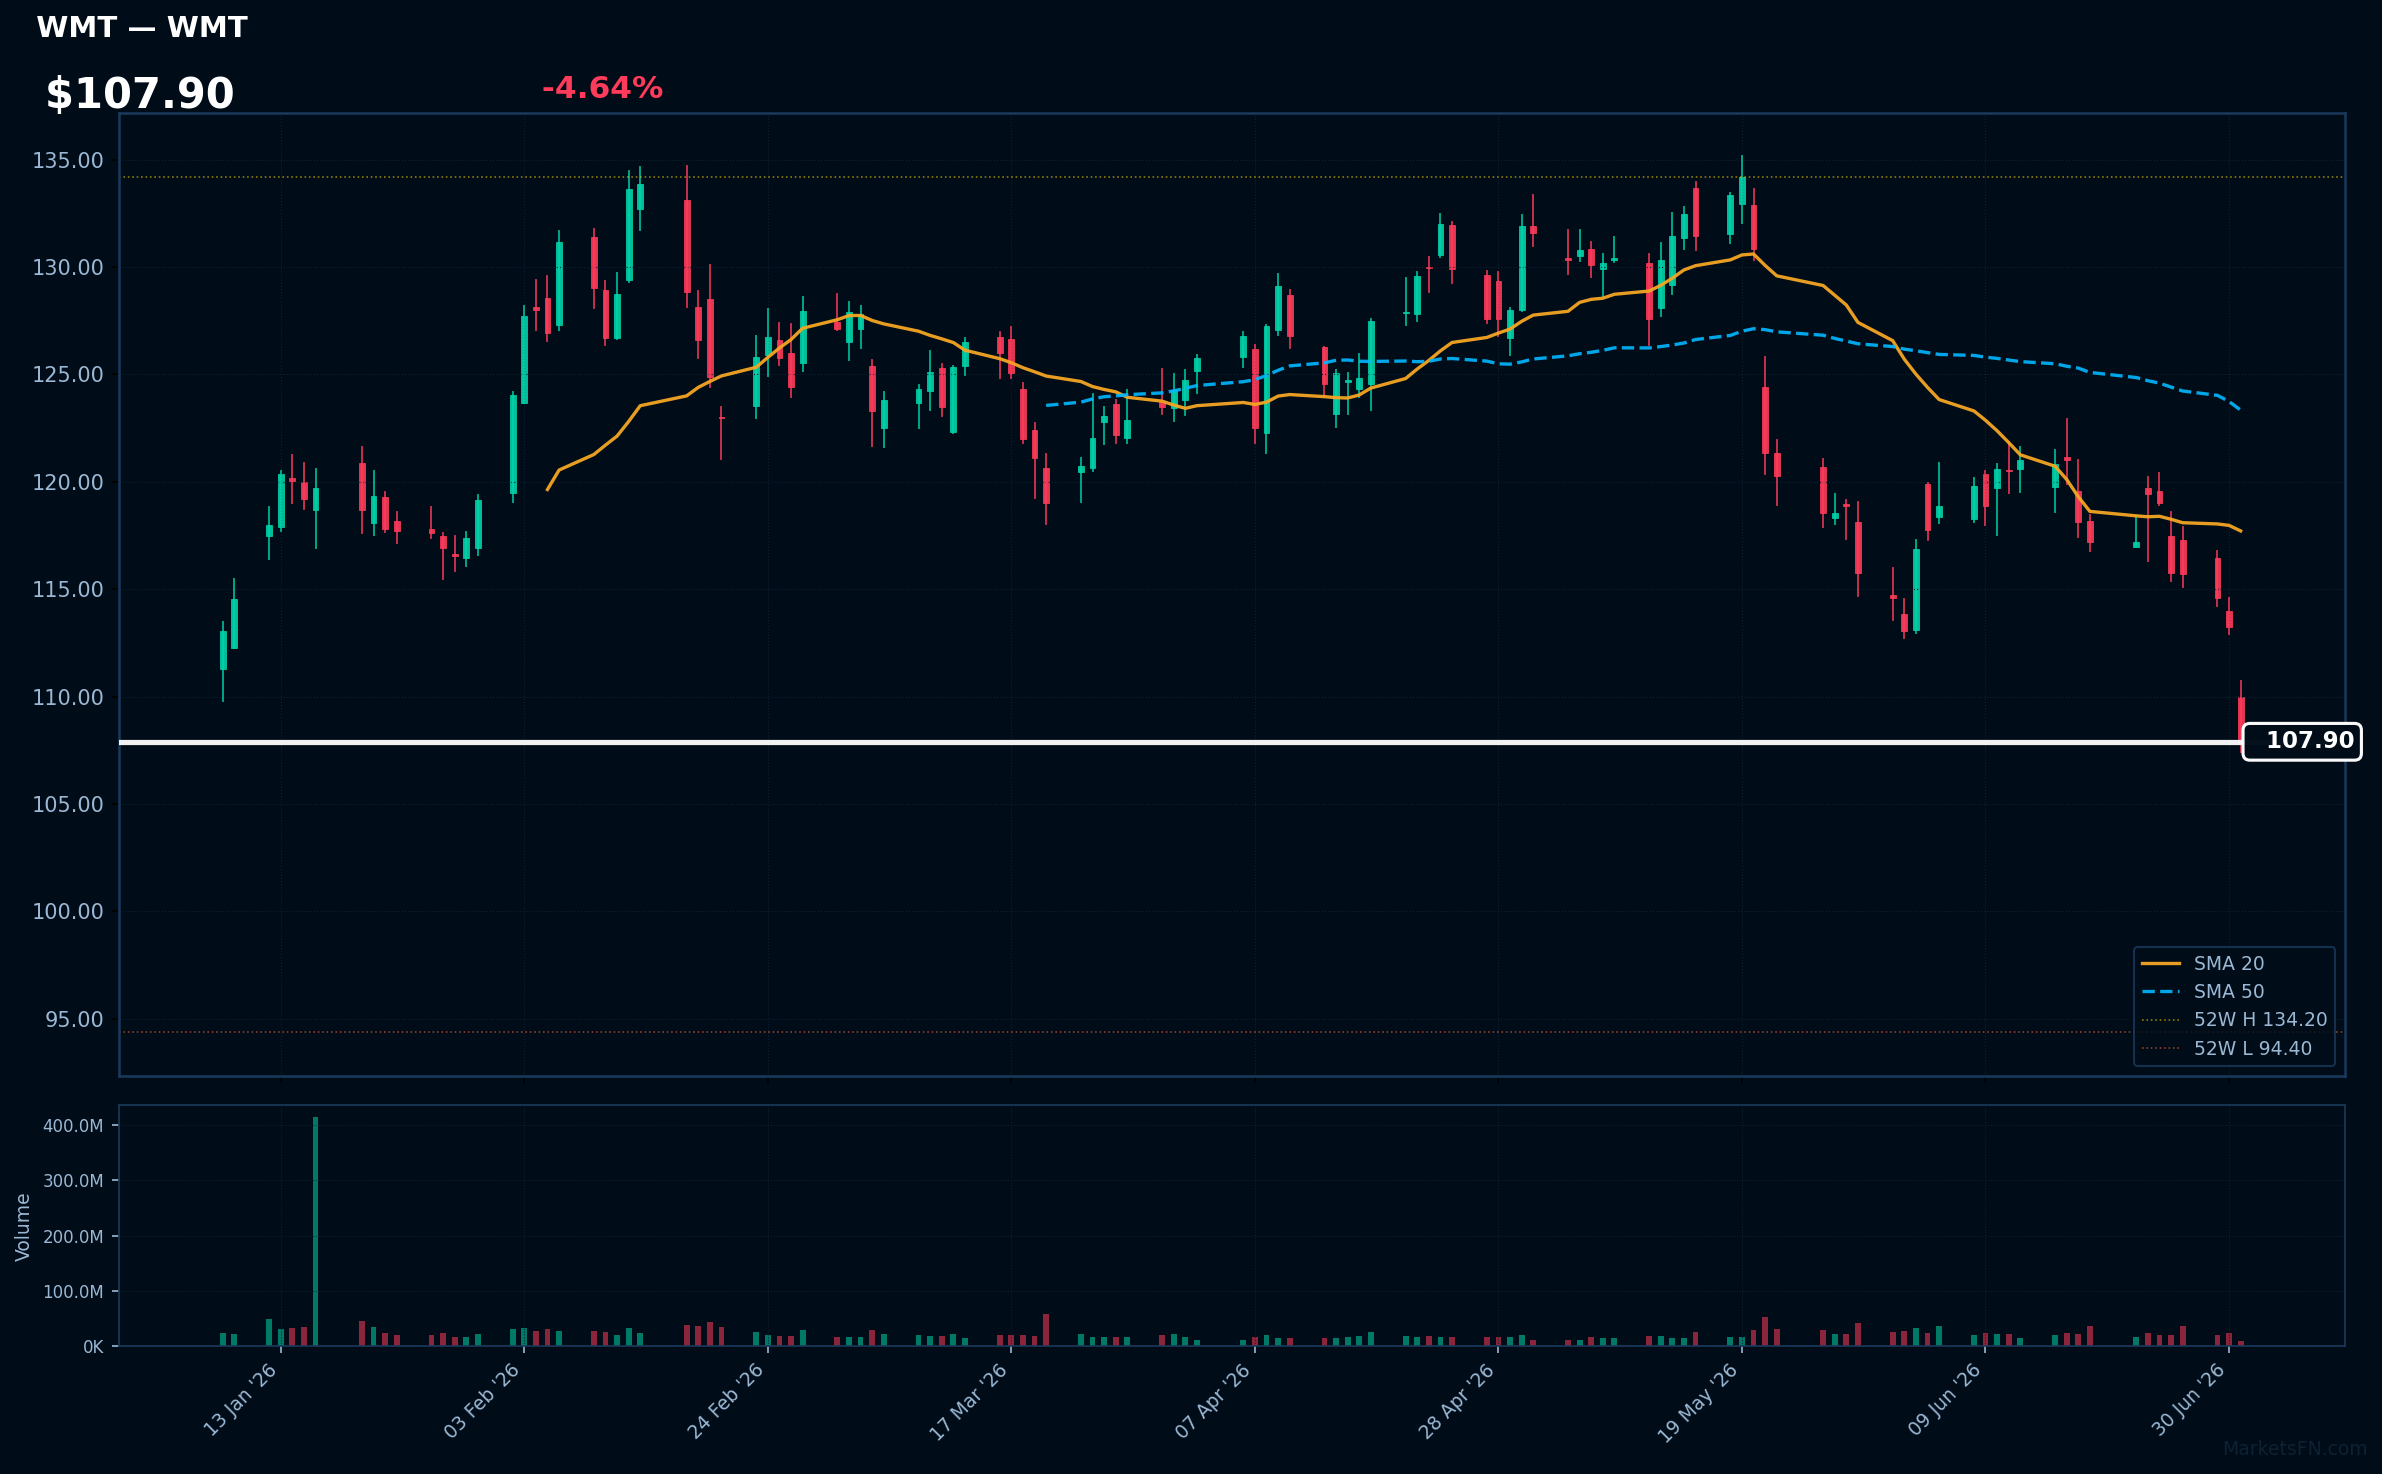
WMT | Walmart Inc | Consumer Defensive | Price: $108.01 | Day: -4.64% | 1W: -9.33% | 1M: -5.85% | RSI: 24.8 | vs MA200: -7.7% | Trend: Below MA20, MA50, MA200
Recent headlines (last 12h)
- Dow's 184-point fall led by losses in Walmart, Caterpillar shares
- Kroger buying regional grocer and pharmacy retailer Giant Eagle in deal valued at $1.65 billion
- Fini backs PE takeover of US candy firm YumEarth
- These Atlanta families named some of America's richest. Who are they?
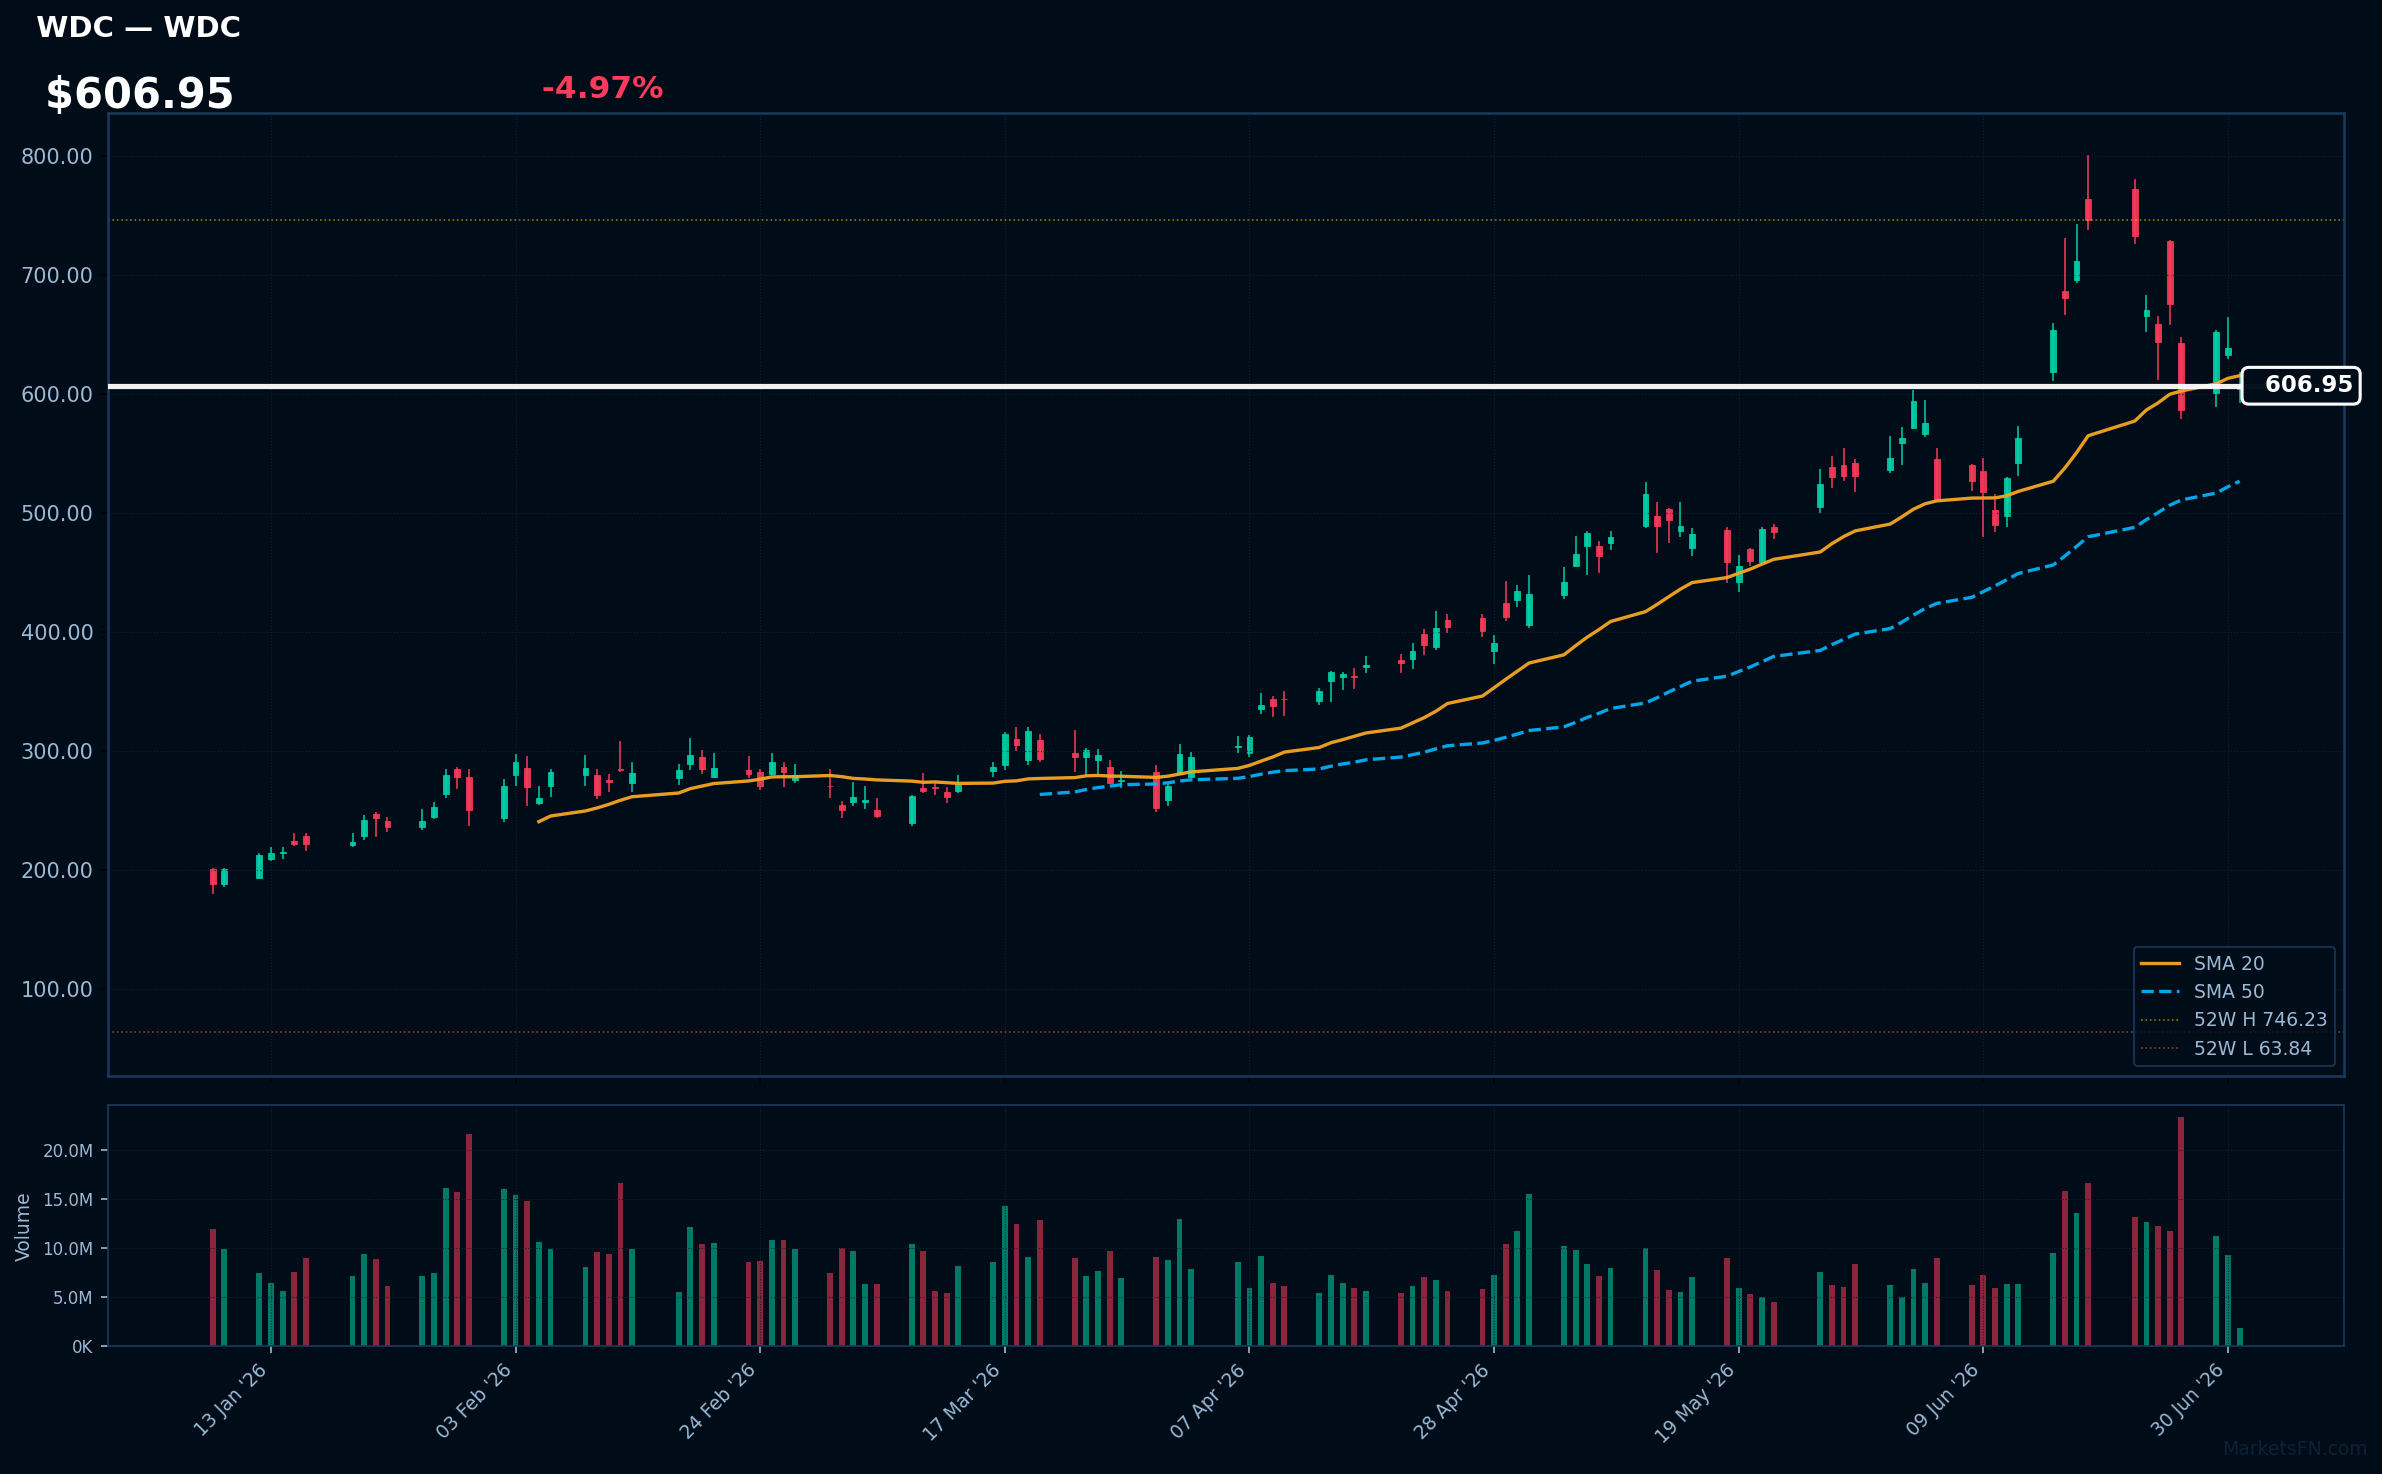
WDC | Western Digital Corp | Technology | Price: $606.96 | Day: -4.97% | 1W: -5.73% | 1M: +11.12% | RSI: 51.4 | vs MA200: +110.4% | Trend: Above MA50, MA200 · Below MA20
Recent headlines (last 12h)
- MU, SNDK, STX, WDC Stocks Slide Premarket: Is The Red-Hot Memory Rally Cooling?
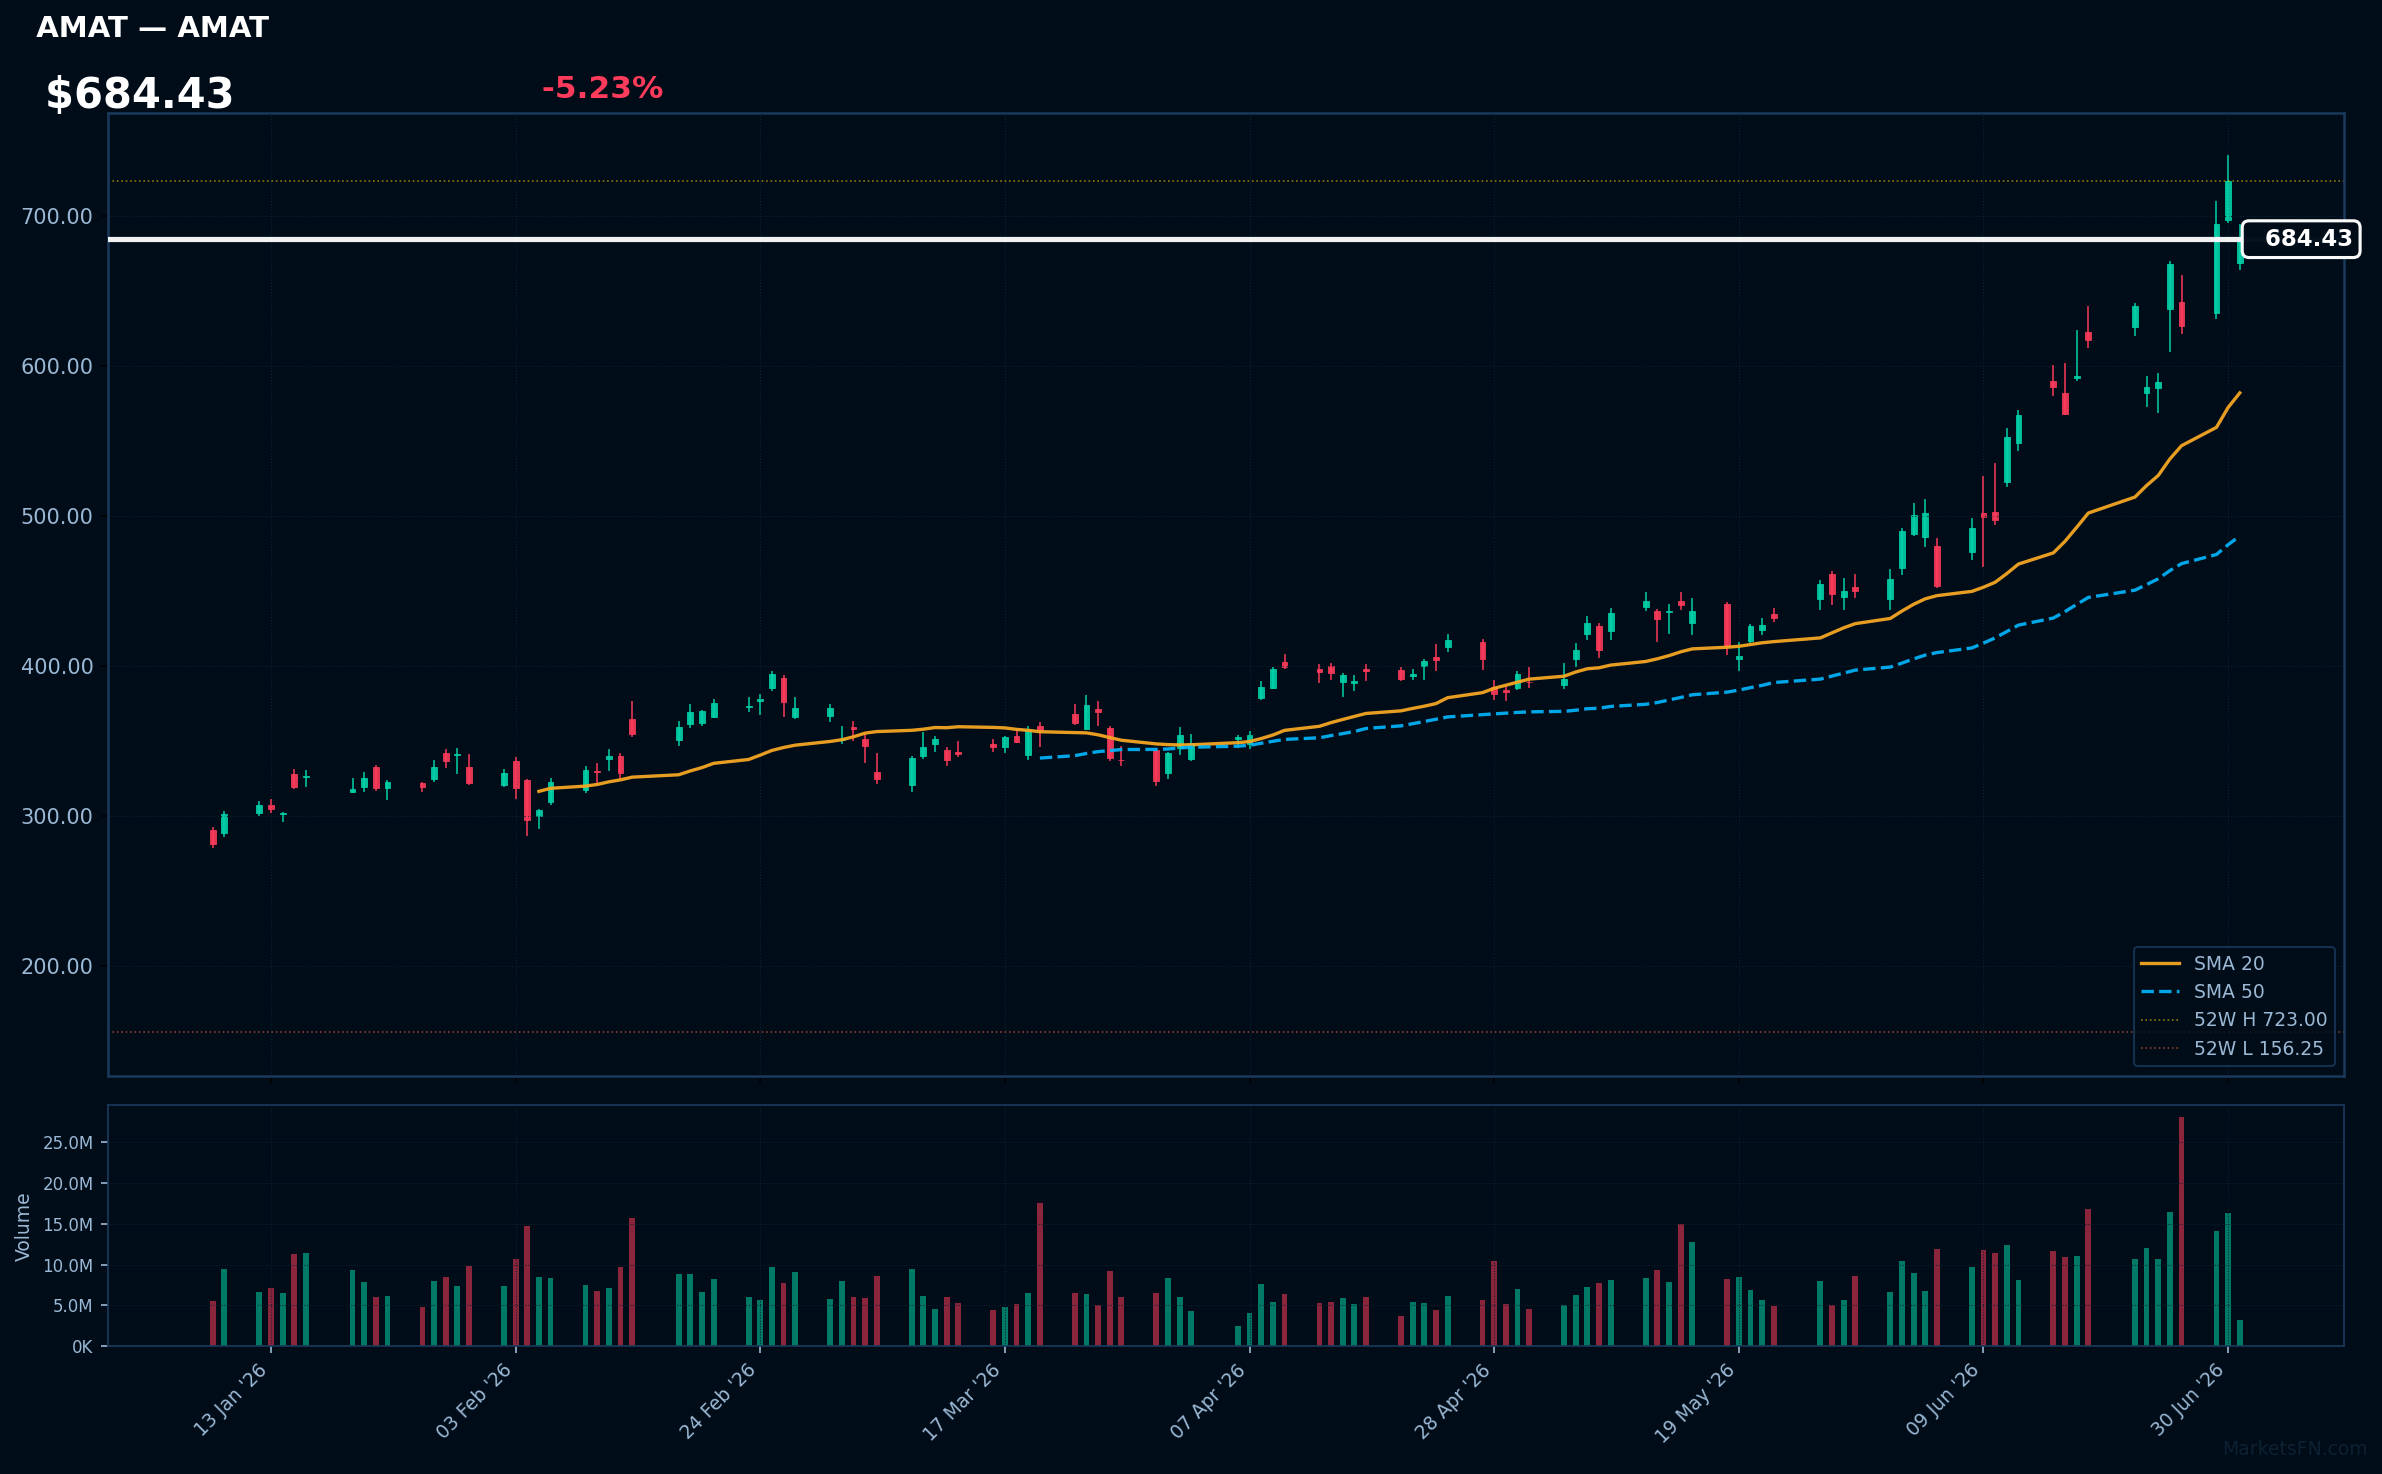
AMAT | Applied Materials Inc | Technology | Price: $685.21 | Day: -5.23% | 1W: +16.21% | 1M: +49.38% | RSI: 65.4 | vs MA200: +103.1% | Trend: Above MA20, MA50, MA200
Recent headlines (last 12h)
- Michael Burry Is Short NVDA, AMAT, SOXX Sees Big Korea Chip Spending As Beginning Of The End
- Wall Street weakens as technology stocks drag indexes lower
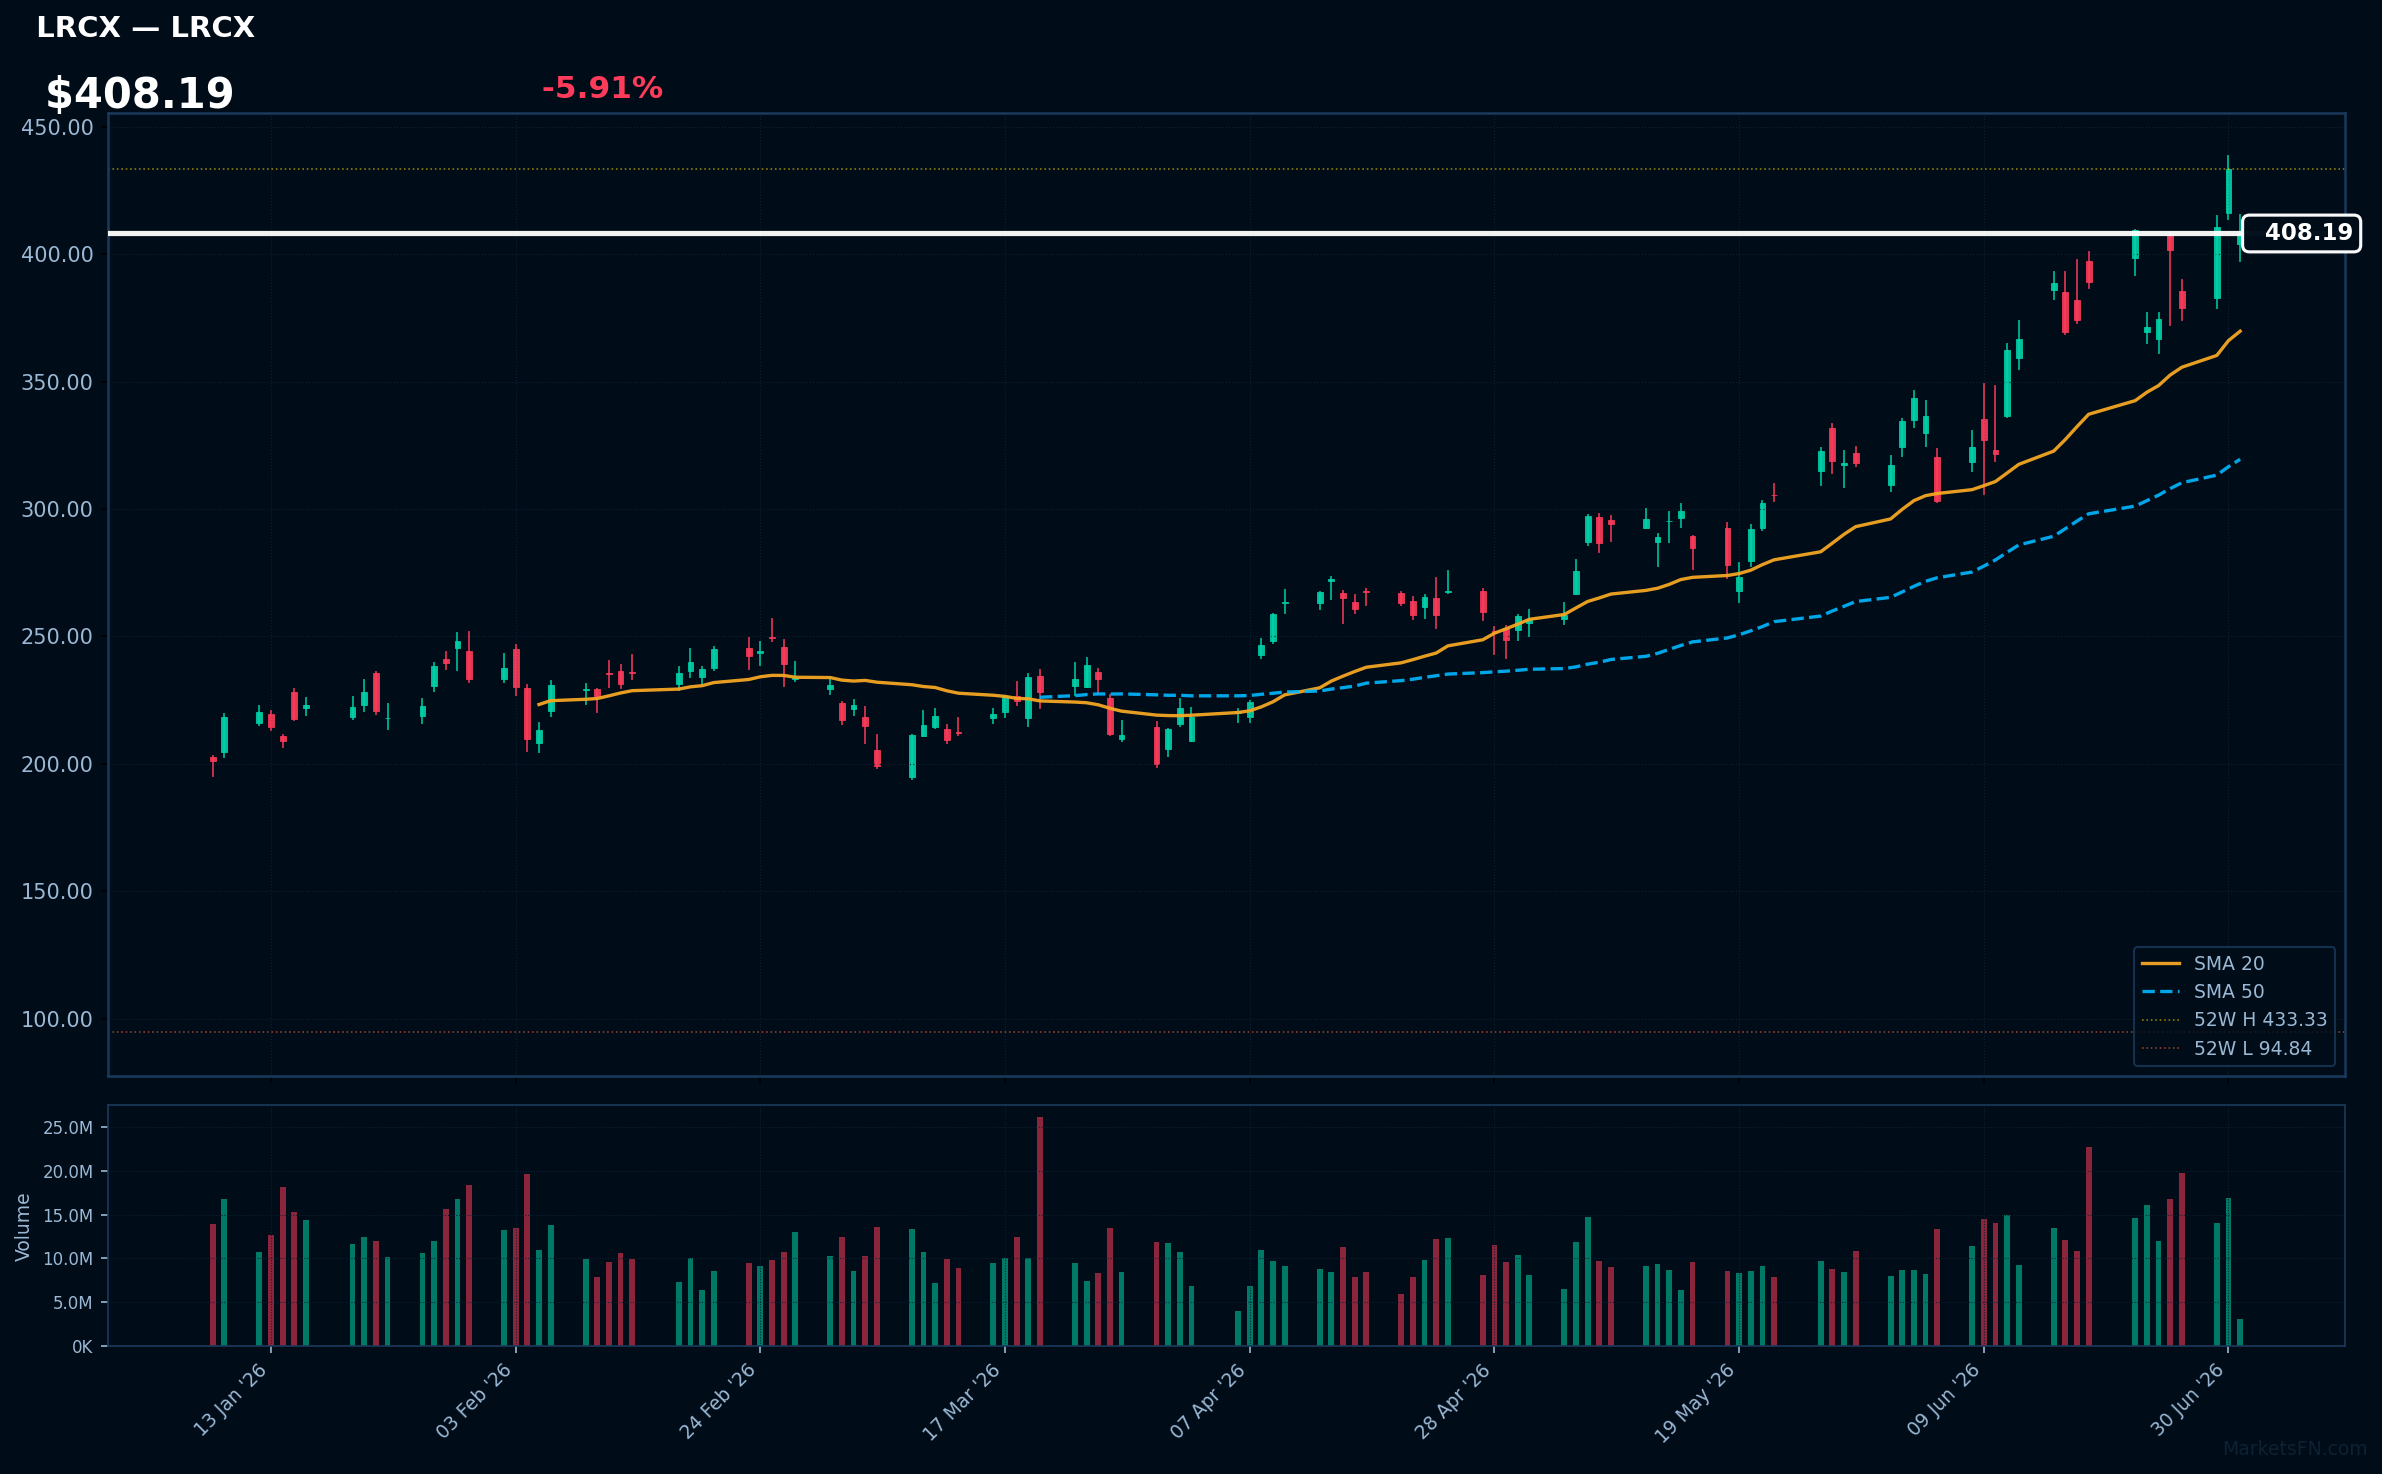
LRCX | Lam Research Corp | Technology | Price: $407.73 | Day: -5.91% | 1W: +8.91% | 1M: +28.72% | RSI: 60.2 | vs MA200: +83.9% | Trend: Above MA20, MA50, MA200
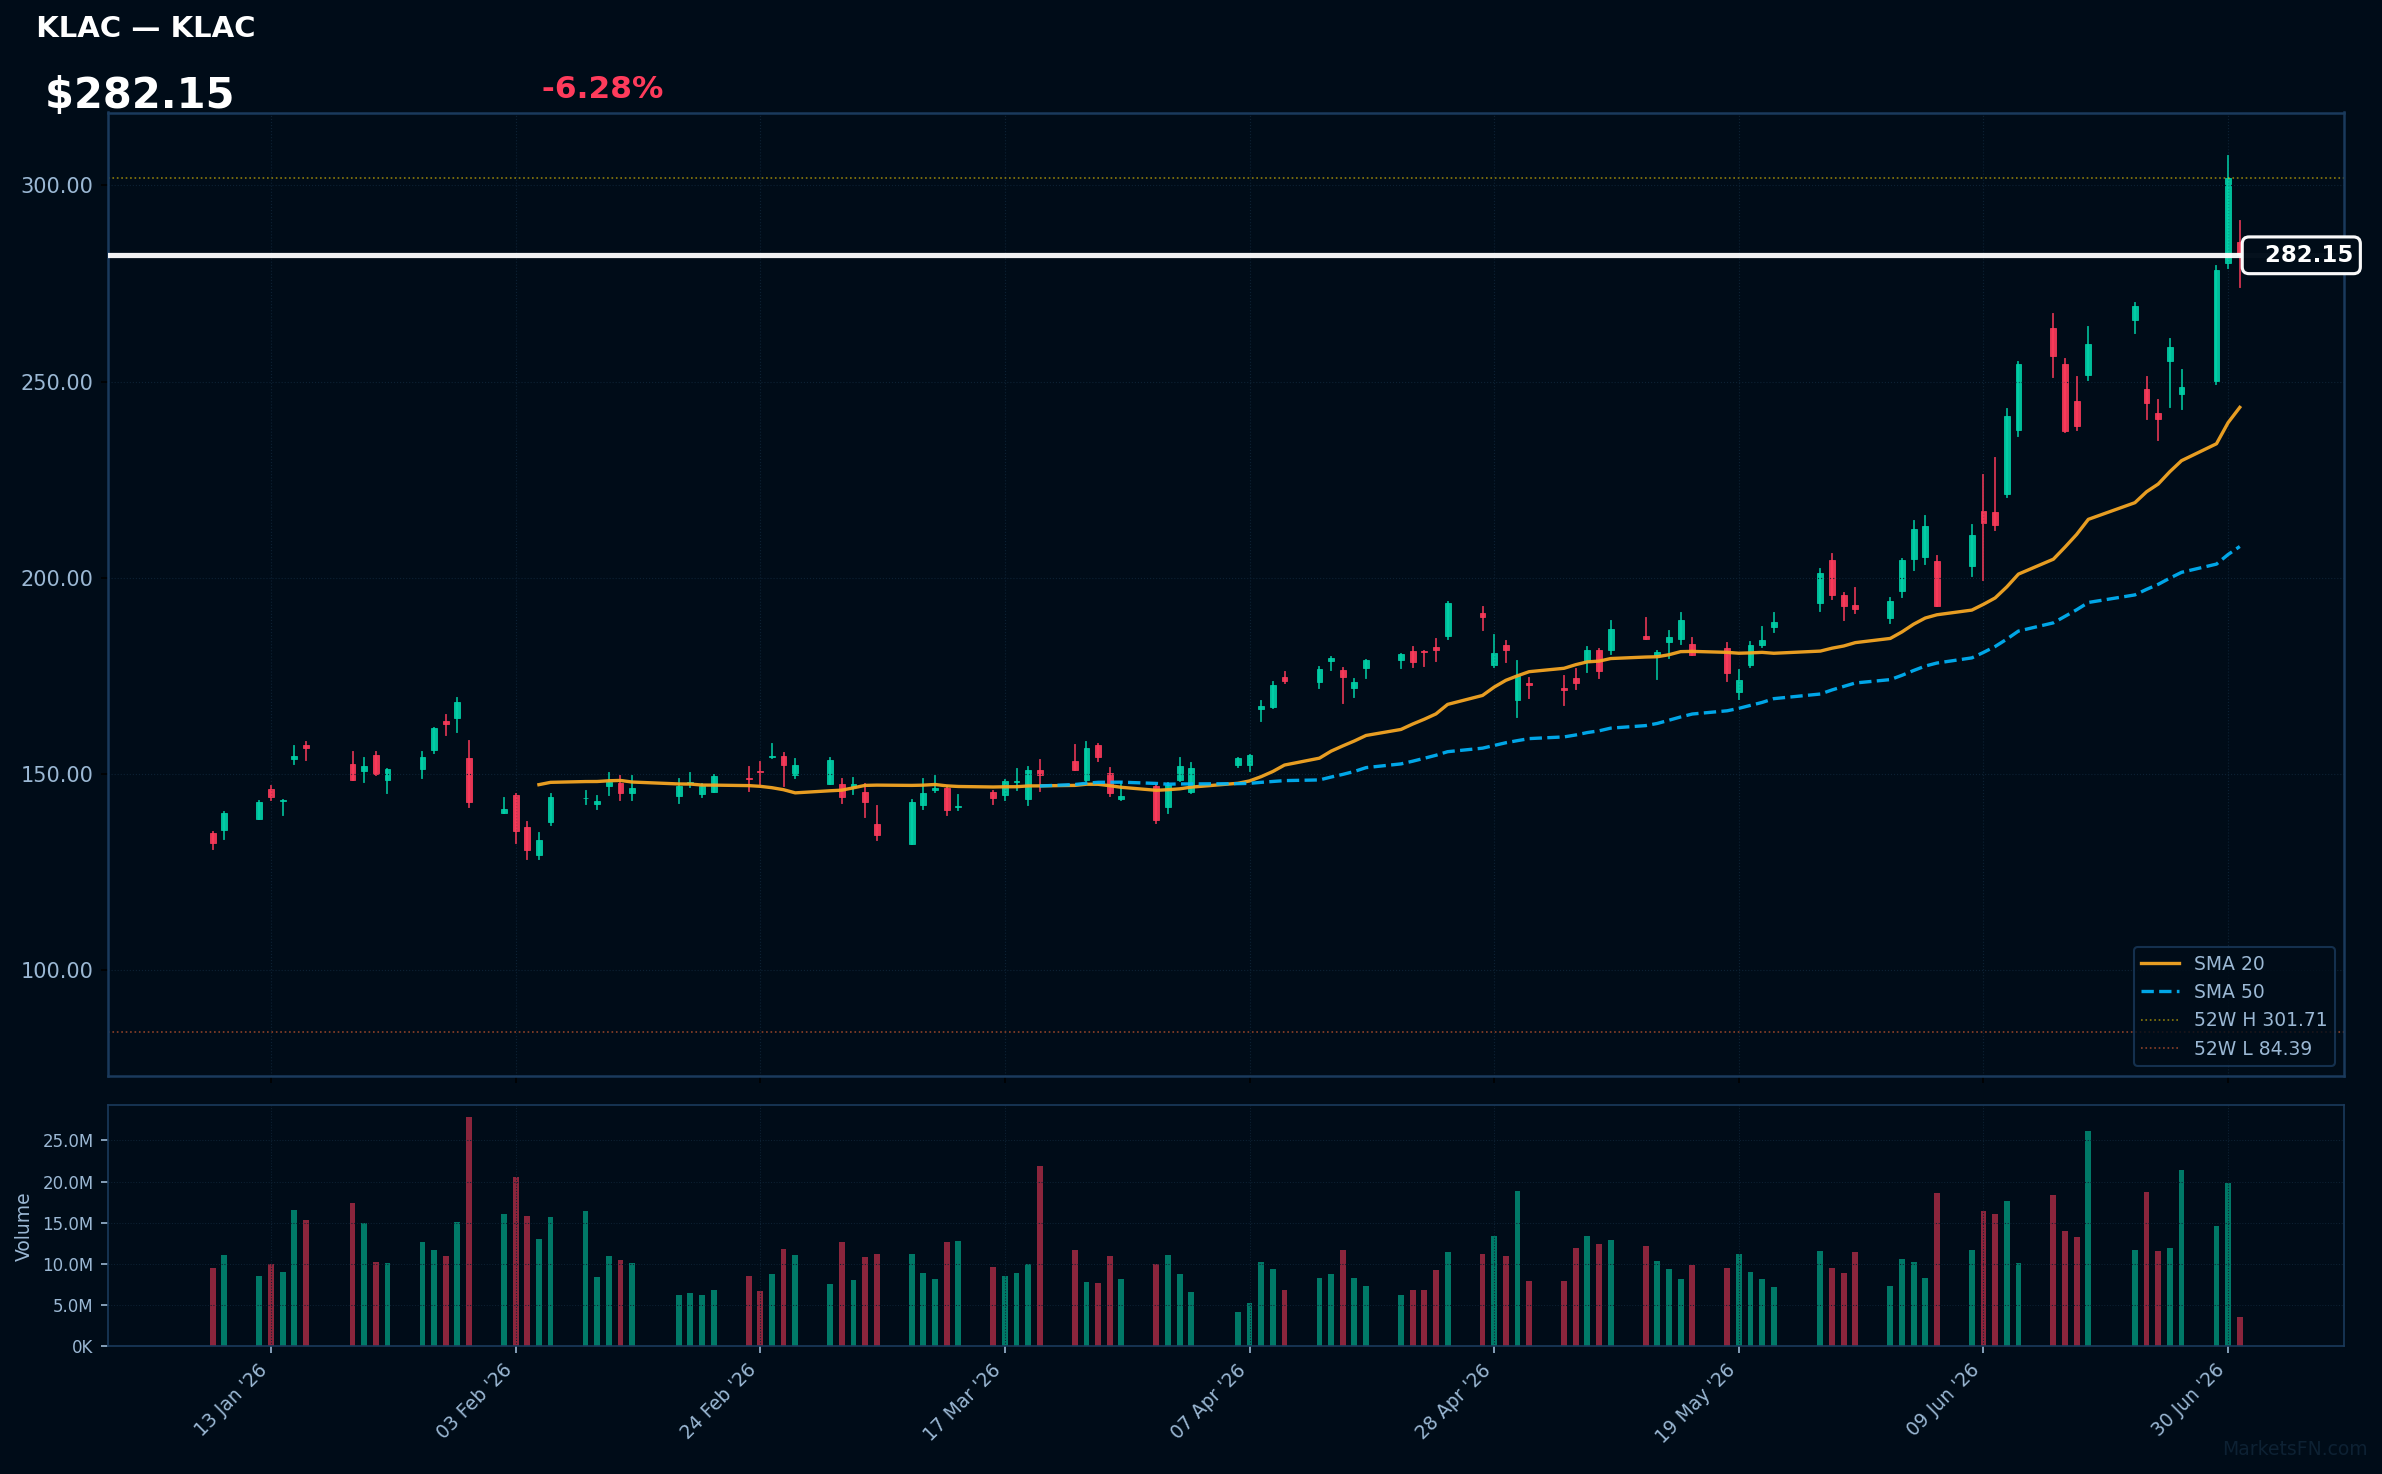
KLAC | KLA Corp | Technology | Price: $282.77 | Day: -6.28% | 1W: +17.33% | 1M: +45.44% | RSI: 63.2 | vs MA200: +86.8% | Trend: Above MA20, MA50, MA200
MU | Micron Technology Inc | Technology | Price: $1078.71 | Day: -6.55% | 1W: +3.04% | 1M: +4.33% | RSI: 54.7 | vs MA200: +144.9% | Trend: Above MA20, MA50, MA200
Recent headlines (last 12h)
- Dow falls 184 points as chip stocks pull back after record H1
- Scared of an AI stock bubble? Then don't look at this chart.
- General Motors shares rise after securing long-term Micron chip supply
- Almost 100% of the Nasdaq-100's gains in the first half of 2026 came from just 10 stocks
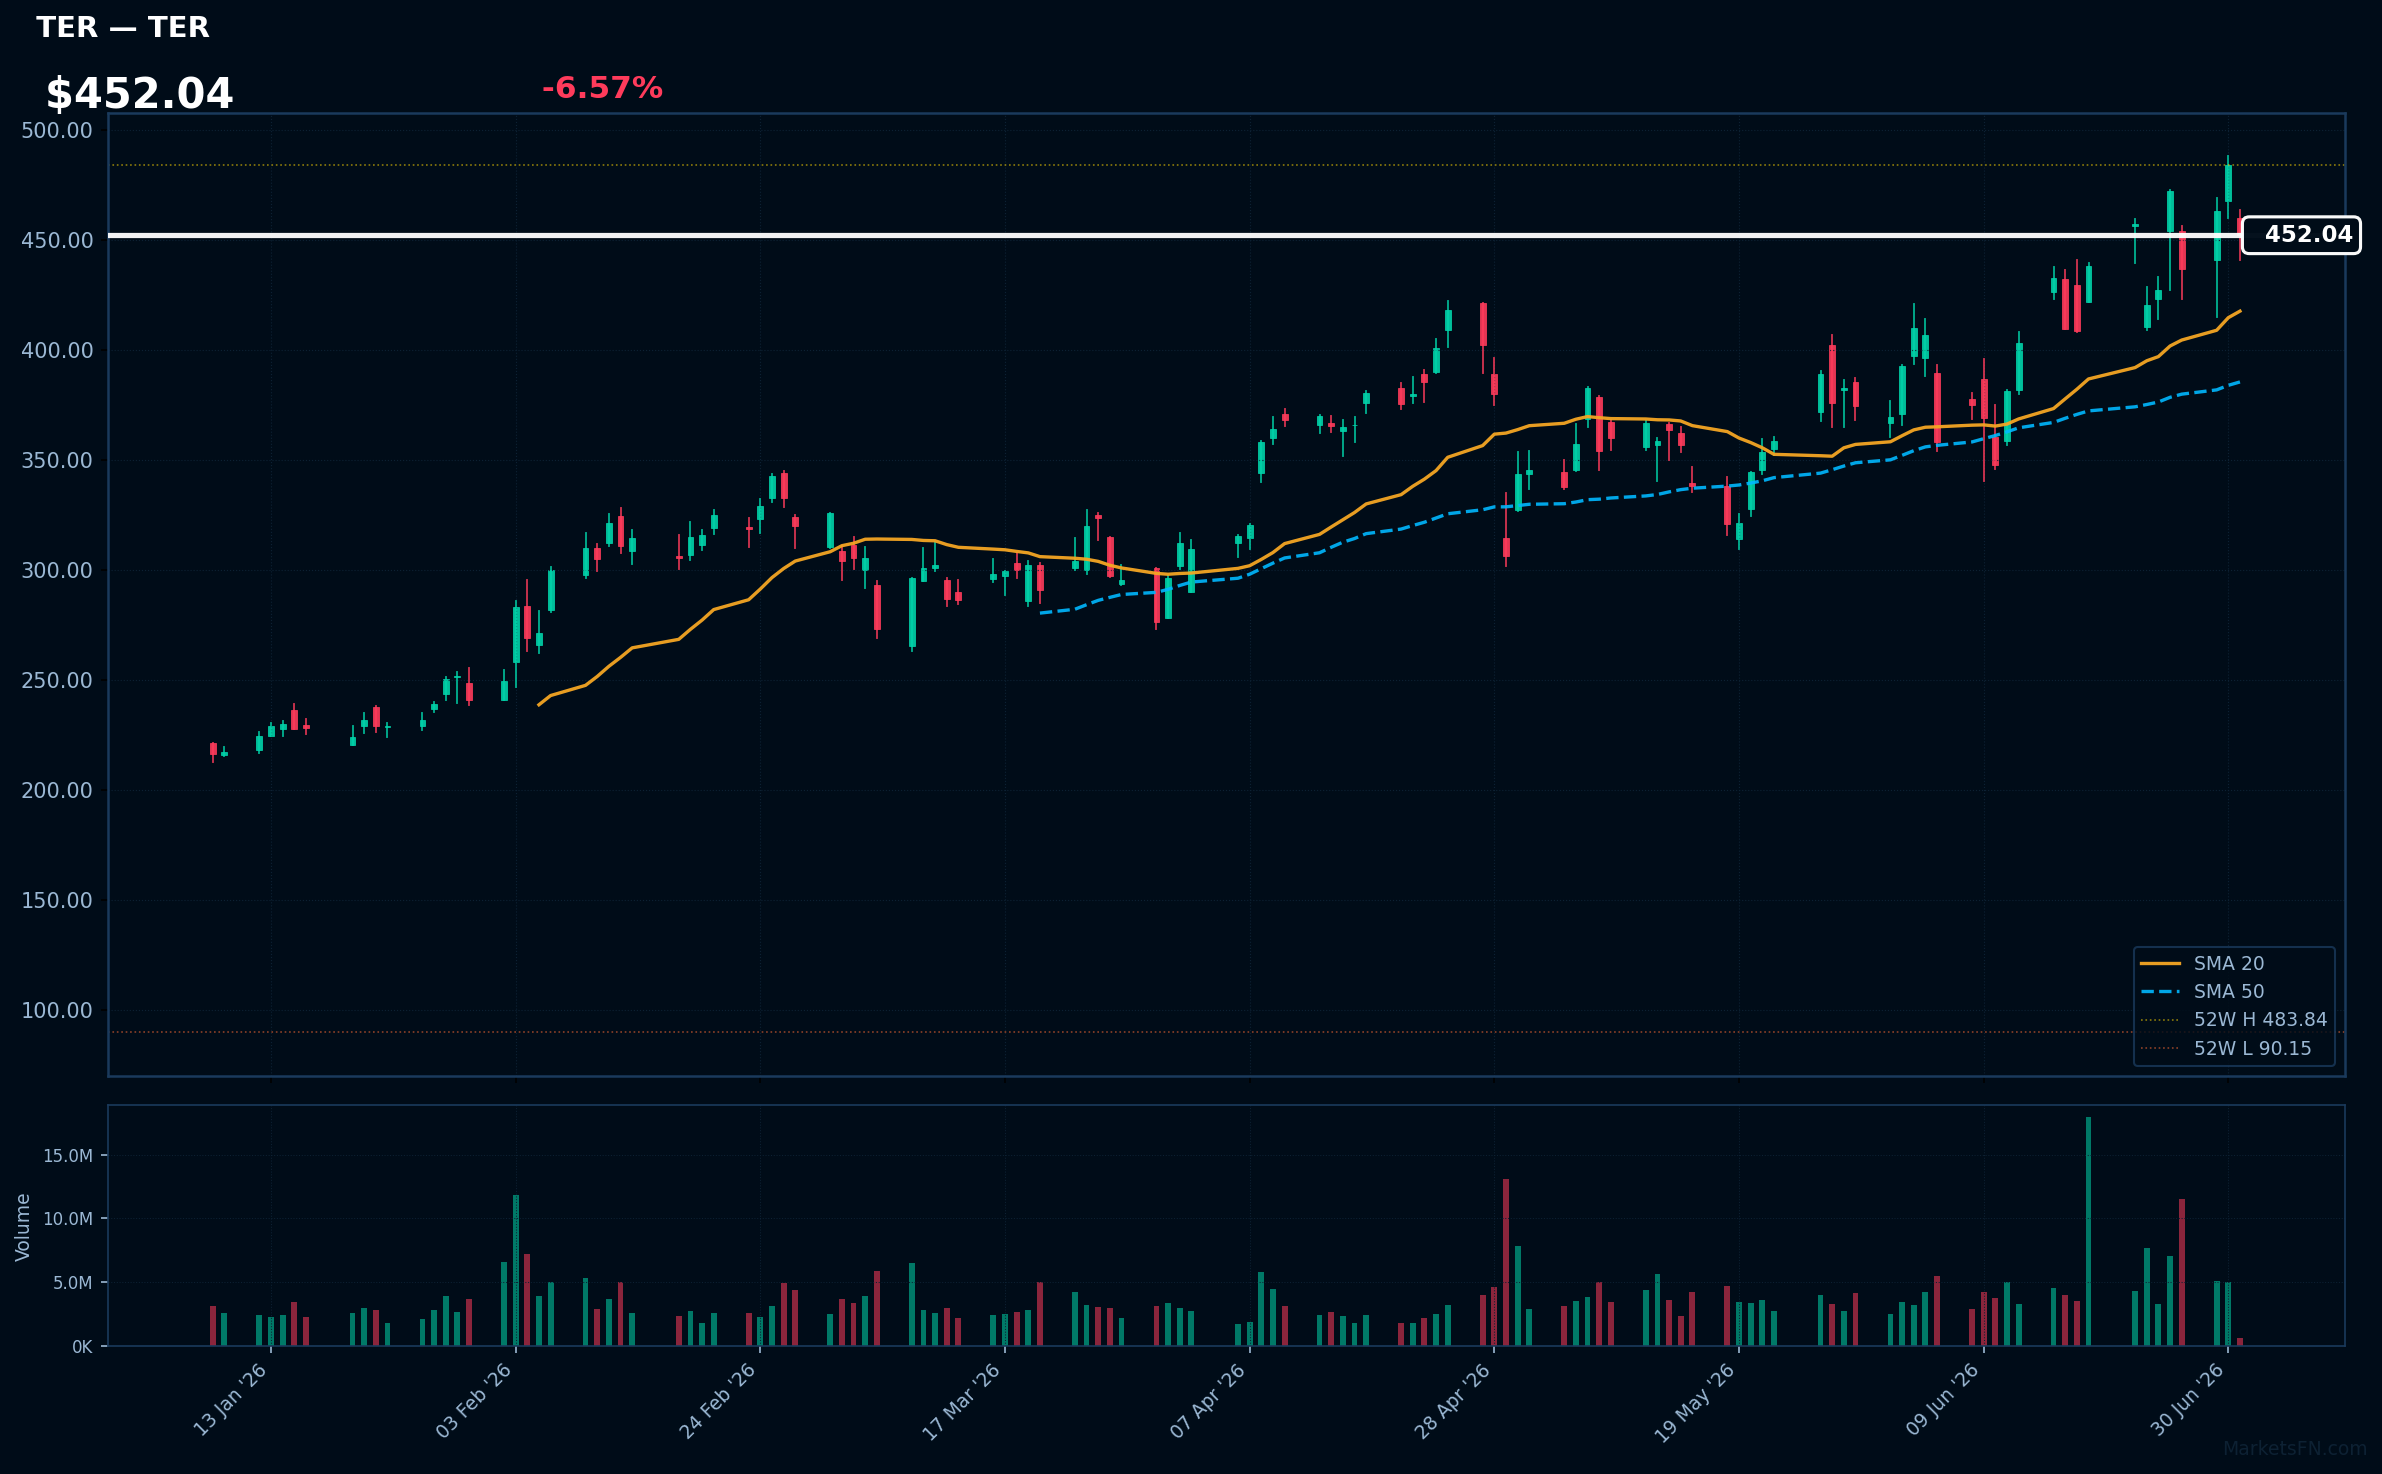
TER | Teradyne, Inc | Technology | Price: $452.04 | Day: -6.57% | 1W: +5.81% | 1M: +22.35% | RSI: 56.4 | vs MA200: +69.4% | Trend: Above MA20, MA50, MA200
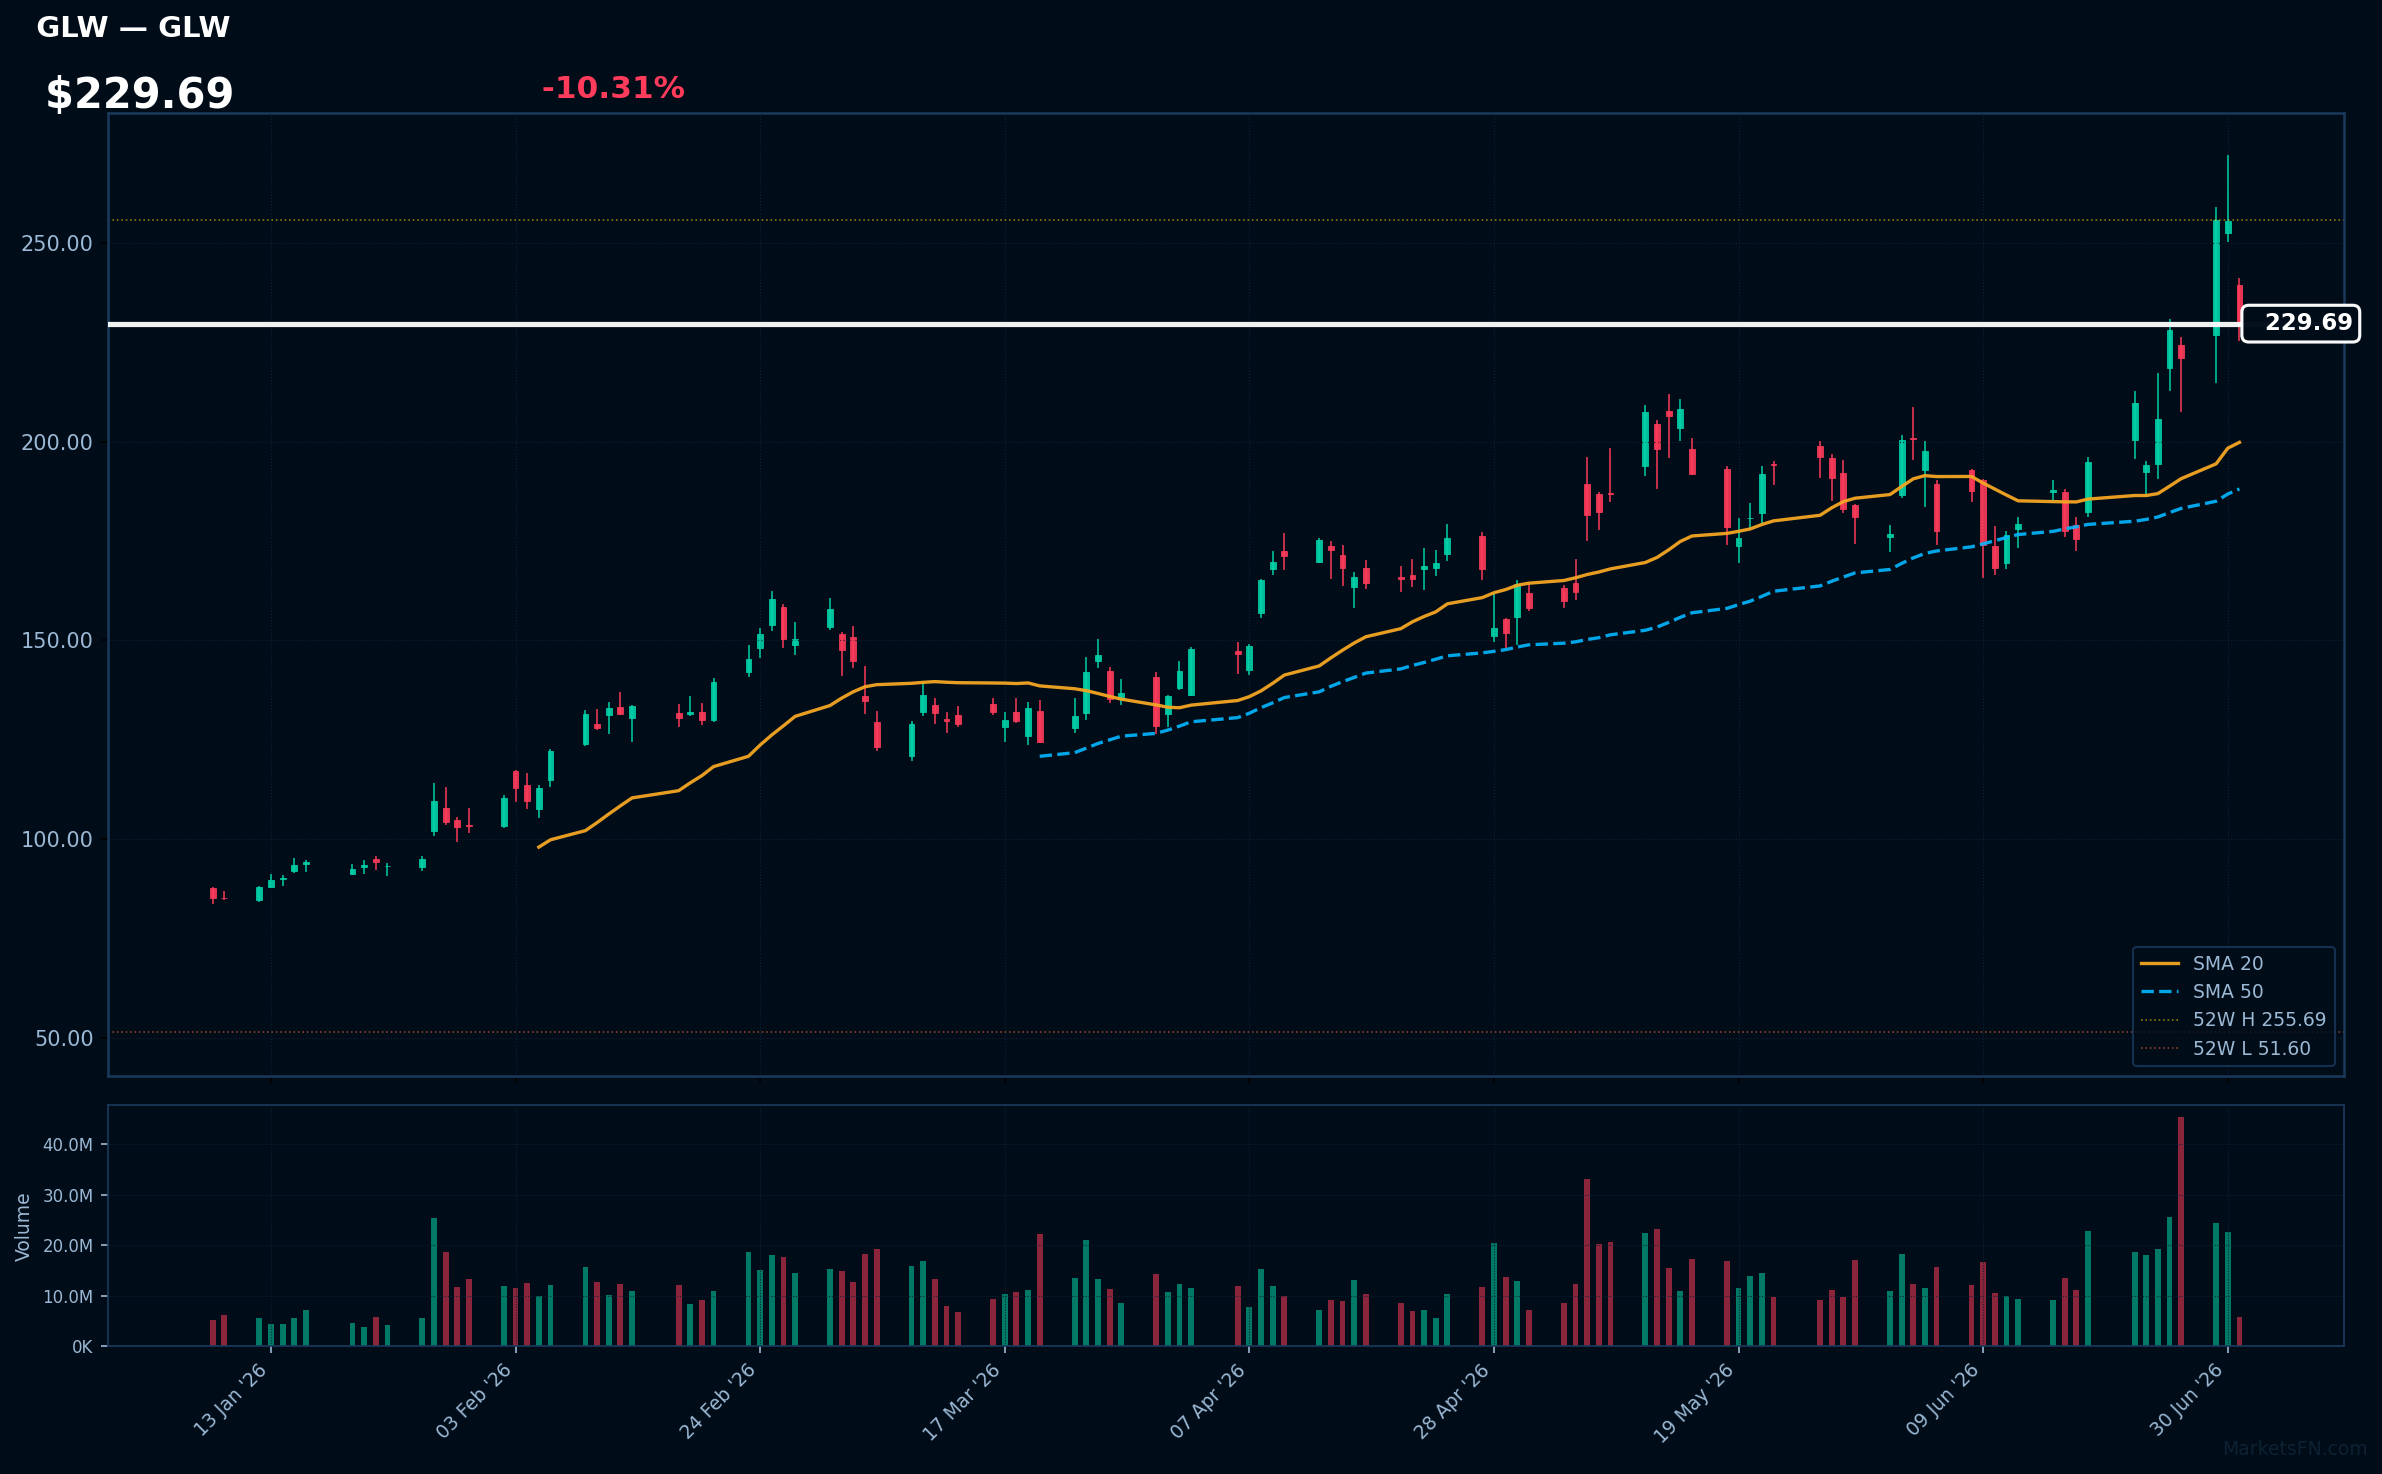
GLW | Corning, Inc | Technology | Price: $229.09 | Day: -10.31% | 1W: +11.59% | 1M: +29.99% | RSI: 58.6 | vs MA200: +80.9% | Trend: Above MA20, MA50, MA200
Market Commentary
The S&P 500's July 01, 2026 session saw broad-based gains, with 67.1% of constituents advancing and a +0.64% average daily change, indicating a positive tone. The advance-decline ratio suggests a healthy rally with 333 stocks rising against 160 declining.
Sector rotation is evident in the top gainers and losers. Financial, Communication Services, and Technology stocks led gains, with CRWD, META, and PLTR among the top 10. Conversely, Technology and Consumer Defensive stocks dominated the laggards, with STX, INTC, and WMT losing ground. This rotation may indicate a shift in investor sentiment towards growth-oriented sectors.
Traders should monitor the 200-day moving average, as only 2.2% of stocks are currently trading above it. A sustained move above this level could signal further upside, while a failure to break through may lead to a retest of recent support levels. The next key catalyst will be the upcoming earnings season, which may validate or invalidate the current sector rotation trend.
Methodology
Daily ranking uses the latest session close versus the prior close. RSI (14-day EWM), MA20, MA50, and MA200 are computed from 12 months of daily OHLCV data sourced from Yahoo Finance. Charts show the last 120 trading sessions with SMA 20/50, 52-week H/L markers, and volume. Recent news (last 12 h) is sourced from FinViz. Updated every trading day.
Disclaimer
The content on MarketsFN.com is provided for educational and informational purposes only. It does not constitute financial advice, investment recommendations, or trading guidance. All investments involve risks, and past performance does not guarantee future results. You are solely responsible for your investment decisions and should conduct independent research and consult a qualified financial advisor before acting. MarketsFN.com and its authors are not liable for any losses or damages arising from your use of this information.
Related Articles
- Nasdaq 100 52-Week Highs & Lows Radar: Palo Alto Networks (PANW), Constellation Energyoration (CEG) and more — Nasdaq 100 stocks nearest to their 52-week high and low. Bloomberg-style charts, RSI/MA analysis and Grok commentary.
- S&P 500 52-Week Highs & Lows Radar: GE Aerospace (GE), Constellation Energyoration (CEG) and more — S&P 500 stocks nearest to their 52-week high and low. Bloomberg-style charts, RSI/MA analysis and Grok commentary.
- Nasdaq 100 2026 YTD Highs & Lows Radar: ASML Holding NV (ASML), T-Mobile US (TMUS) and more — Nasdaq 100 stocks nearest to their 2026 year-to-date high and low. Bloomberg-style charts, RSI/MA analysis and Grok…
- S&P 500 2026 YTD Highs & Lows Radar: GE Aerospace (GE), T-Mobile US (TMUS) and more — S&P 500 stocks nearest to their 2026 year-to-date high and low. Bloomberg-style charts, RSI/MA analysis and Grok…
- UniFirst Corporation (UNF) Q3 2026 Financial Results Summary — UniFirst Corporation (UNF) Q3 2026: Revenue Growth Amid Profit Decline — Disappointing Quarter for Shareholders…