S&P 500 2026 YTD Highs & Lows Radar: GE Aerospace (GE), T-Mobile US (TMUS) and more
· Stocks · MarketsFN Team
S&P 500 2026 YTD Highs & Lows Radar: GE Aerospace (GE), T-Mobile US (TMUS) and more
Screening all 503 S&P 500 constituents for stocks nearest to their 2026 year-to-date high and their 2026 YTD low. Data as of July 01, 2026. % Realized = total return since Jan 1 2026.
Legend: RSI > 70 = overbought · RSI < 30 = oversold · Green % Realized = positive YTD return · Red = negative.
📈 Nearest to 2026 High
Sectors represented: Industrials (3), Technology (2)
| Ticker | Company | Sector | Price Last | % Realized | 2026 YTD High Date | RSI | % above MA200 | Trend |
|---|---|---|---|---|---|---|---|---|
| GE | GE Aerospace | Industrials | $373.73 | +16.52% | 2026-06-30 | 73.7 | +21.0% | Above MA20, MA50, MA200 |
| AMD | Advanced Micro Devices Inc | Technology | $580.91 | +159.95% | 2026-06-30 | 58.8 | +110.1% | Above MA20, MA50, MA200 |
| CAT | Caterpillar Inc | Industrials | $1064.90 | +77.95% | 2026-06-30 | 57.4 | +53.4% | Above MA20, MA50, MA200 |
| GEV | GE Vernova Inc | Industrials | $1174.86 | +72.89% | 2026-06-30 | 58.2 | +48.3% | Above MA20, MA50, MA200 |
| APH | Amphenol Corp | Technology | $176.32 | +26.20% | 2026-06-30 | 62.6 | +27.2% | Above MA20, MA50, MA200 |
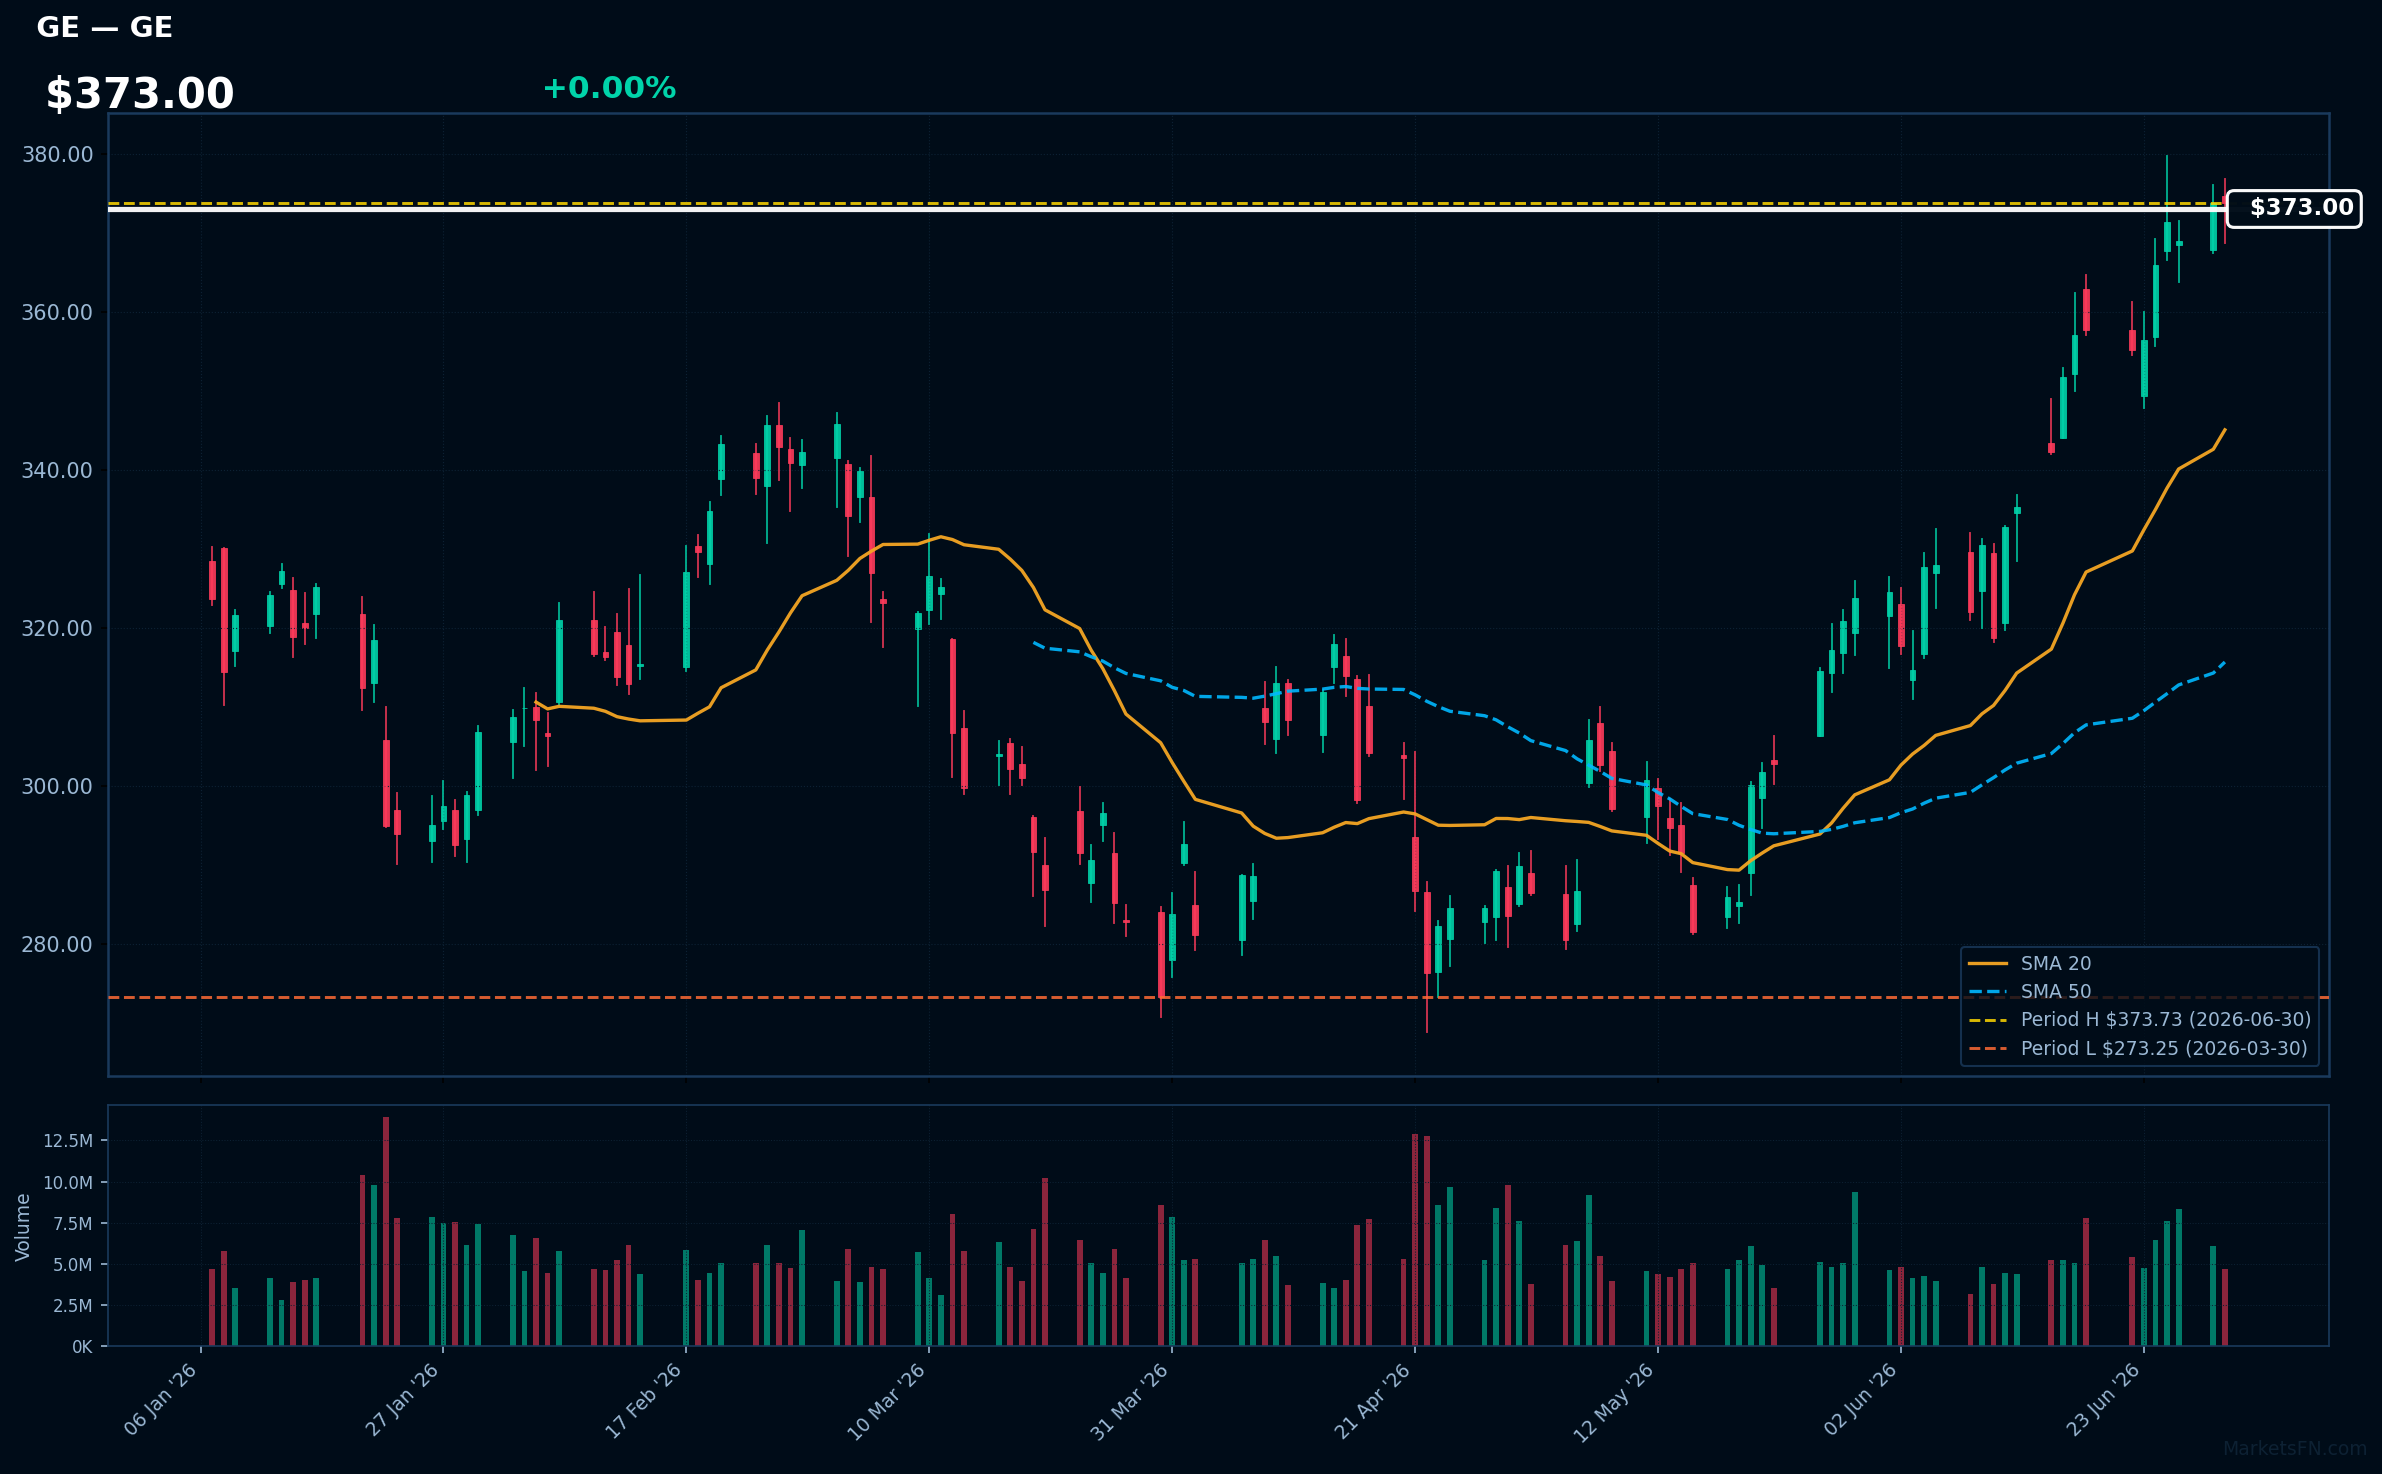
GE | GE Aerospace | Industrials | Price Last: $373.73 | % Realized: +16.52% | RSI: 73.7 | % above MA200: +21.0% | Trend: Above MA20, MA50, MA200
GE Aerospace is a leader in the aerospace industry, manufacturing commercial and military jet engines, and other aircraft components. Investors should care about its technological advancements and market share in the growing aviation sector.
GE Aerospace's RSI(14) is 73.7, indicating strong momentum as it's nearing overbought territory. The MA alignment (price > MA20 > MA50 > MA200) confirms a sustained uptrend, with the stock at 0.0% below its 2026 YTD high.
Related headlines
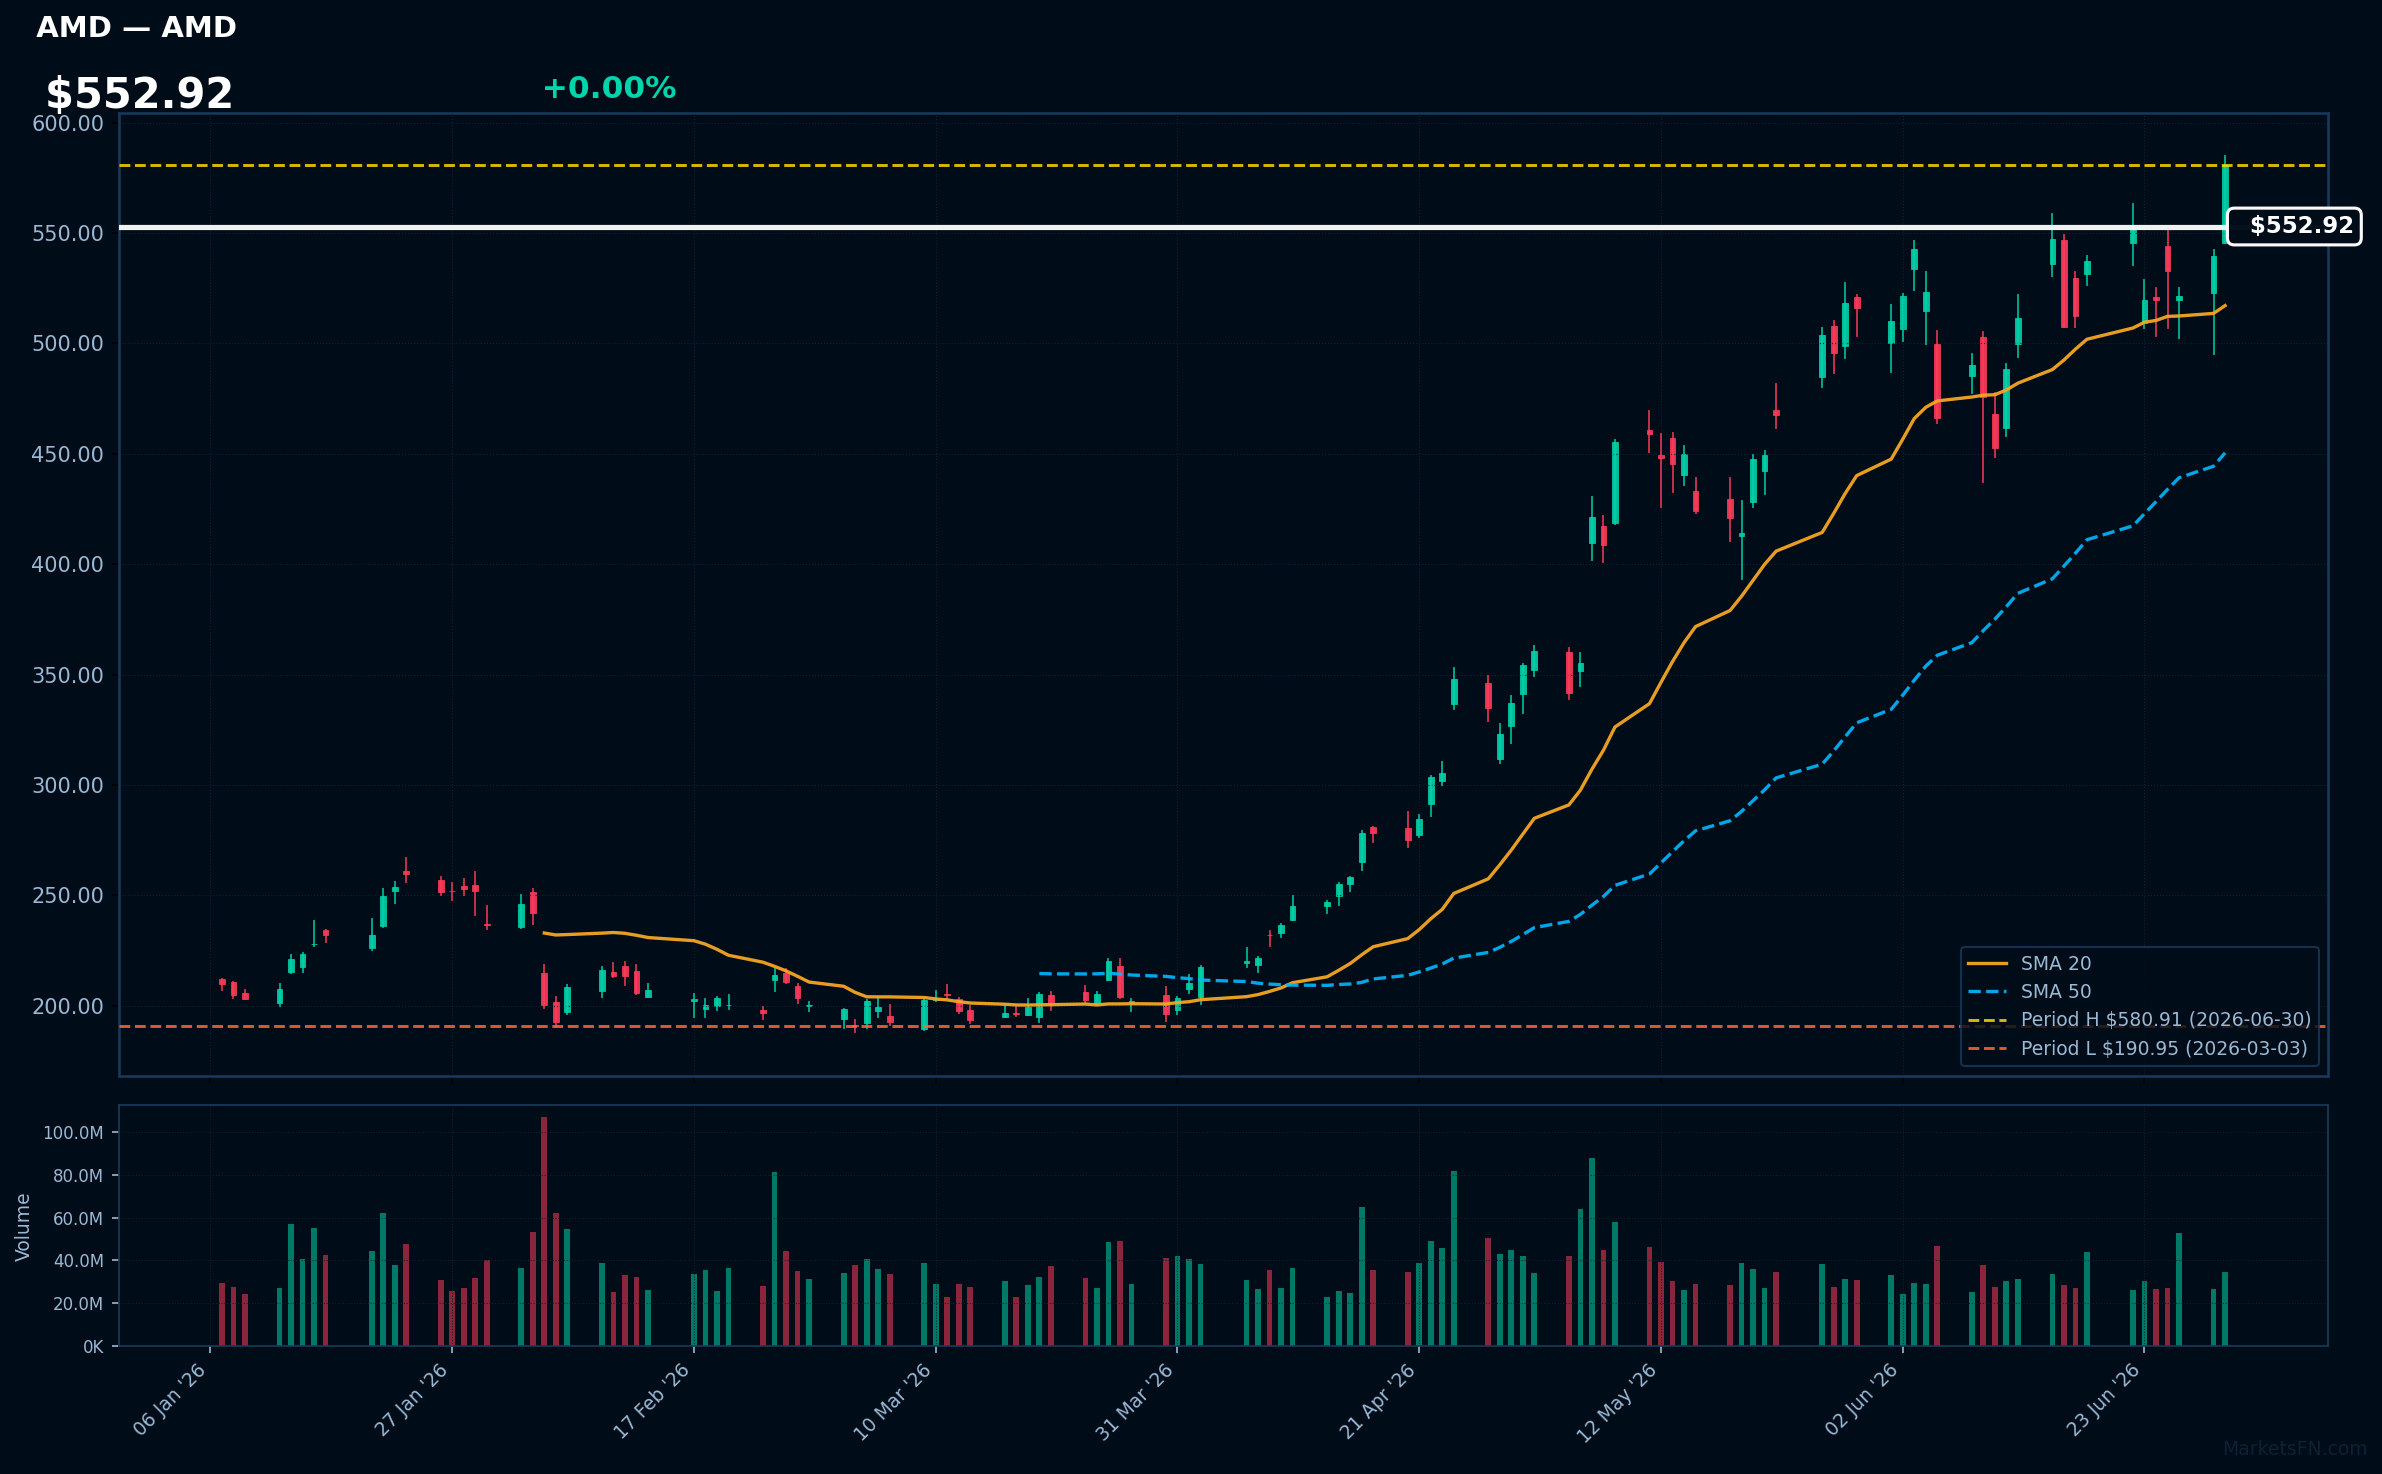
AMD | Advanced Micro Devices Inc | Technology | Price Last: $580.91 | % Realized: +159.95% | RSI: 58.8 | % above MA200: +110.1% | Trend: Above MA20, MA50, MA200
Advanced Micro Devices Inc (AMD) designs and manufactures high-performance CPUs, GPUs, and other semiconductor products crucial for gaming PCs, data centers, and AI applications, making it a key player in the rapidly growing tech industry.
AMD's current technical situation indicates sustained uptrend momentum with price > MA20 > MA50 > MA200, RSI(14) at 58.8, and 0.0% below its 2026 YTD high, suggesting potential for further breakout.
Related headlines
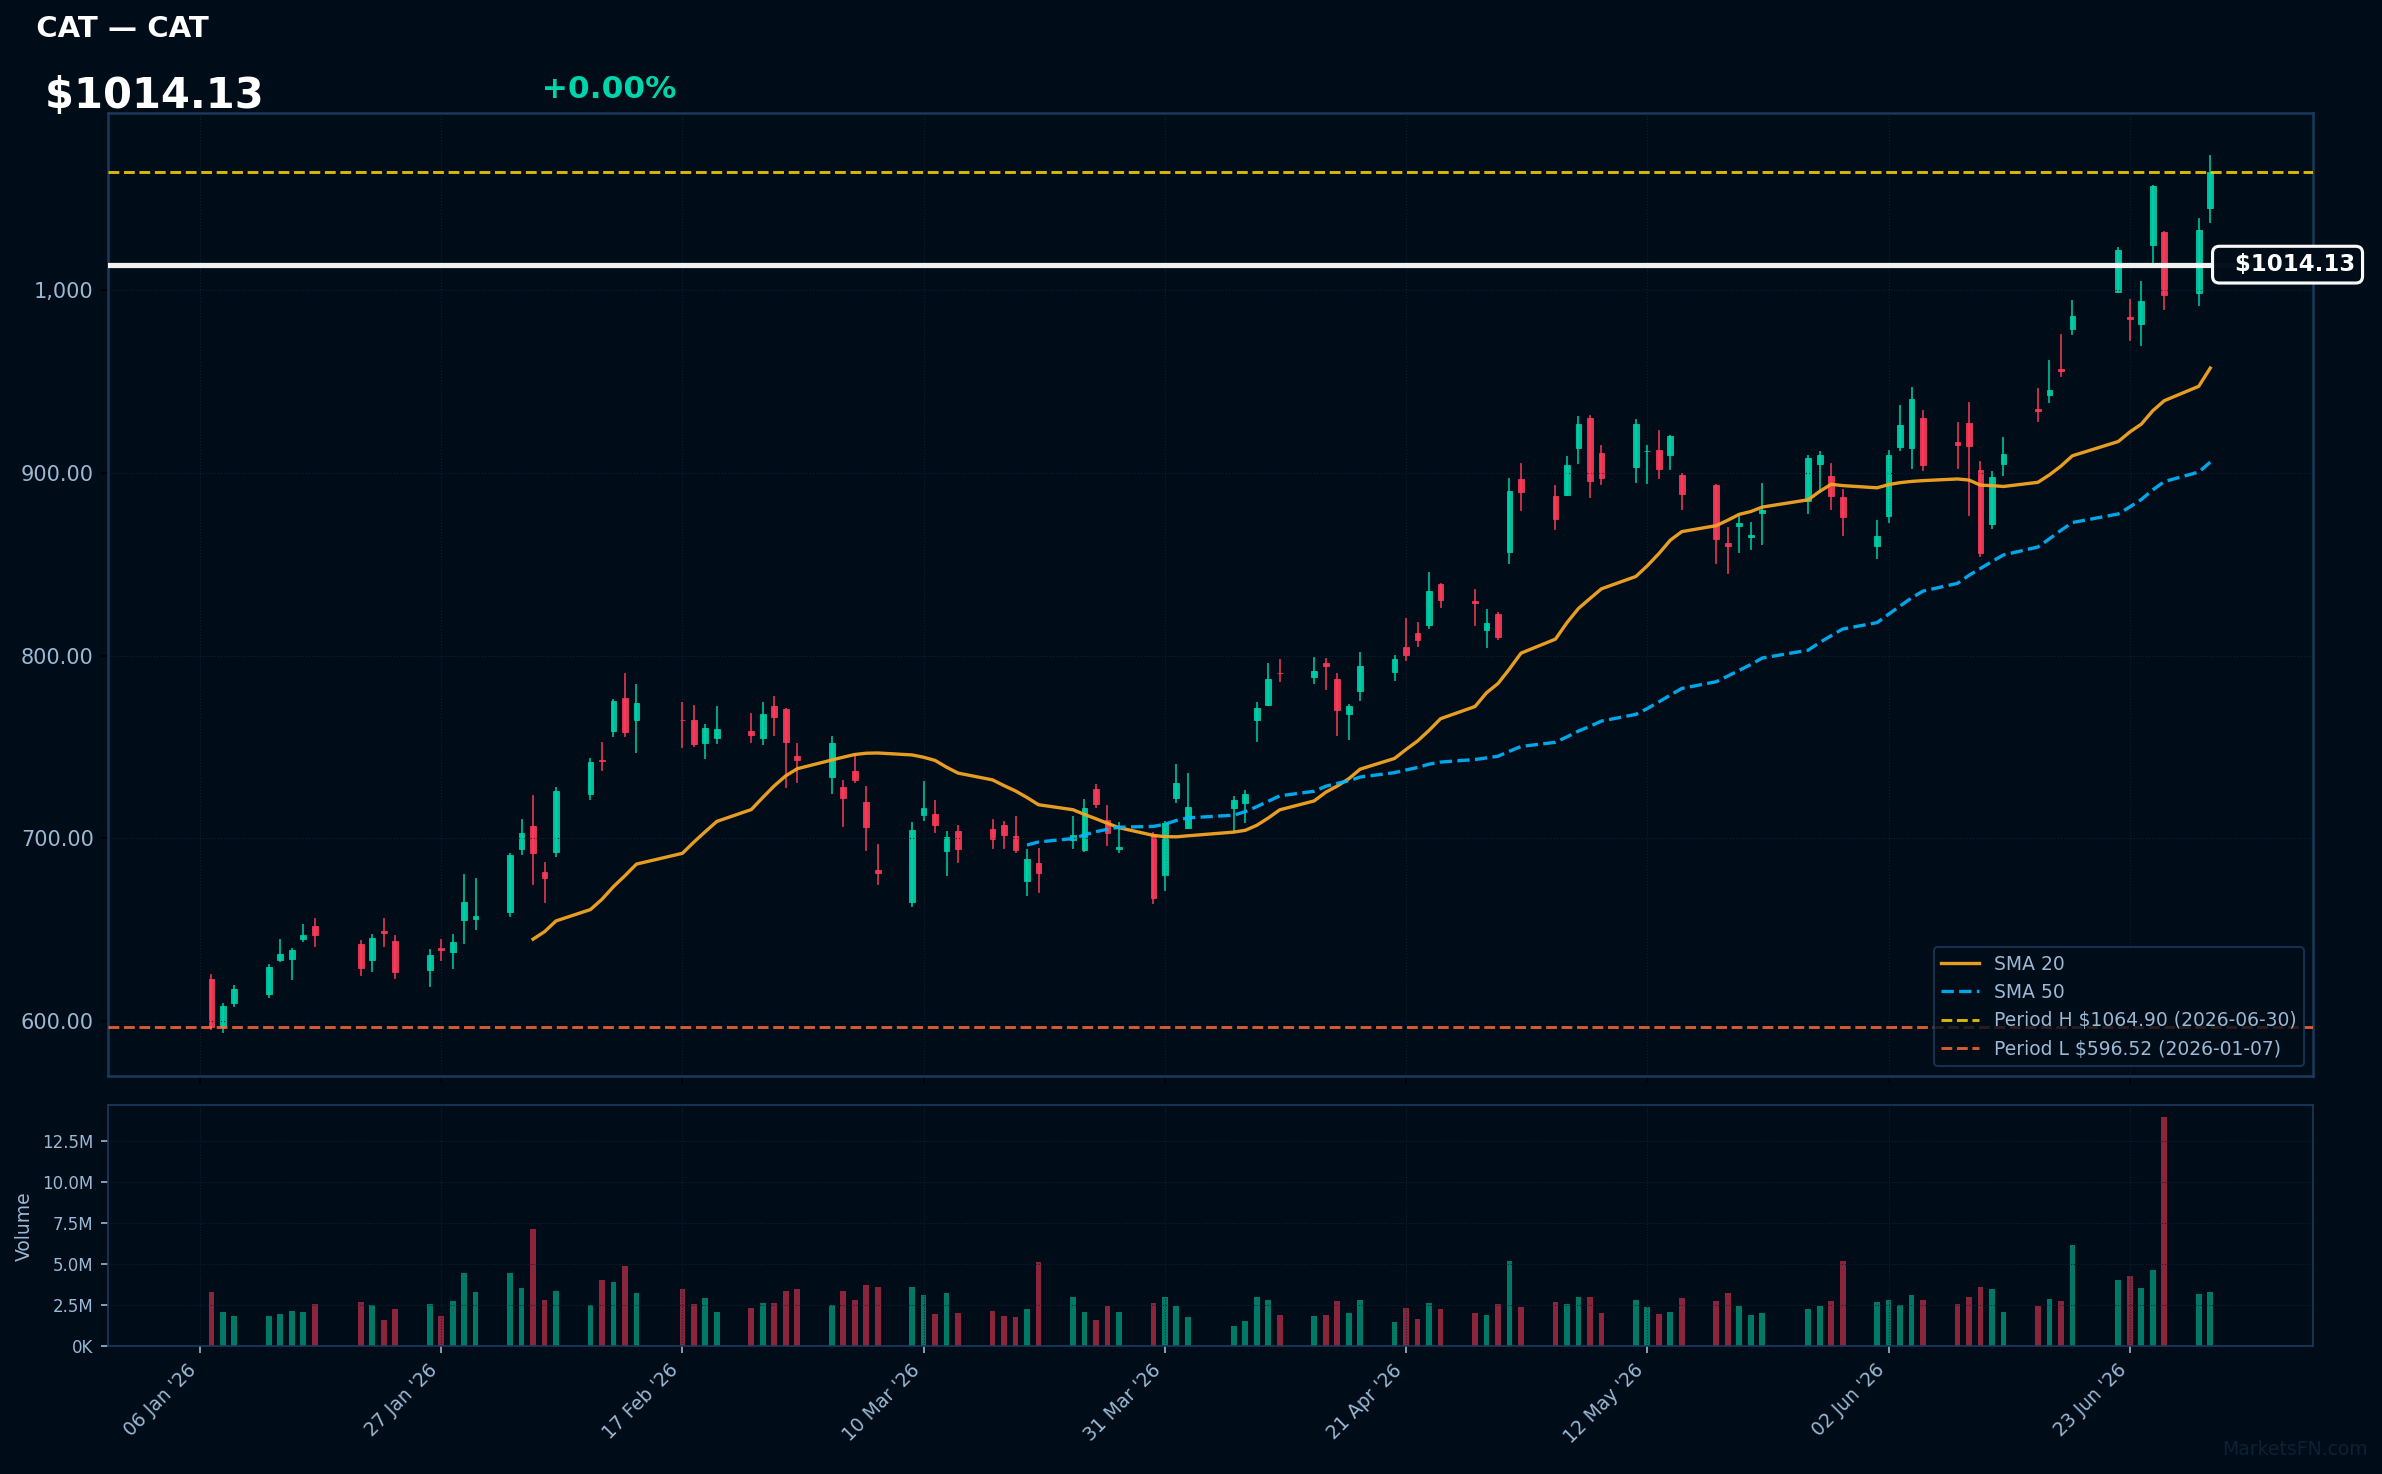
CAT | Caterpillar Inc | Industrials | Price Last: $1064.90 | % Realized: +77.95% | RSI: 57.4 | % above MA200: +53.4% | Trend: Above MA20, MA50, MA200
Caterpillar Inc is a leading manufacturer of heavy machinery used in construction, mining, and energy sectors. Investors should care because its performance is closely tied to global infrastructure spending and commodity prices, making it a key indicator of economic activity.
Caterpillar Inc is in a sustained uptrend with price > MA20 > MA50 > MA200, RSI(14) at 57.4, and is 0.0% below its 2026 YTD high, indicating strong momentum with no immediate signs of overbought conditions or reversal.
Related headlines
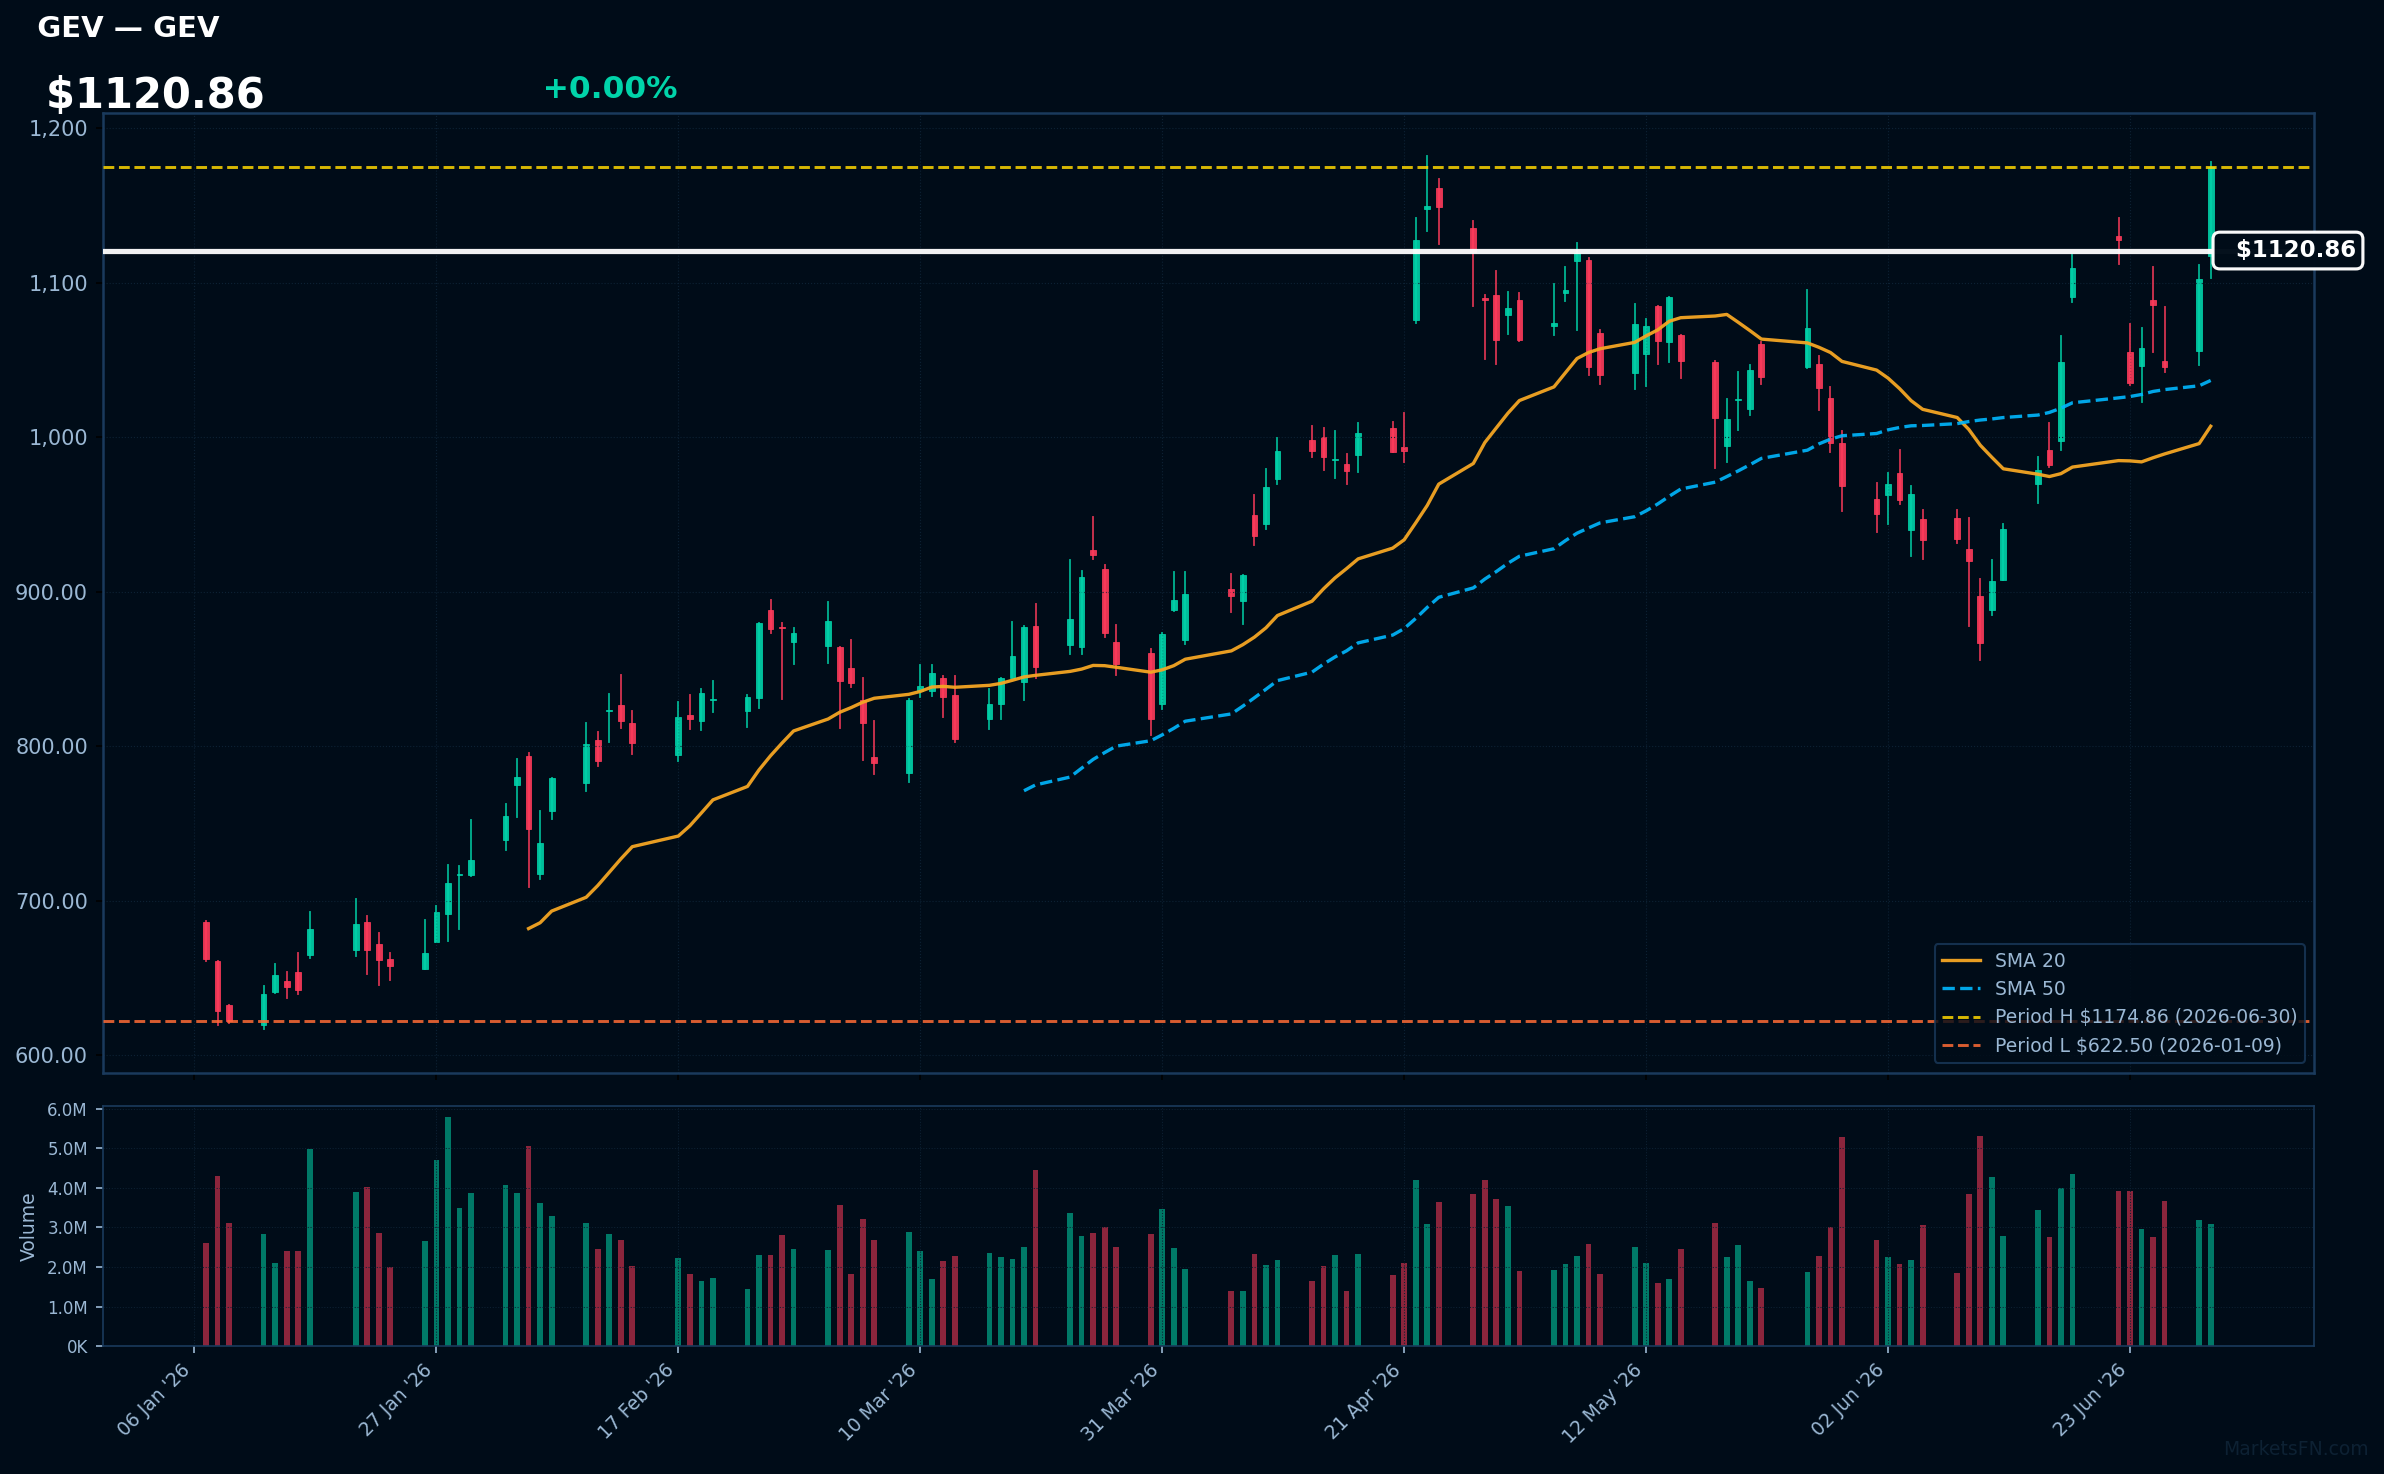
GEV | GE Vernova Inc | Industrials | Price Last: $1174.86 | % Realized: +72.89% | RSI: 58.2 | % above MA200: +48.3% | Trend: Above MA20, MA50, MA200
GE Vernova Inc is not described in the data provided, so its business activities and investor relevance cannot be determined.
GE Vernova Inc's RSI(14) is 58.2, indicating neutral momentum. The stock is above MA20, MA50, and MA200, showing mixed signals. It's near its 2026 YTD high, up 72.9% YTD, suggesting potential breakout momentum.
Related headlines
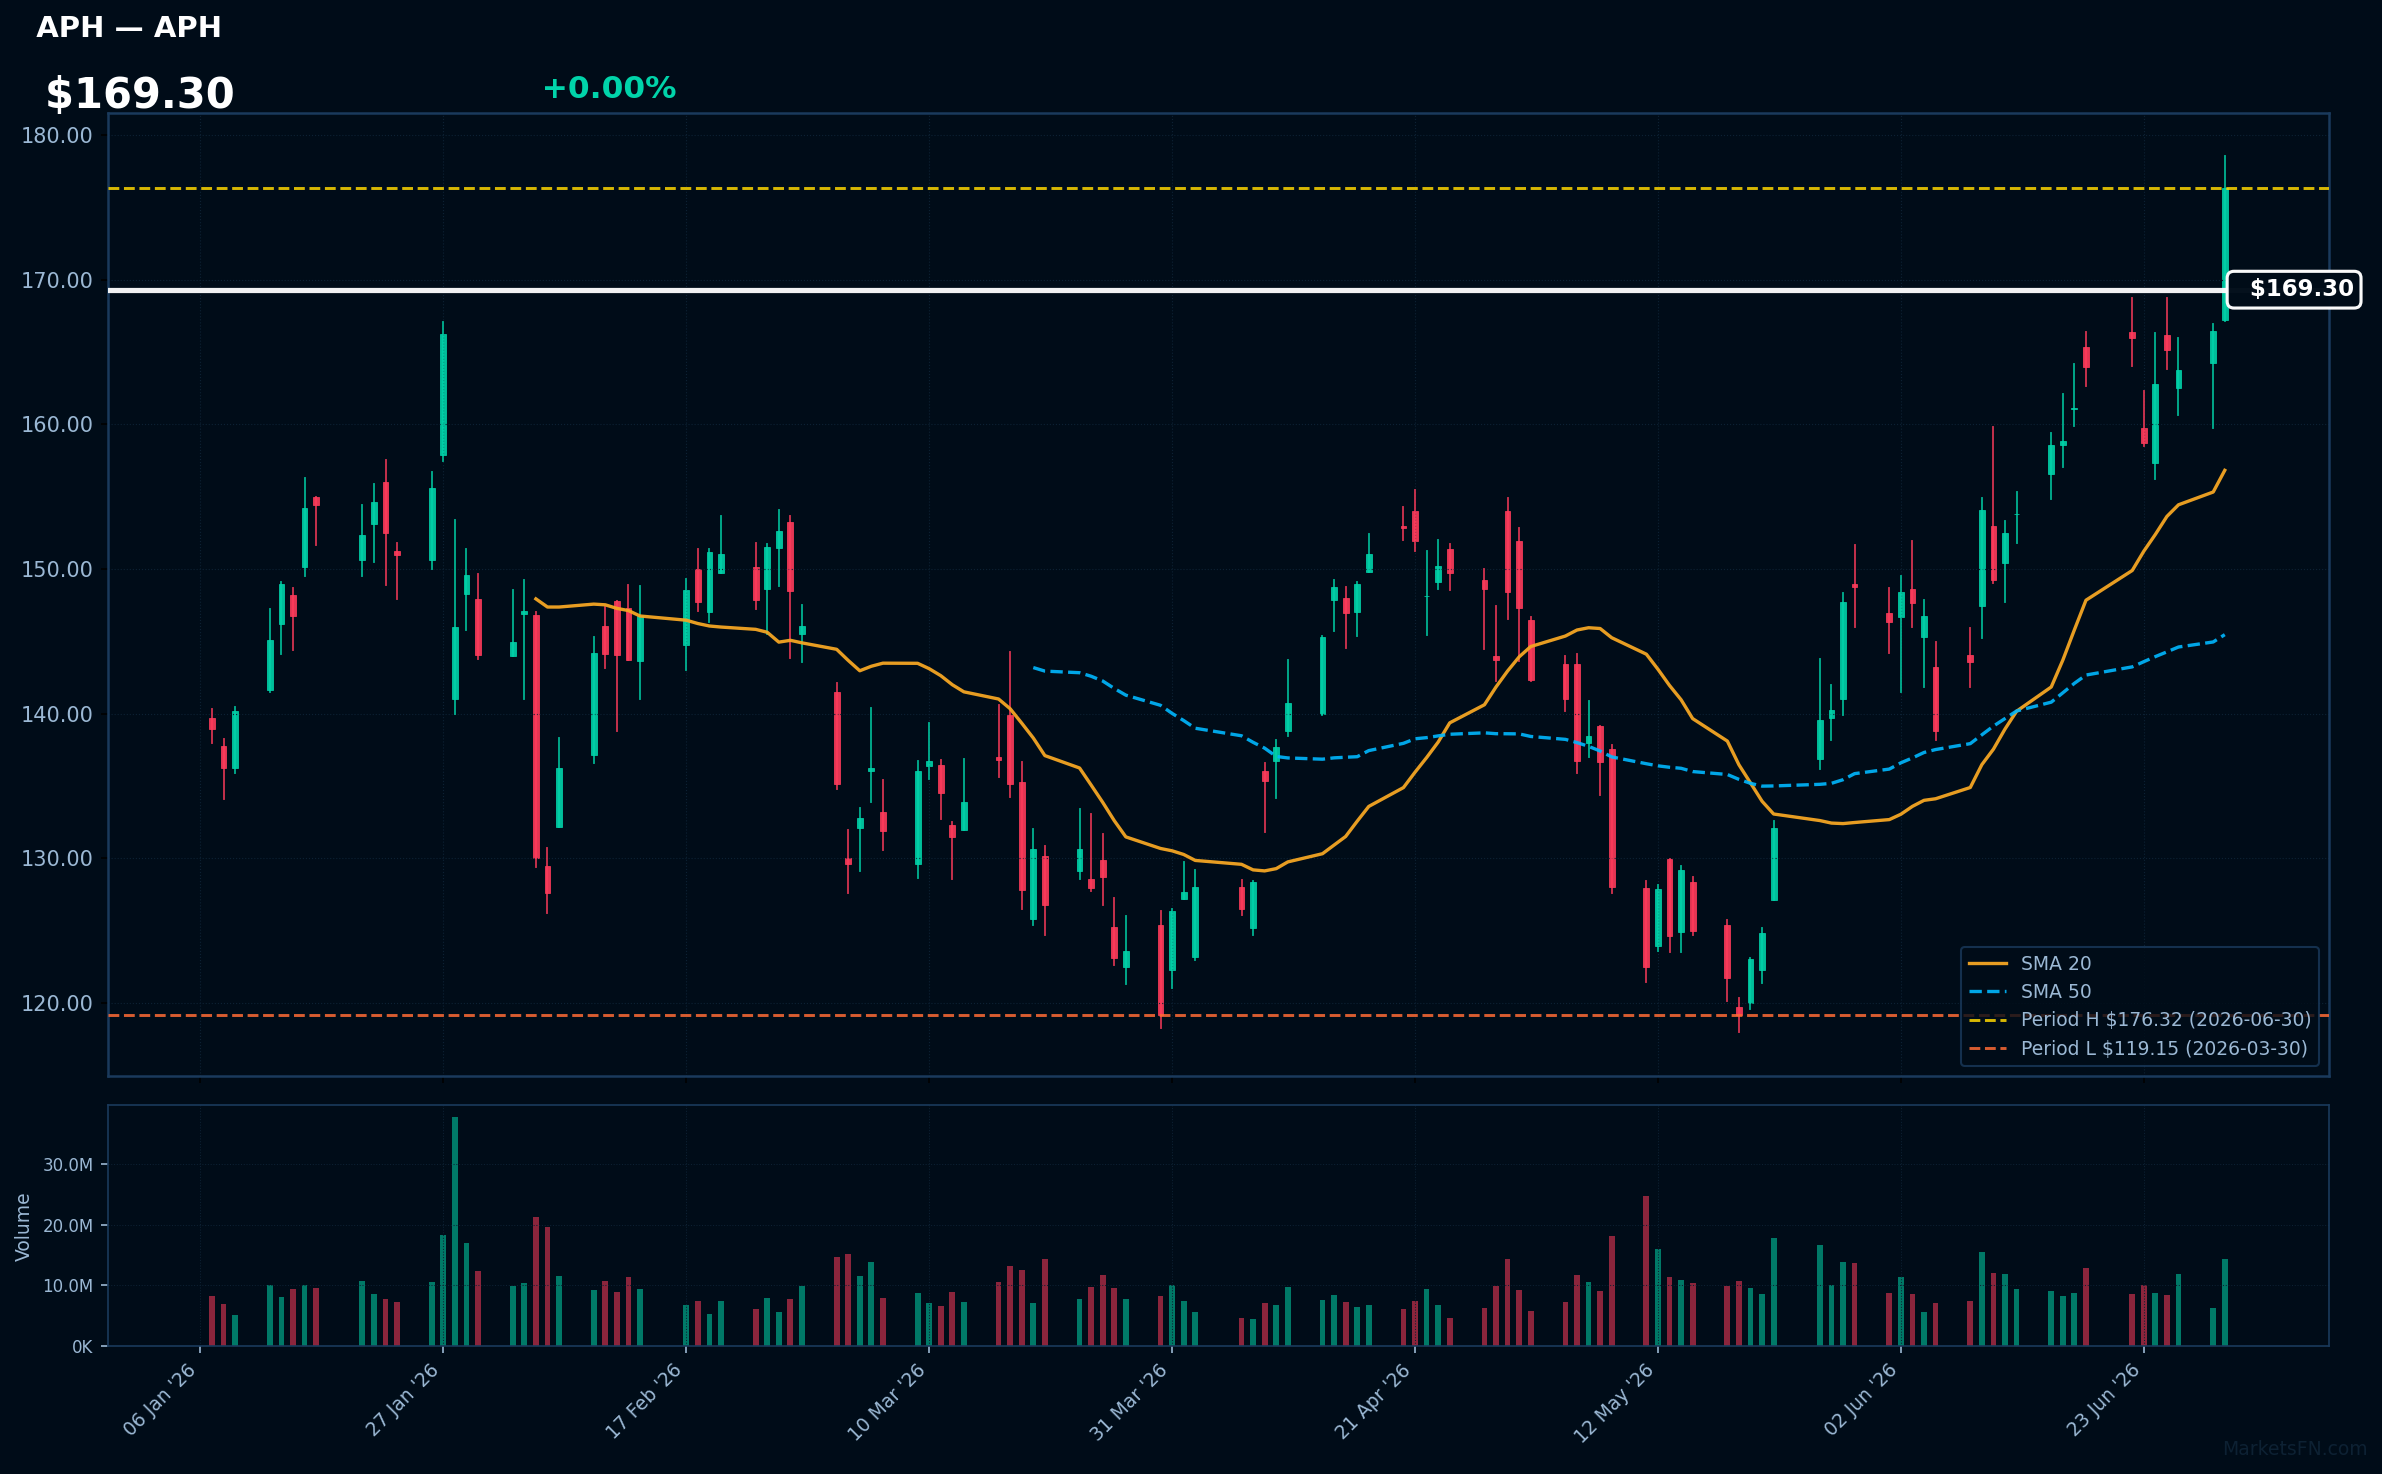
APH | Amphenol Corp | Technology | Price Last: $176.32 | % Realized: +26.20% | RSI: 62.6 | % above MA200: +27.2% | Trend: Above MA20, MA50, MA200
Amphenol Corp designs and manufactures interconnect products, including connectors and cables, used in various industries such as aerospace, automotive, and industrial. Investors should care due to the company's exposure to growing demand in these sectors.
Amphenol Corp's current technical situation indicates momentum, with RSI(14) at 62.6 and a bullish MA alignment: price ($169.30) > MA20 > MA50 > MA200, showing a sustained uptrend. The stock is near its 2026 YTD high, up 26.2% YTD.
Related headlines
📉 Nearest to 2026 Low
Sectors represented: Communication Services (2), Healthcare (2), Consumer Defensive (1)
| Ticker | Company | Sector | Price Last | % Realized | 2026 YTD Low Date | RSI | % above MA200 | Trend |
|---|---|---|---|---|---|---|---|---|
| TMUS | T-Mobile US Inc | Communication Services | $167.73 | -15.96% | 2026-06-30 | 36.8 | -17.9% | Below MA20, MA50, MA200 |
| T | AT&T, Inc | Communication Services | $20.70 | -15.72% | 2026-06-30 | 28.9 | -19.7% | Below MA20, MA50, MA200 |
| PEP | PepsiCo Inc | Consumer Defensive | $135.40 | -4.80% | 2026-06-30 | 39.9 | -9.8% | Below MA20, MA50, MA200 |
| ISRG | Intuitive Surgical Inc | Healthcare | $397.68 | -29.24% | 2026-06-30 | 43.8 | -18.6% | Below MA20, MA50, MA200 |
| BSX | Boston Scientific Corp | Healthcare | $42.68 | -54.94% | 2026-06-30 | 30.8 | -45.8% | Below MA20, MA50, MA200 |
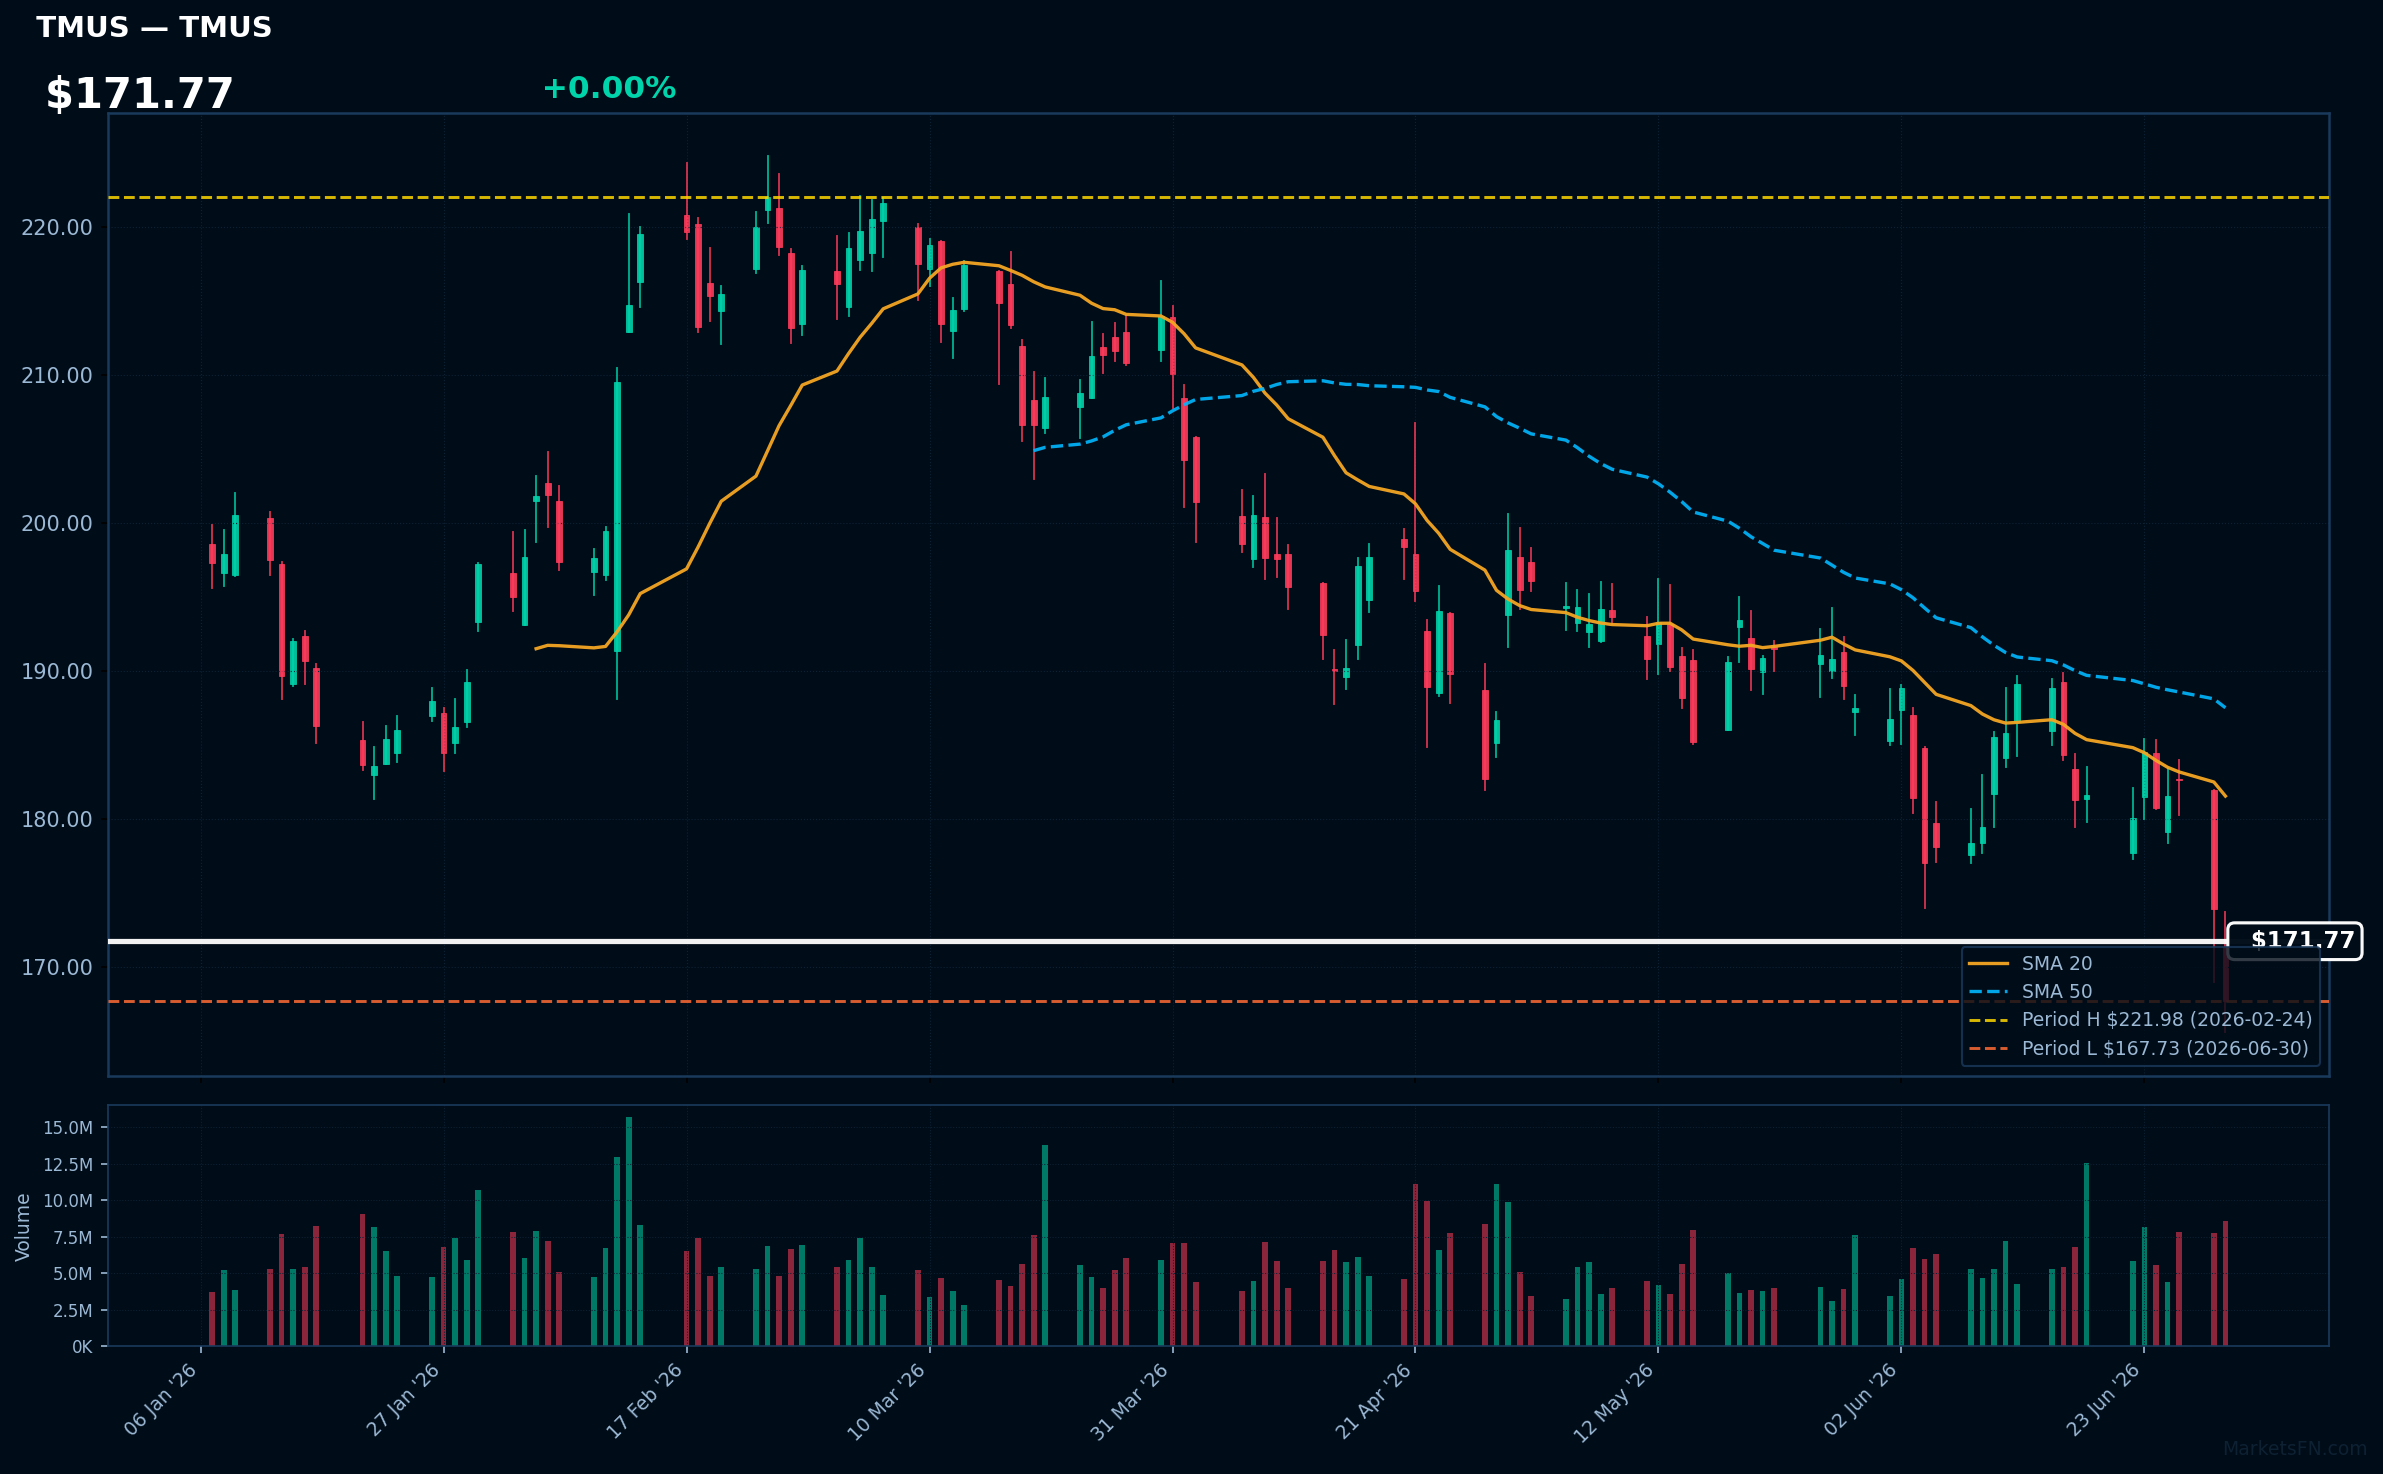
TMUS | T-Mobile US Inc | Communication Services | Price Last: $167.73 | % Realized: -15.96% | RSI: 36.8 | % above MA200: -17.9% | Trend: Below MA20, MA50, MA200
T-Mobile US Inc is a wireless network operator providing mobile services. Investors should care about its competitive positioning, 5G rollout, and subscriber growth, as these factors drive revenue and profitability in the telecom sector.
T-Mobile US Inc is in a sustained downtrend with price ($171.77) below MA20, MA50, and MA200. The RSI(14) is 36.8, near oversold territory. The stock is testing major support at its 2026 YTD low, having fallen 16.0% YTD, indicating potential further downside.
Related headlines
- VZ, T, TMUS Shares Under Pressure SpaceX's Starlink Mobile Service Push Rattles Telecom Stocks
- SpaceX Might Bring Mobile Phone to Market, and Verizon, AT&T, and T-Mobile Are Down
- SPCX Stock: SpaceX's Wireless Ambitions Fuel T-Mobile Acquisition Speculation
- T-Mobile to Host Q2 2026 Earnings Call on July 23, 2026
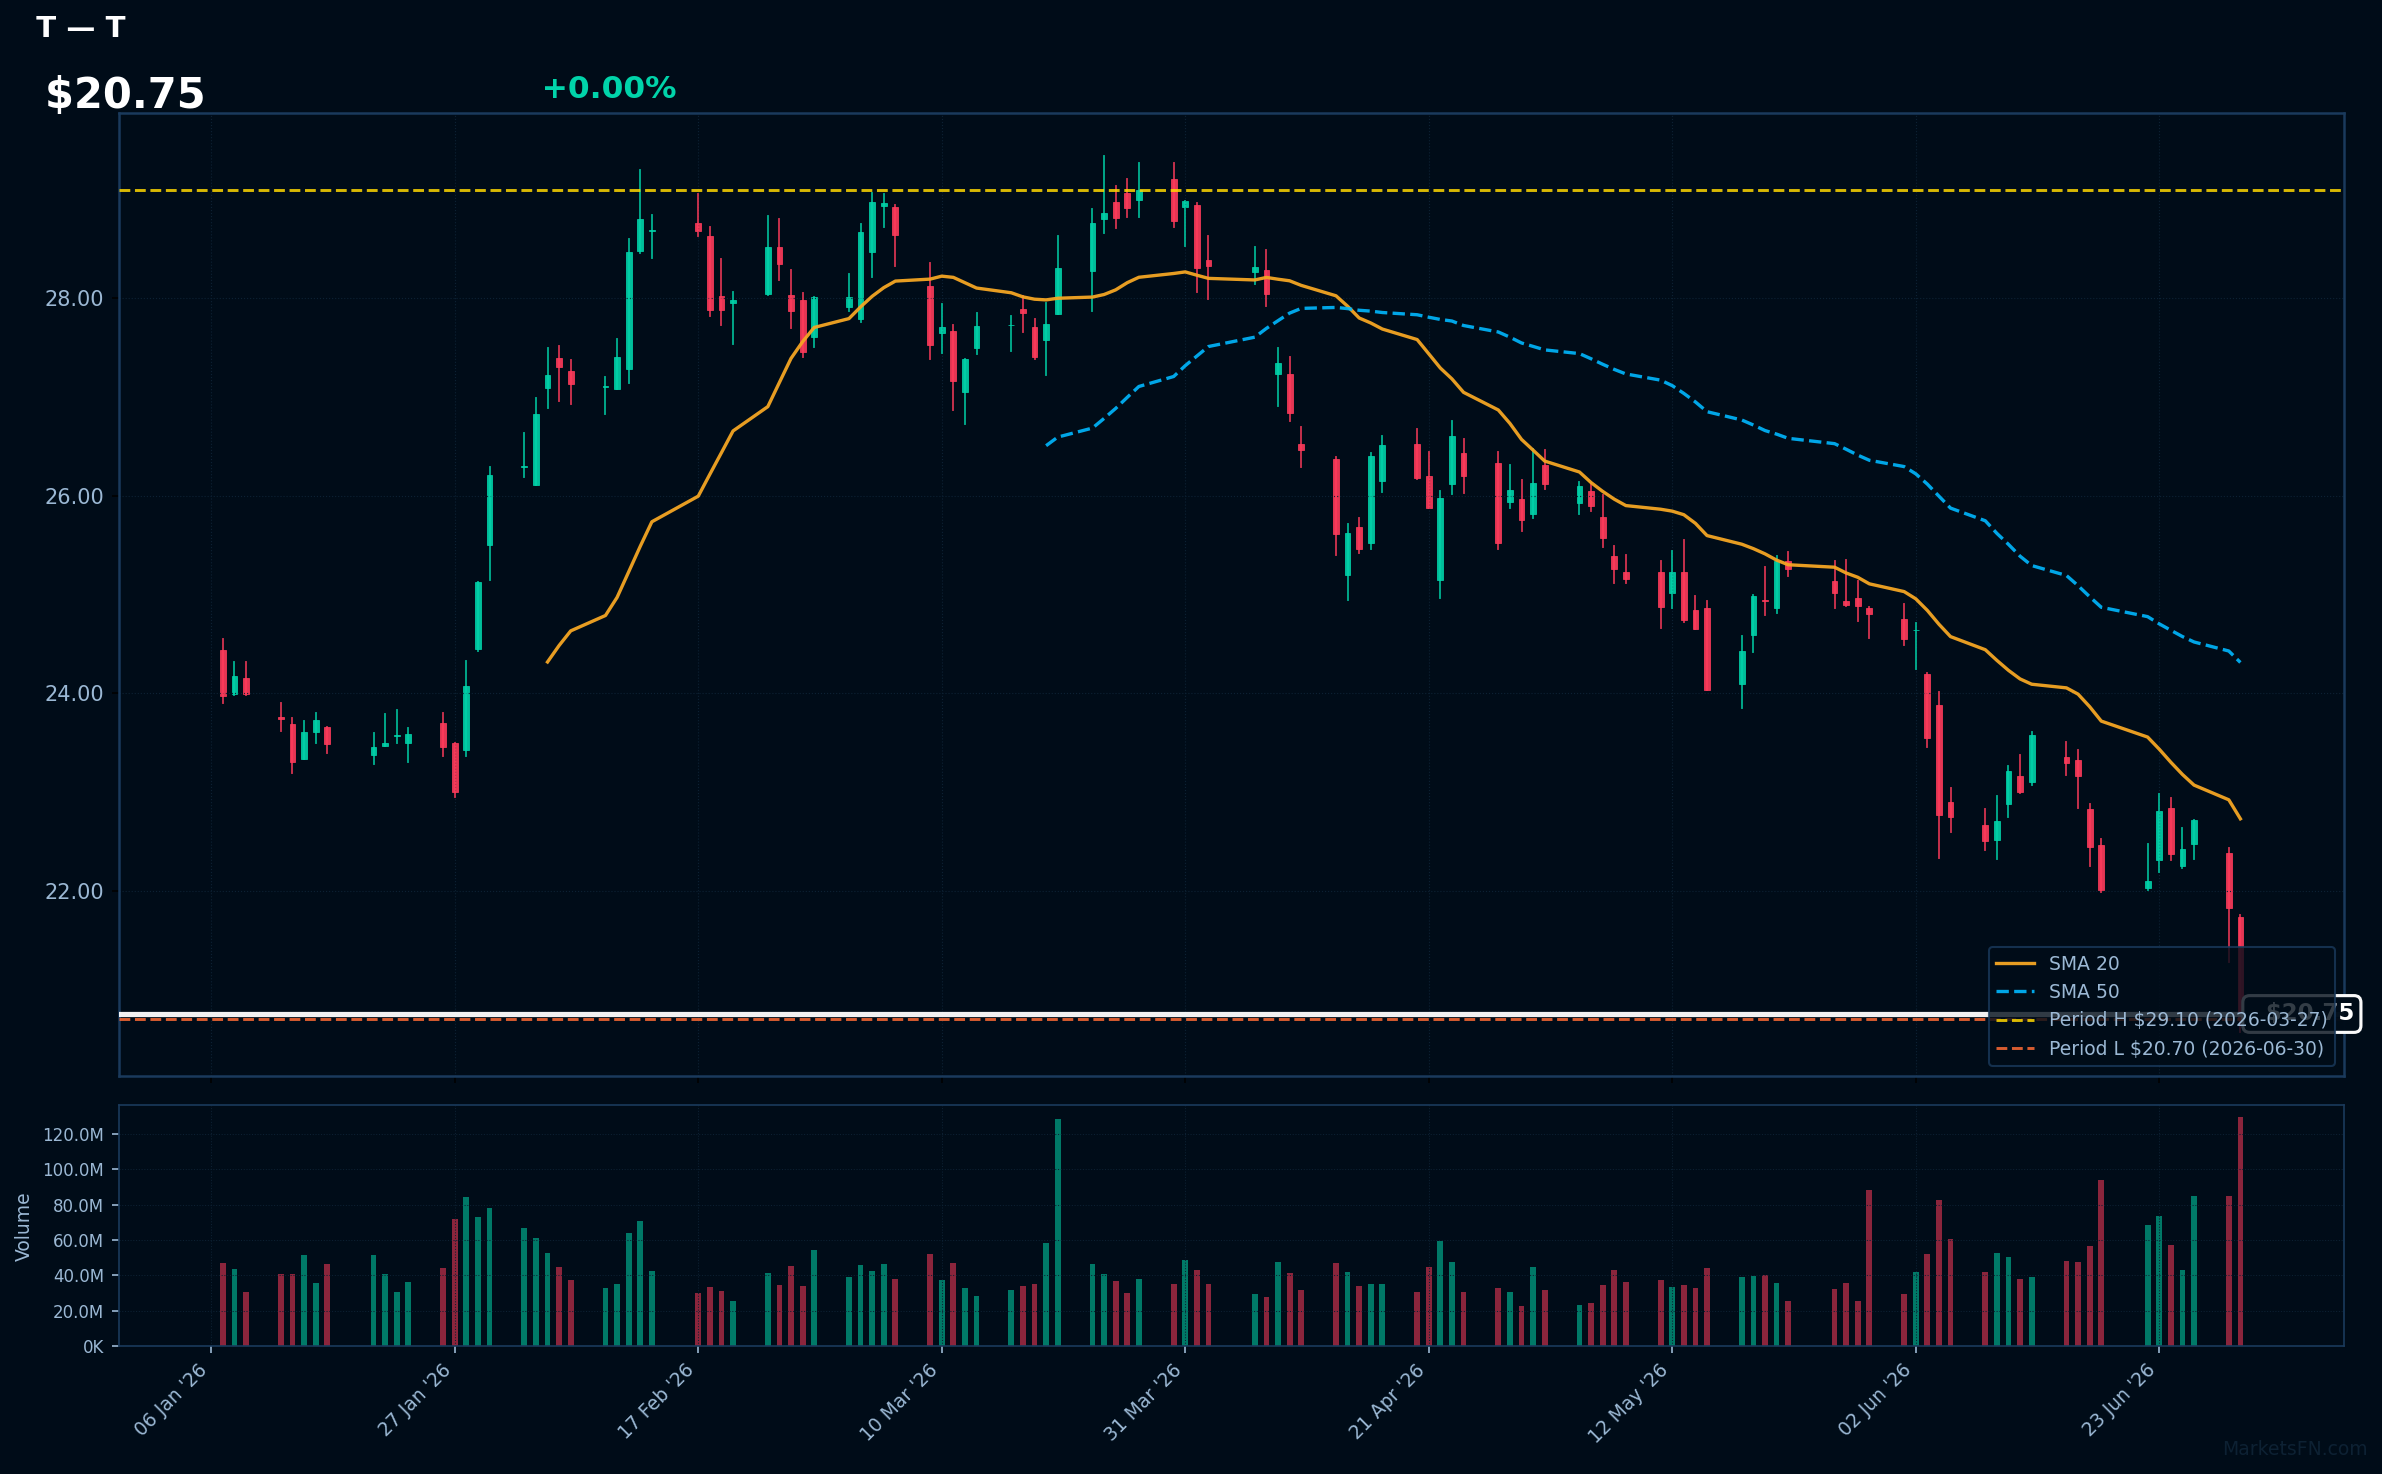
T | AT&T, Inc | Communication Services | Price Last: $20.70 | % Realized: -15.72% | RSI: 28.9 | % above MA200: -19.7% | Trend: Below MA20, MA50, MA200
AT&T, Inc is a telecommunications conglomerate providing wireless communications, local exchange, and long-distance services. Investors should care about its ability to adapt to changing consumer demands and navigate regulatory environments, impacting its revenue growth and dividend sustainability.
AT&T's technical situation indicates a warning sign with an RSI(14) of 28.9, suggesting oversold conditions, and a bearish MA alignment: price ($20.75) < MA20 < MA50 < MA200, indicating a sustained downtrend, further emphasized by being 0.0% above its 2026 YTD low.
Related headlines
- SpaceX's Next Big Bet: Your Phone Bill?
- EchoStar Unit Dish DBS Files for Bankruptcy After Delays In Crucial AT&T Transaction
- A $1.6 Trillion Disruption: Why Wall Street Is Worried About a SpaceX Phone
- AT&T Expands Build-A-Plan: Flexible Custom Wireless Plan Now Includes the Ability to Easily Add America's Best and Fastest Home Internet
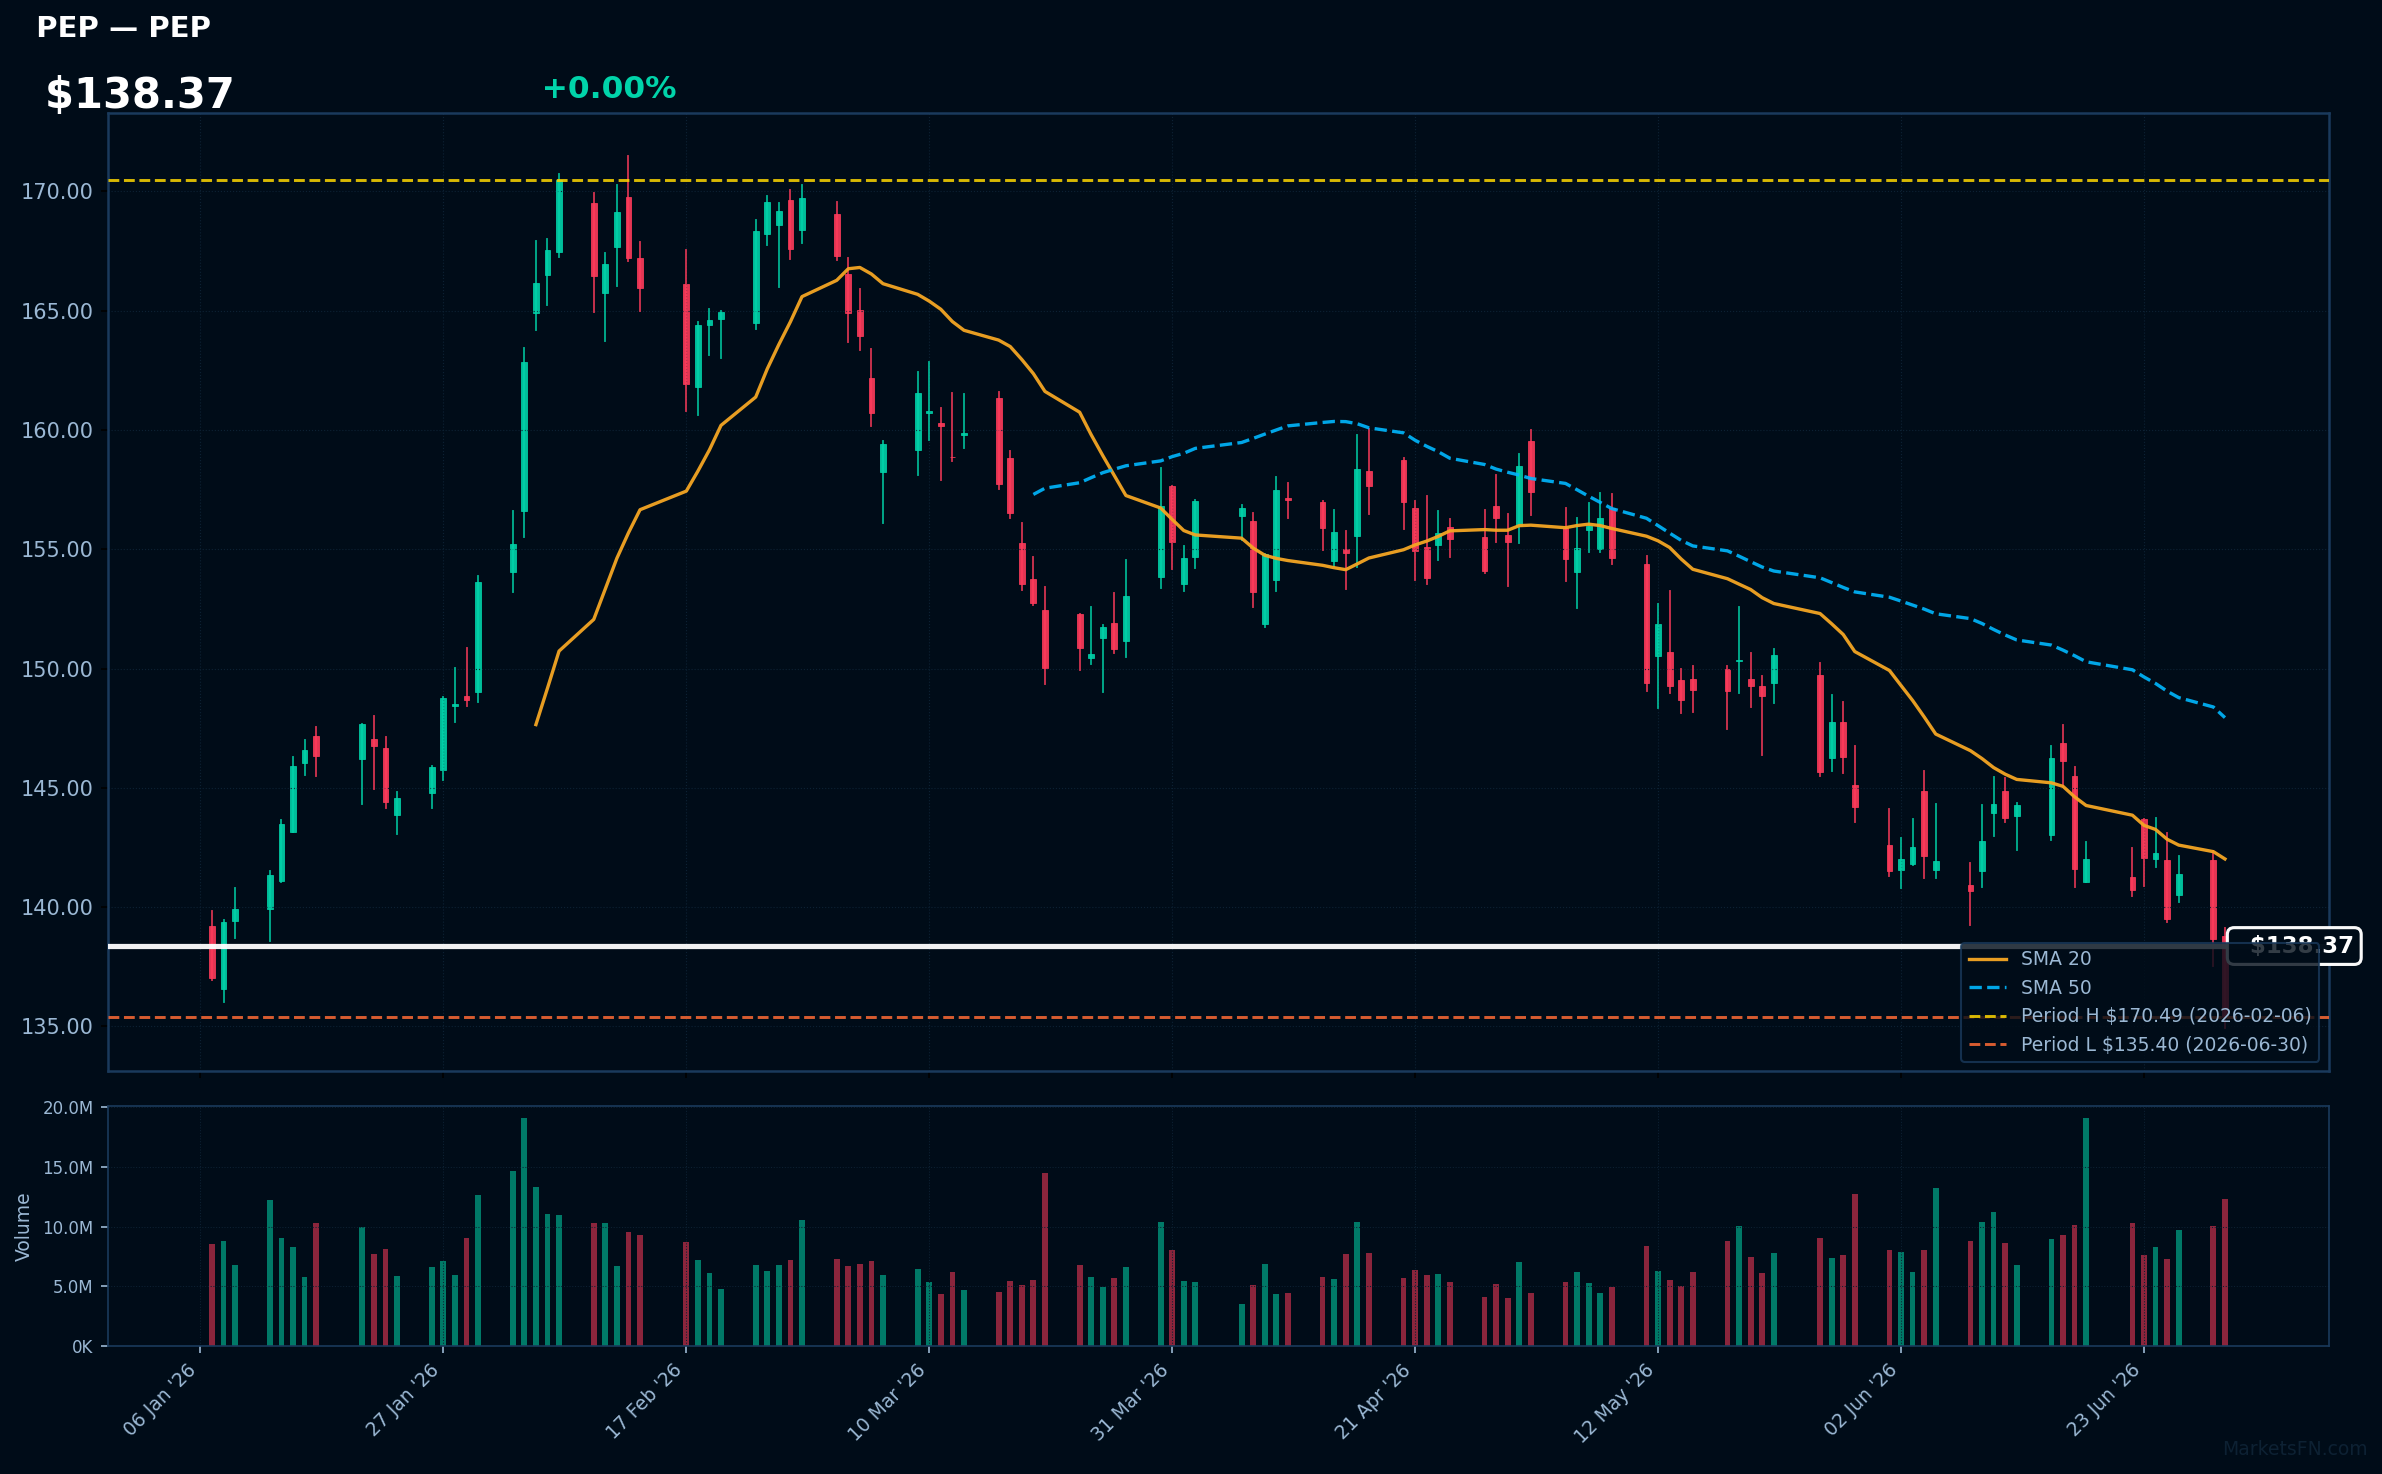
PEP | PepsiCo Inc | Consumer Defensive | Price Last: $135.40 | % Realized: -4.80% | RSI: 39.9 | % above MA200: -9.8% | Trend: Below MA20, MA50, MA200
PepsiCo Inc is a multinational food and beverage corporation that generates revenue through the sale of popular brands such as Pepsi, Lay's, and Gatorade, making it a significant player in the consumer staples sector, with investors caring about its stable dividend and market share.
PepsiCo Inc's current technical situation indicates a warning sign, with an RSI(14) of 39.9, suggesting oversold conditions, and a bearish MA alignment (price < MA20 < MA50 < MA200), indicating a sustained downtrend, as it tests major support at its 2026 YTD low.
Related headlines
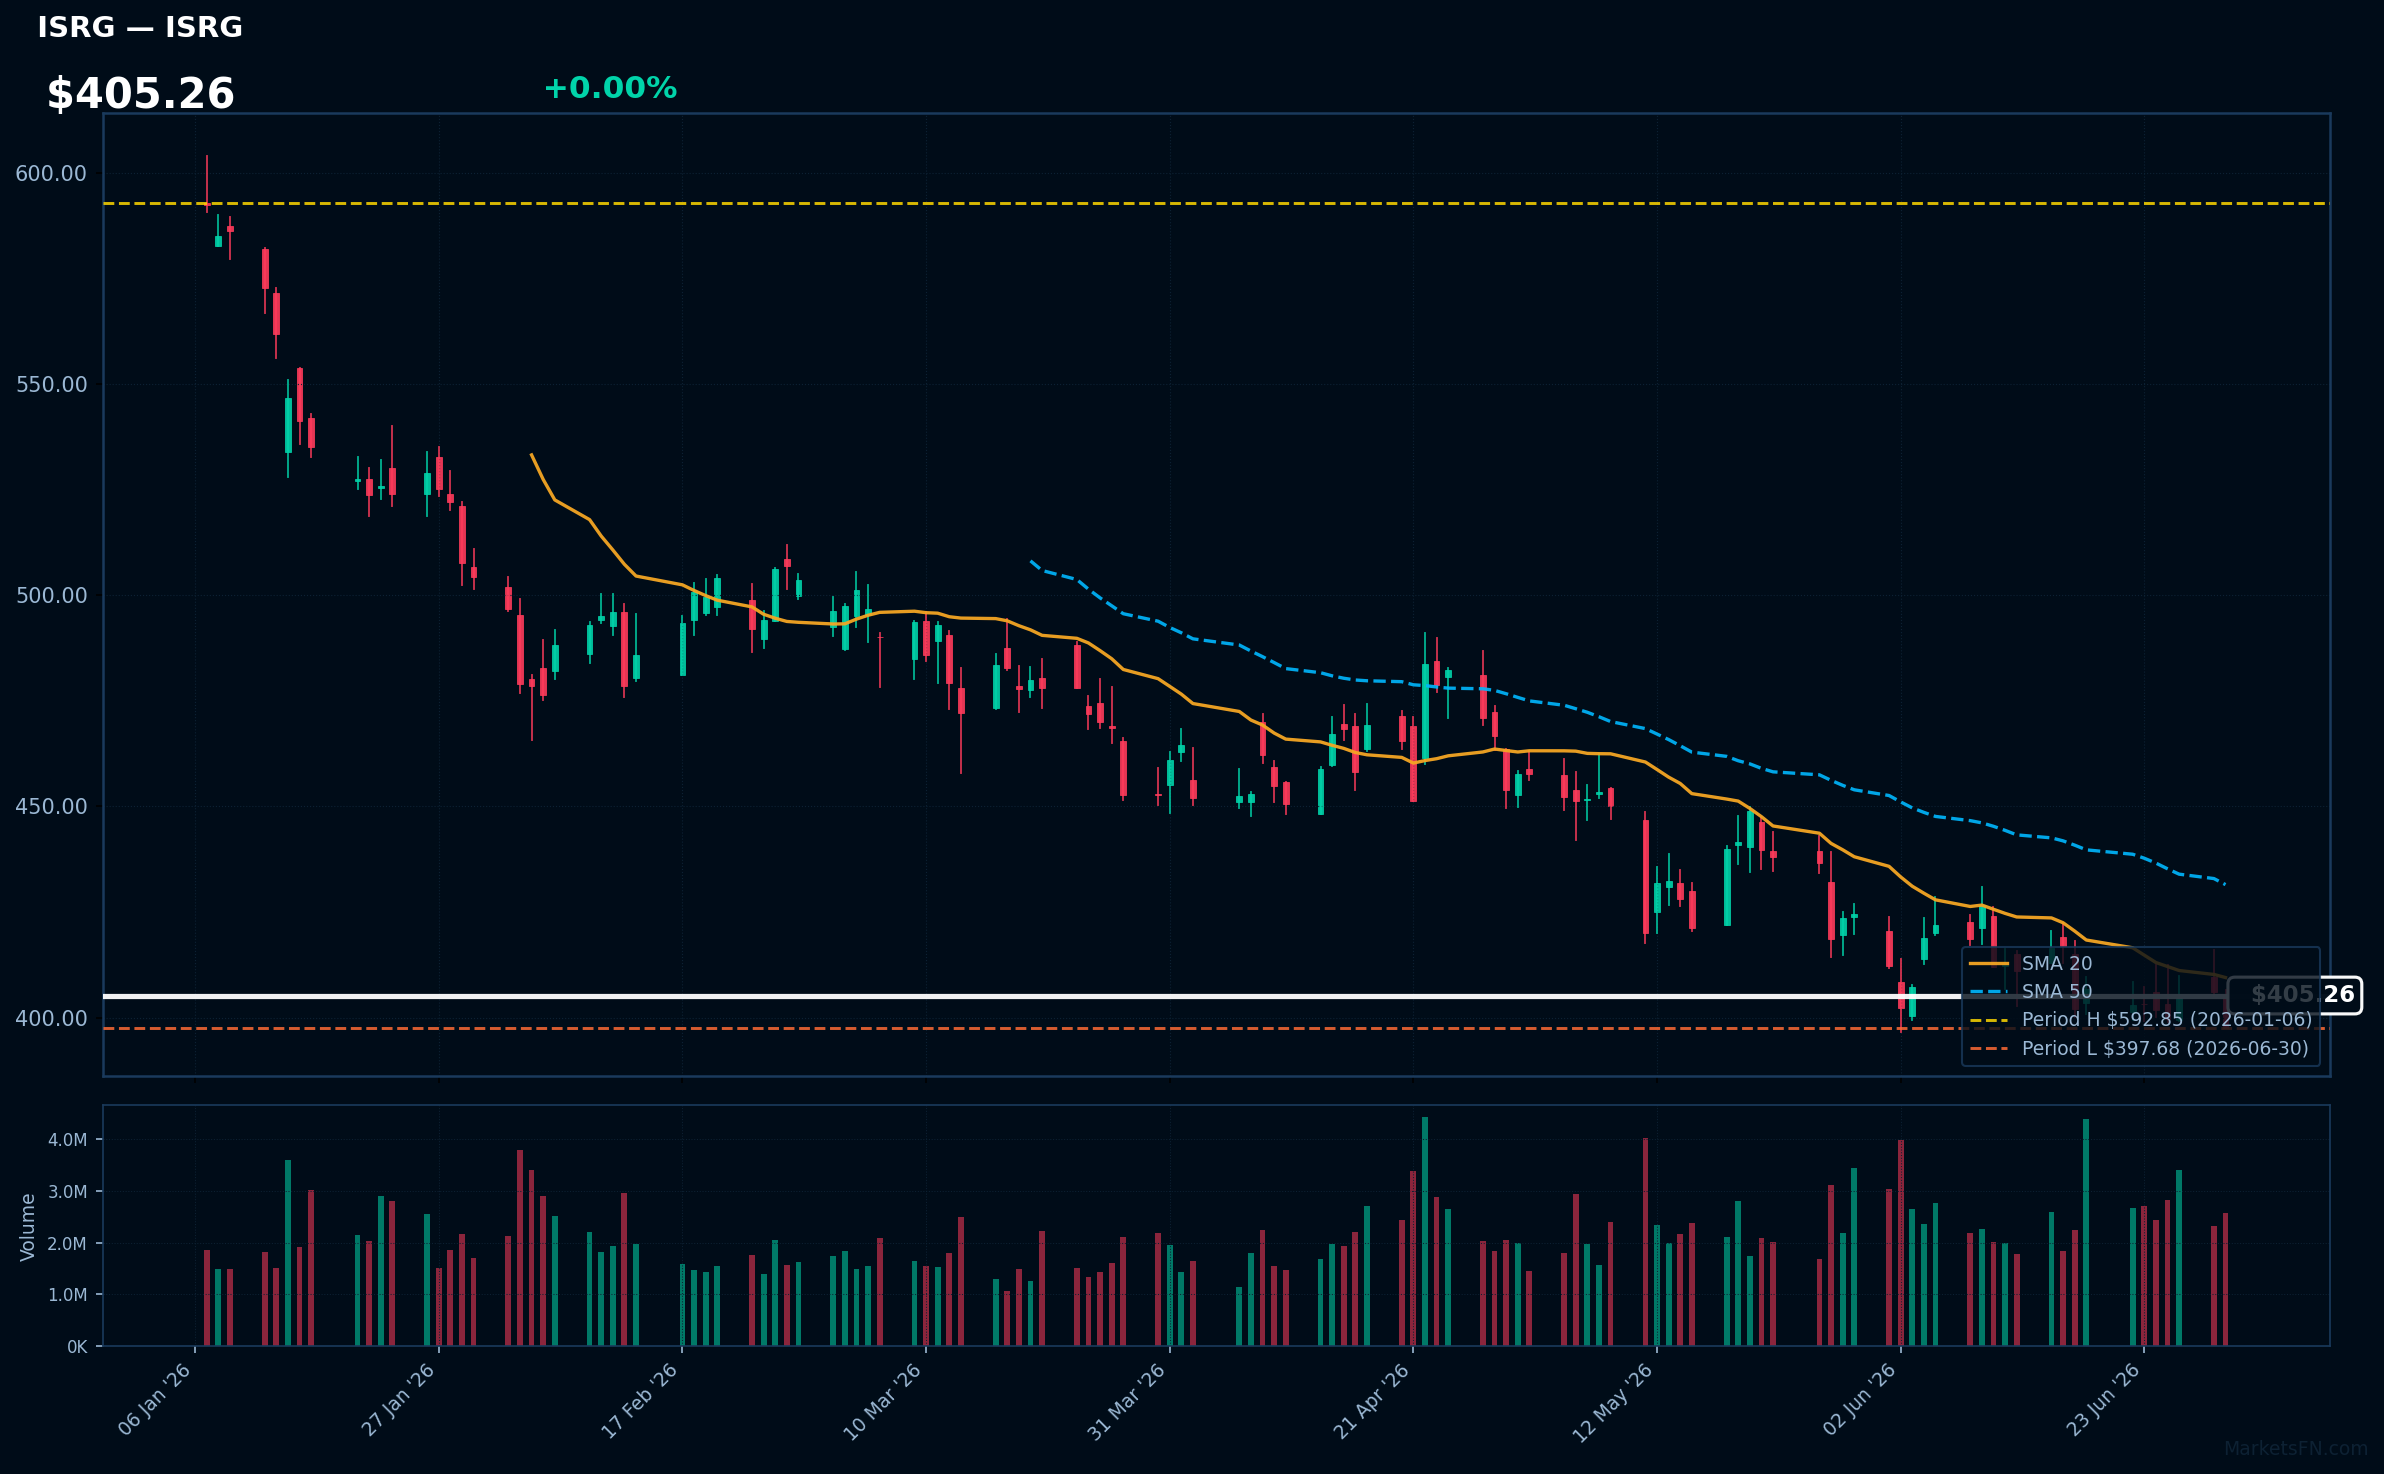
ISRG | Intuitive Surgical Inc | Healthcare | Price Last: $397.68 | % Realized: -29.24% | RSI: 43.8 | % above MA200: -18.6% | Trend: Below MA20, MA50, MA200
Intuitive Surgical Inc develops and manufactures robotic-assisted surgical systems, primarily the da Vinci Surgical System, used in minimally invasive surgeries. Investors should care because its technology is revolutionizing surgical procedures, driving growth through adoption and expanding procedure volumes.
ISRG's technical situation is bearish, with an RSI(14) of 43.8 indicating neutral momentum, but a sustained downtrend as price ($405.26) remains below MA20, MA50, and MA200. The stock is testing major support at its 2026 YTD low.
Related headlines
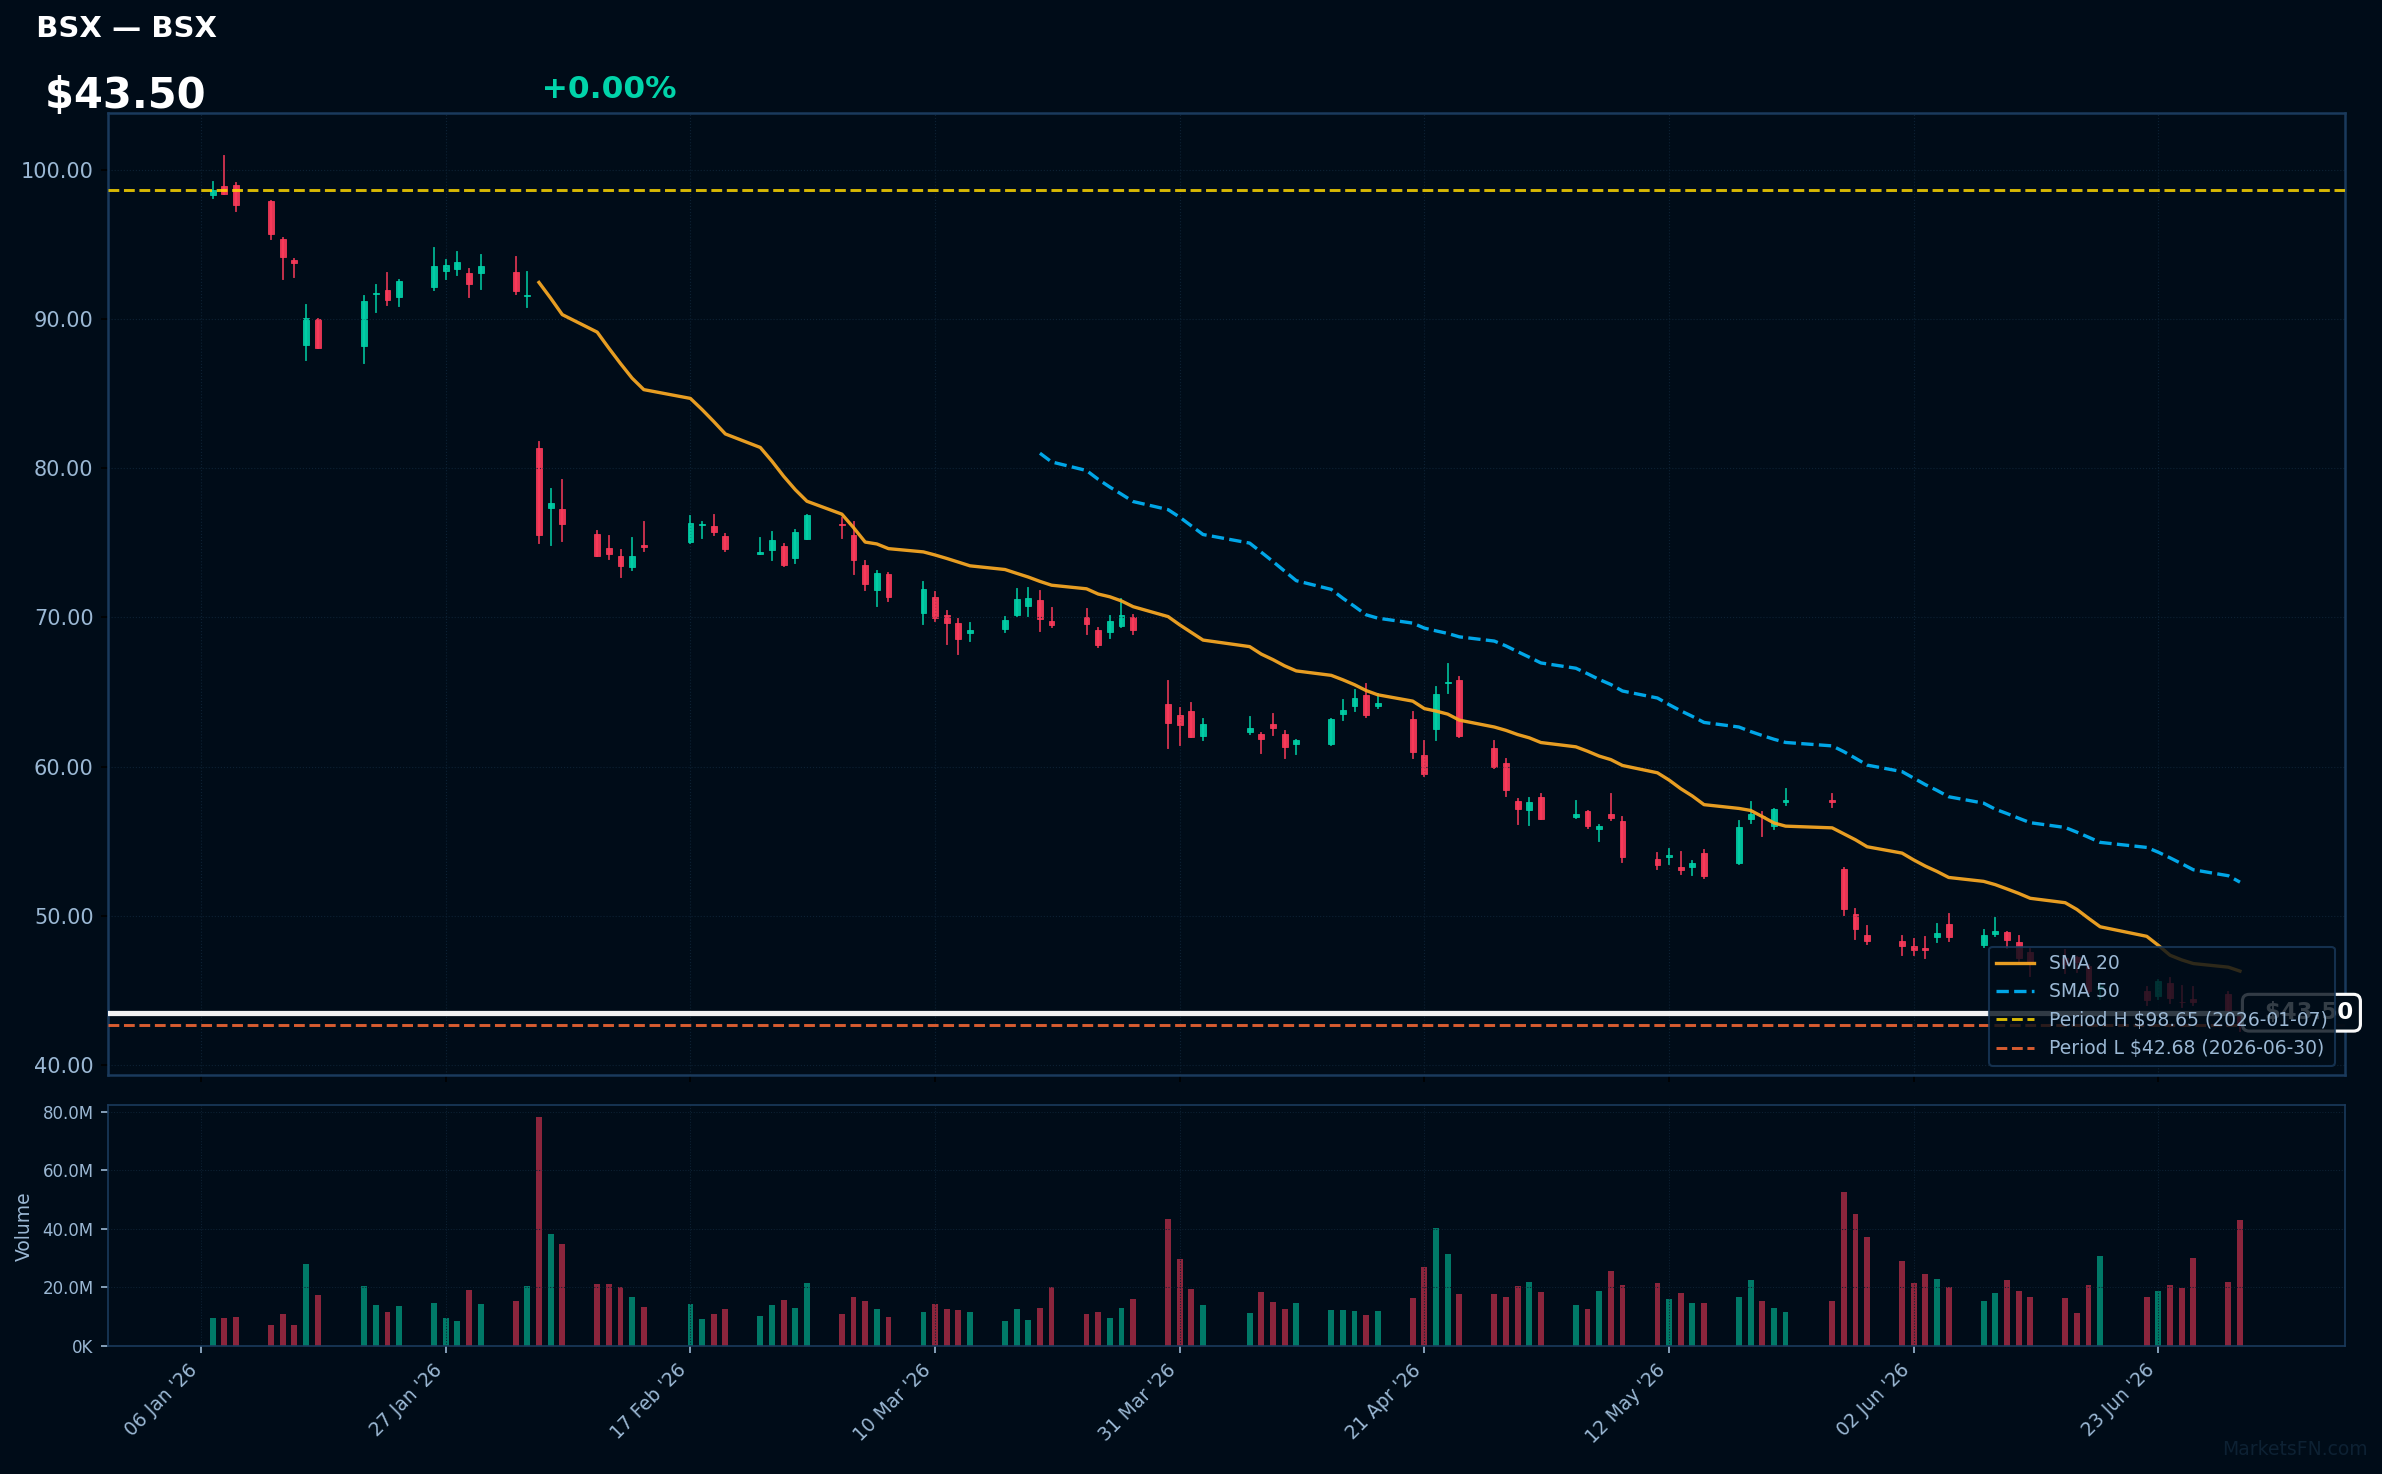
BSX | Boston Scientific Corp | Healthcare | Price Last: $42.68 | % Realized: -54.94% | RSI: 30.8 | % above MA200: -45.8% | Trend: Below MA20, MA50, MA200
Boston Scientific Corp (BSX) develops and manufactures medical devices, including stents, pacemakers, and neurostimulation devices, treating cardiovascular and other conditions. Investors should care about its innovation pipeline and market share in the medical device industry.
BSX is in a sustained downtrend with price ($43.50) below MA20, MA50, and MA200. RSI(14) is 30.8, near oversold territory. The stock is testing major support at its 2026 YTD low, having fallen -54.9% YTD, indicating a warning sign.
Related headlines
Market Commentary
As of the latest data, certain S&P 500 stocks are trading near their 2026 year-to-date (YTD) extremes. Specifically, GE Aerospace (GE), Advanced Micro Devices Inc (AMD), Caterpillar Inc (CAT), GE Vernova Inc (GEV), and Amphenol Corp (APH) are at their 2026 YTD highs, while T-Mobile US Inc (TMUS), AT&T, Inc (T), PepsiCo Inc (PEP), Intuitive Surgical Inc (ISRG), and Boston Scientific Corp (BSX) are at their 2026 YTD lows.
The stocks at their 2026 YTD highs are from diverse sectors such as industrials (CAT), technology (AMD, APH), and energy (GEV), indicating strong performance across various industries. Conversely, the stocks at their 2026 YTD lows are primarily from the telecommunications (TMUS, T) and consumer staples (PEP) sectors, as well as healthcare (ISRG, BSX), suggesting challenges in these areas.
Investors should monitor market conditions, sector trends, and company-specific news for these stocks to understand the drivers behind their current extremes. As the year progresses, shifts in these factors could influence whether these stocks continue near their extremes or move away from them.
Methodology: All 503 S&P 500 constituents screened. Close prices downloaded from 2026-01-01. Period high = highest close since Jan 1 2026; period low = lowest close since Jan 1 2026. Distance = (current price / period extreme − 1) × 100. Technical indicators computed on up to 1 year of daily OHLCV data.
Disclaimer: For informational purposes only. Not investment advice. Past performance is not indicative of future results.