Nasdaq 100 52-Week Highs & Lows Radar: Palo Alto Networks (PANW), Constellation Energyoration (CEG) and more
· Stocks · MarketsFN Team
Nasdaq 100 52-Week Highs & Lows Radar: Palo Alto Networks (PANW), Constellation Energyoration (CEG) and more
Screening all 101 Nasdaq 100 constituents for stocks nearest to their 52-week high and their 52-week low. Data as of July 01, 2026. % Realized = 52-week total return.
Legend: RSI > 70 = overbought · RSI < 30 = oversold · Green % Realized = positive 52W return · Red = negative.
📈 Nearest to 52-Week High
Sectors represented: Technology (3), Communication Services (1), Consumer Defensive (1)
| Ticker | Company | Sector | Price Last | % Realized | 52-Week High Date | RSI | % above MA200 | Trend |
|---|---|---|---|---|---|---|---|---|
| PANW | Palo Alto Networks Inc | Technology | $352.67 | +78.49% | 2026-07-01 | 81.5 | +75.7% | Above MA20, MA50, MA200 |
| CRWD | Crowdstrike Holdings Inc | Technology | $784.69 | +59.47% | 2026-07-01 | 72.4 | +57.6% | Above MA20, MA50, MA200 |
| FTNT | Fortinet Inc | Technology | $157.40 | +53.67% | 2026-07-01 | 70.6 | +69.7% | Above MA20, MA50, MA200 |
| EA | Electronic Arts, Inc | Communication Services | $205.60 | +29.26% | 2026-07-01 | 70.6 | +2.4% | Above MA20, MA50, MA200 |
| MNST | Monster Beverage Corp | Consumer Defensive | $97.57 | +53.56% | 2026-06-29 | 71.8 | +26.0% | Above MA20, MA50, MA200 |
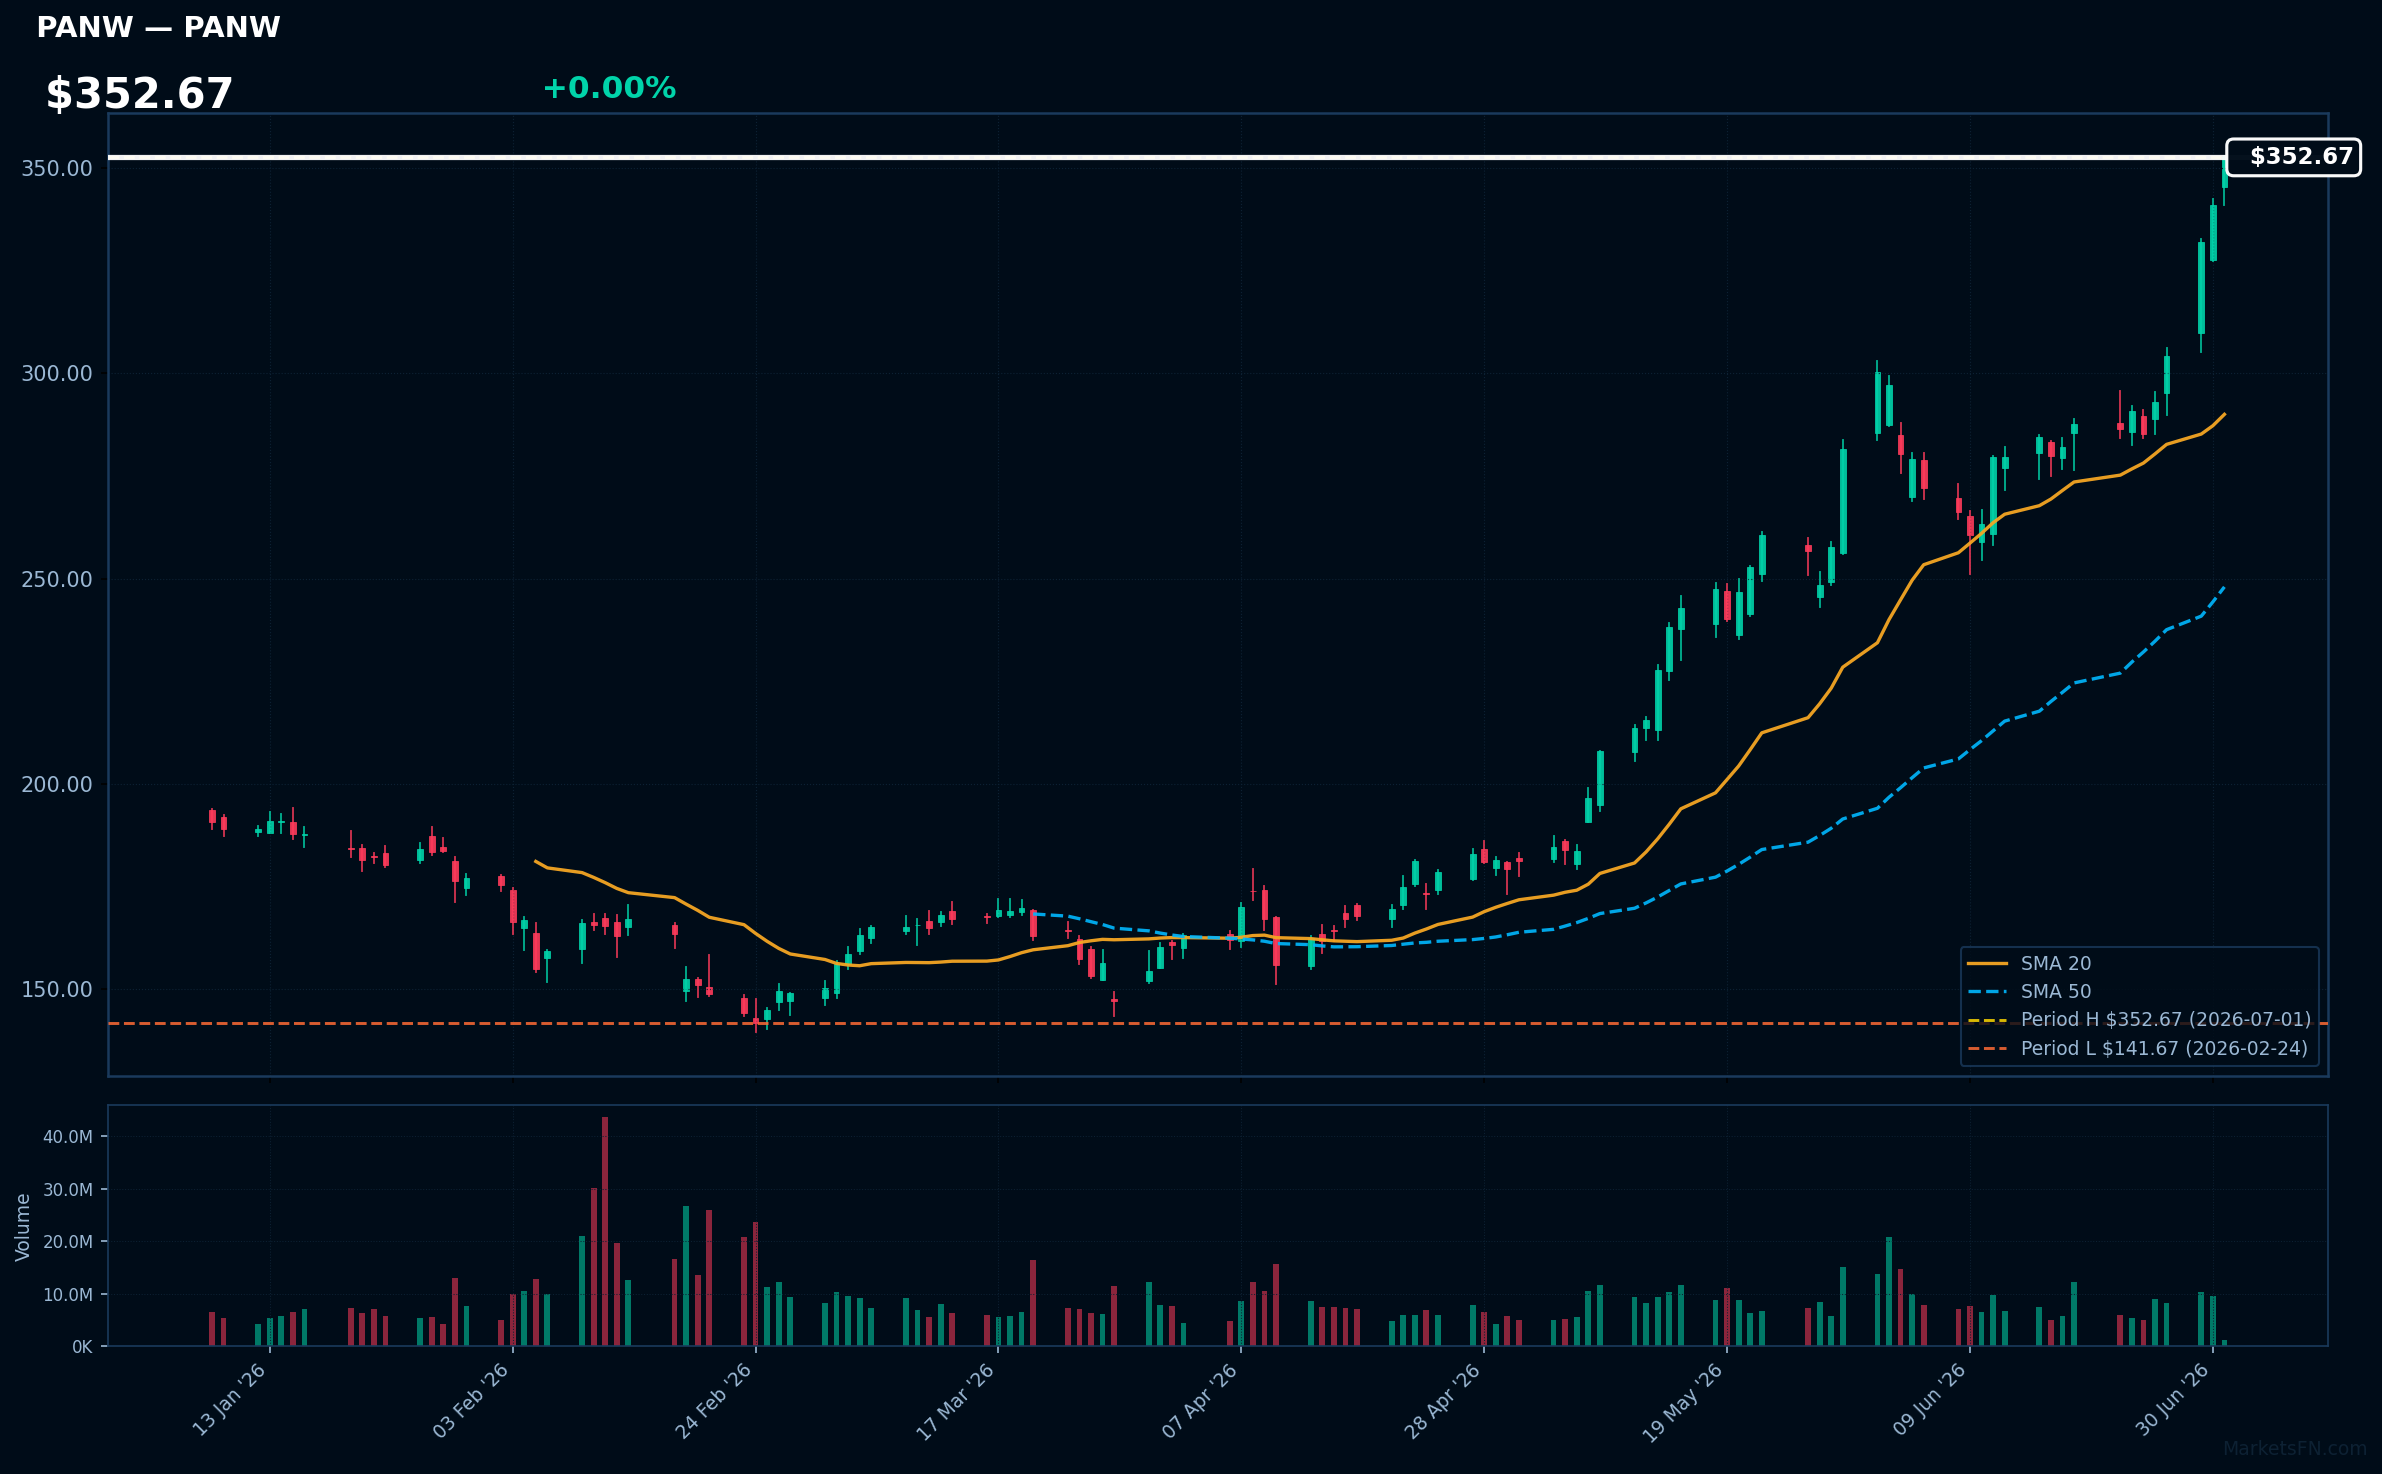
PANW | Palo Alto Networks Inc | Technology | Price Last: $352.67 | % Realized: +78.49% | RSI: 81.5 | % above MA200: +75.7% | Trend: Above MA20, MA50, MA200
Palo Alto Networks Inc is a cybersecurity company providing advanced threat prevention and security solutions. Investors should care due to its strong market position and innovative products, such as its next-generation firewalls and Prisma cloud security platform.
Palo Alto Networks Inc is in a sustained uptrend with price at $352.67, above MA20, MA50, and MA200. RSI(14) is 81.5, indicating potential overbought conditions. The stock is 0.0% below its 52-Week high, suggesting a potential breakout level.
Related headlines
- The Old-School Signal That Lit Up Palo Alto Networks Stock
- Is the Market Totally Wrong About PANW Stock?
- PANW vs CRWD vs AVGO: Morningstar Has A 'Top Pick' Trading At A 40% Discount After Earnings
- Palo Alto Networks and Deutsche Telekom Bring AI-Driven Security with Advanced Sovereignty Controls for European Regulated Industries
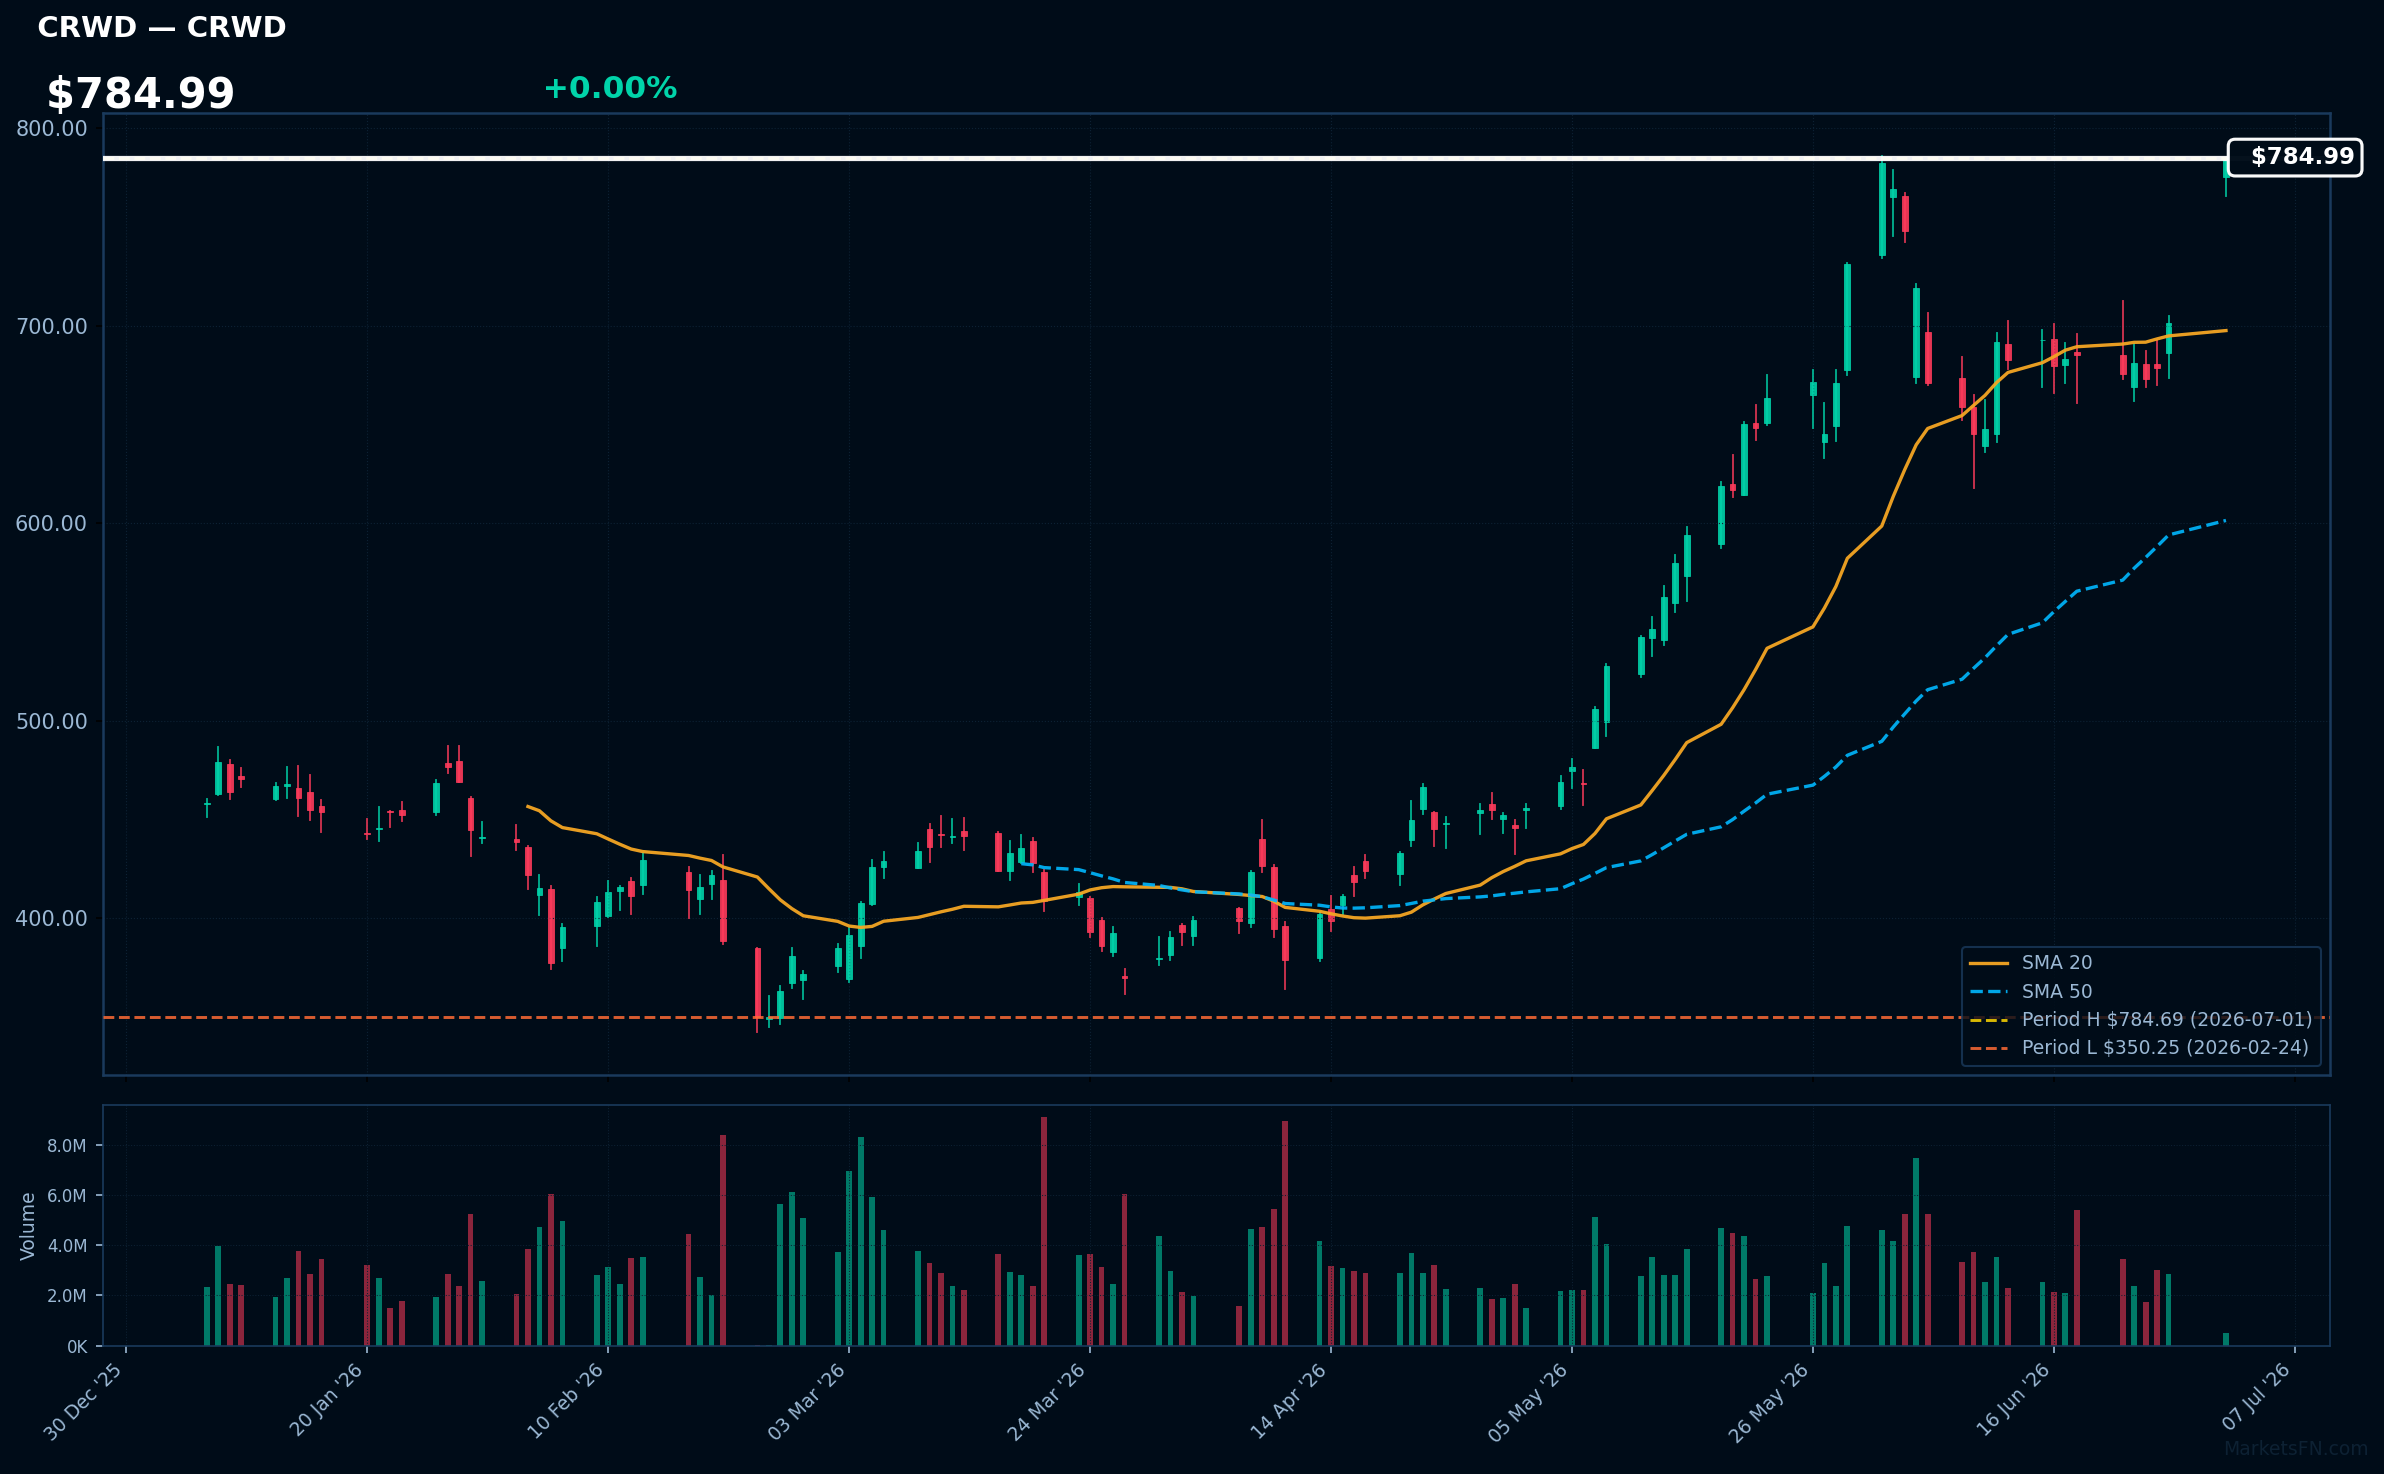
CRWD | Crowdstrike Holdings Inc | Technology | Price Last: $784.69 | % Realized: +59.47% | RSI: 72.4 | % above MA200: +57.6% | Trend: Above MA20, MA50, MA200
Crowdstrike Holdings Inc is a cybersecurity company providing cloud-delivered endpoint protection. Investors should care because its innovative Falcon platform has driven significant growth, making it a key player in the rapidly expanding cybersecurity market.
Crowdstrike's technicals indicate strong momentum: RSI(14) is 72.4, nearing overbought territory. The stock is in a sustained uptrend with price > MA20 > MA50 > MA200, and is 0.0% below its 52-Week high, suggesting a potential breakout.
Related headlines
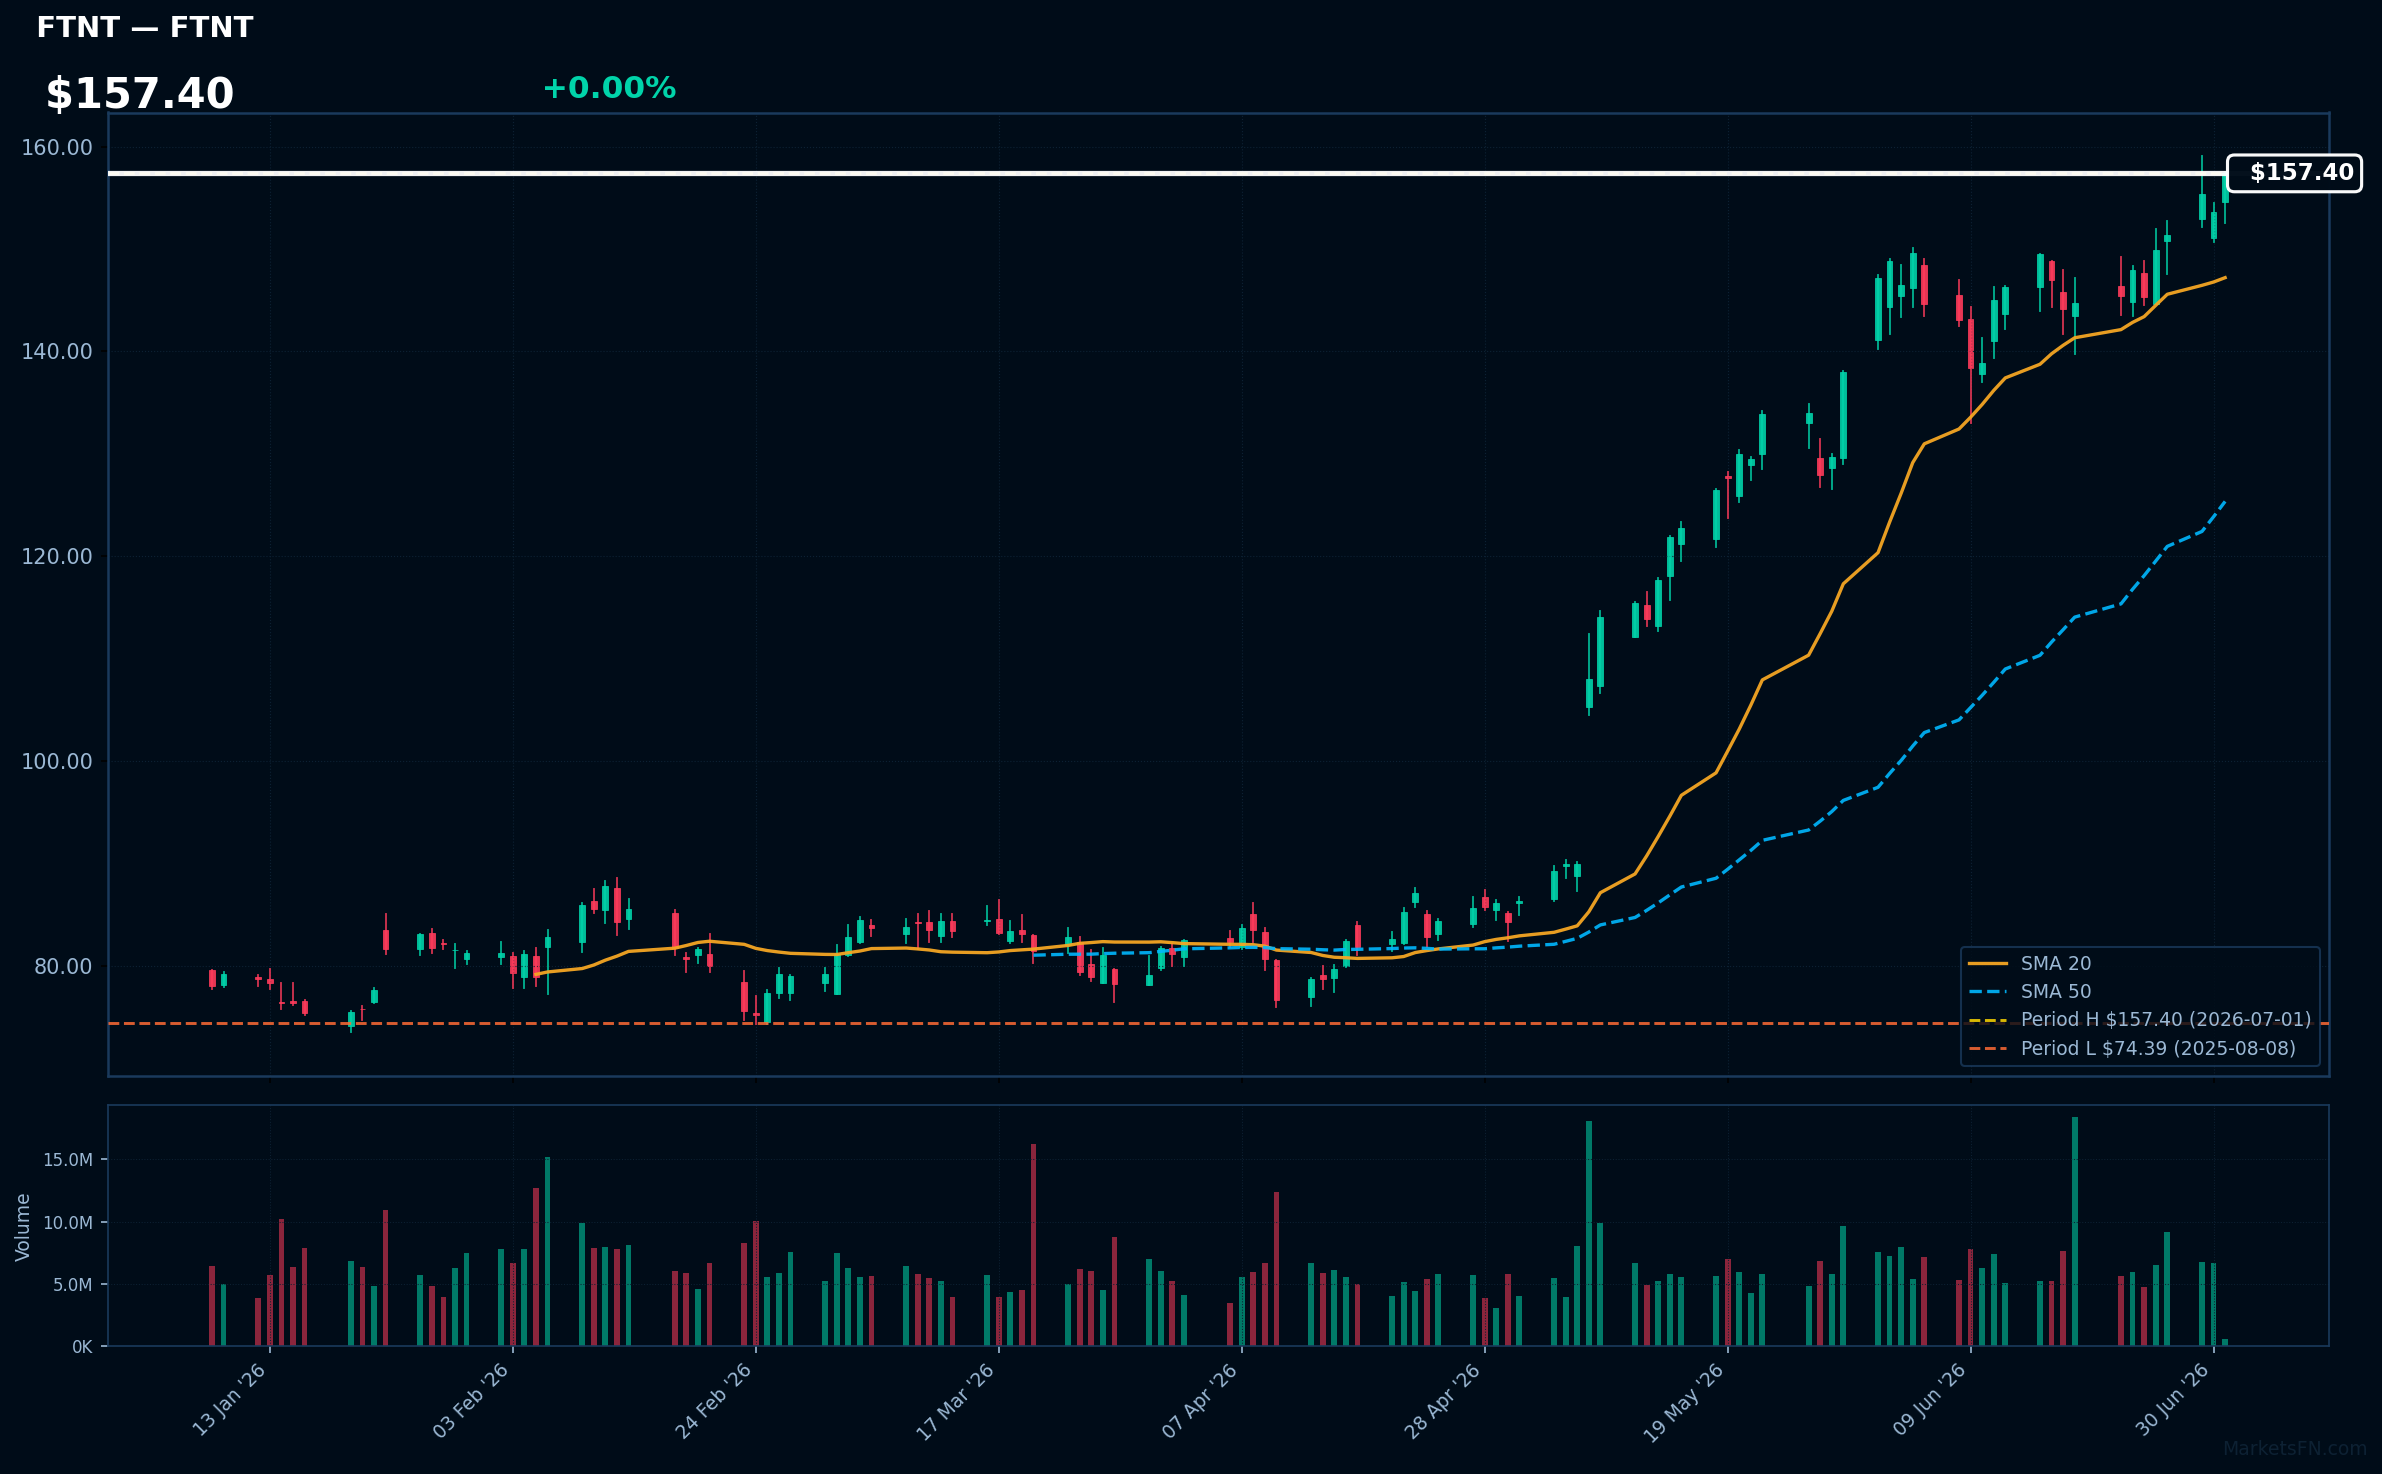
FTNT | Fortinet Inc | Technology | Price Last: $157.40 | % Realized: +53.67% | RSI: 70.6 | % above MA200: +69.7% | Trend: Above MA20, MA50, MA200
Fortinet Inc is a cybersecurity company providing network security solutions, including firewalls and threat protection. Investors should care due to its strong growth prospects driven by increasing demand for cybersecurity services.
Fortinet Inc is in a sustained uptrend with price > MA20 > MA50 > MA200, RSI(14) at 70.6, near its 52-Week high. This indicates strong momentum, potentially overbought, with a 53.7% 52-Week return, suggesting continued upward pressure.
Related headlines
- Dow Jones Medical Giant J&J Breaks Out; PNC, Iron Mountain, Fortinet In Or Near Buy Zones
- Fortinet, IBD Stock Of The Day, Gets Network Firewall Boost From AI Data Centers
- Fortinet Appoints Public Sector Leader and Tech Executive Derek Kan to Its Board of Directors
- Fortinet Launches FortiSOC, a Unified SOC Platform Powered by Agentic AI
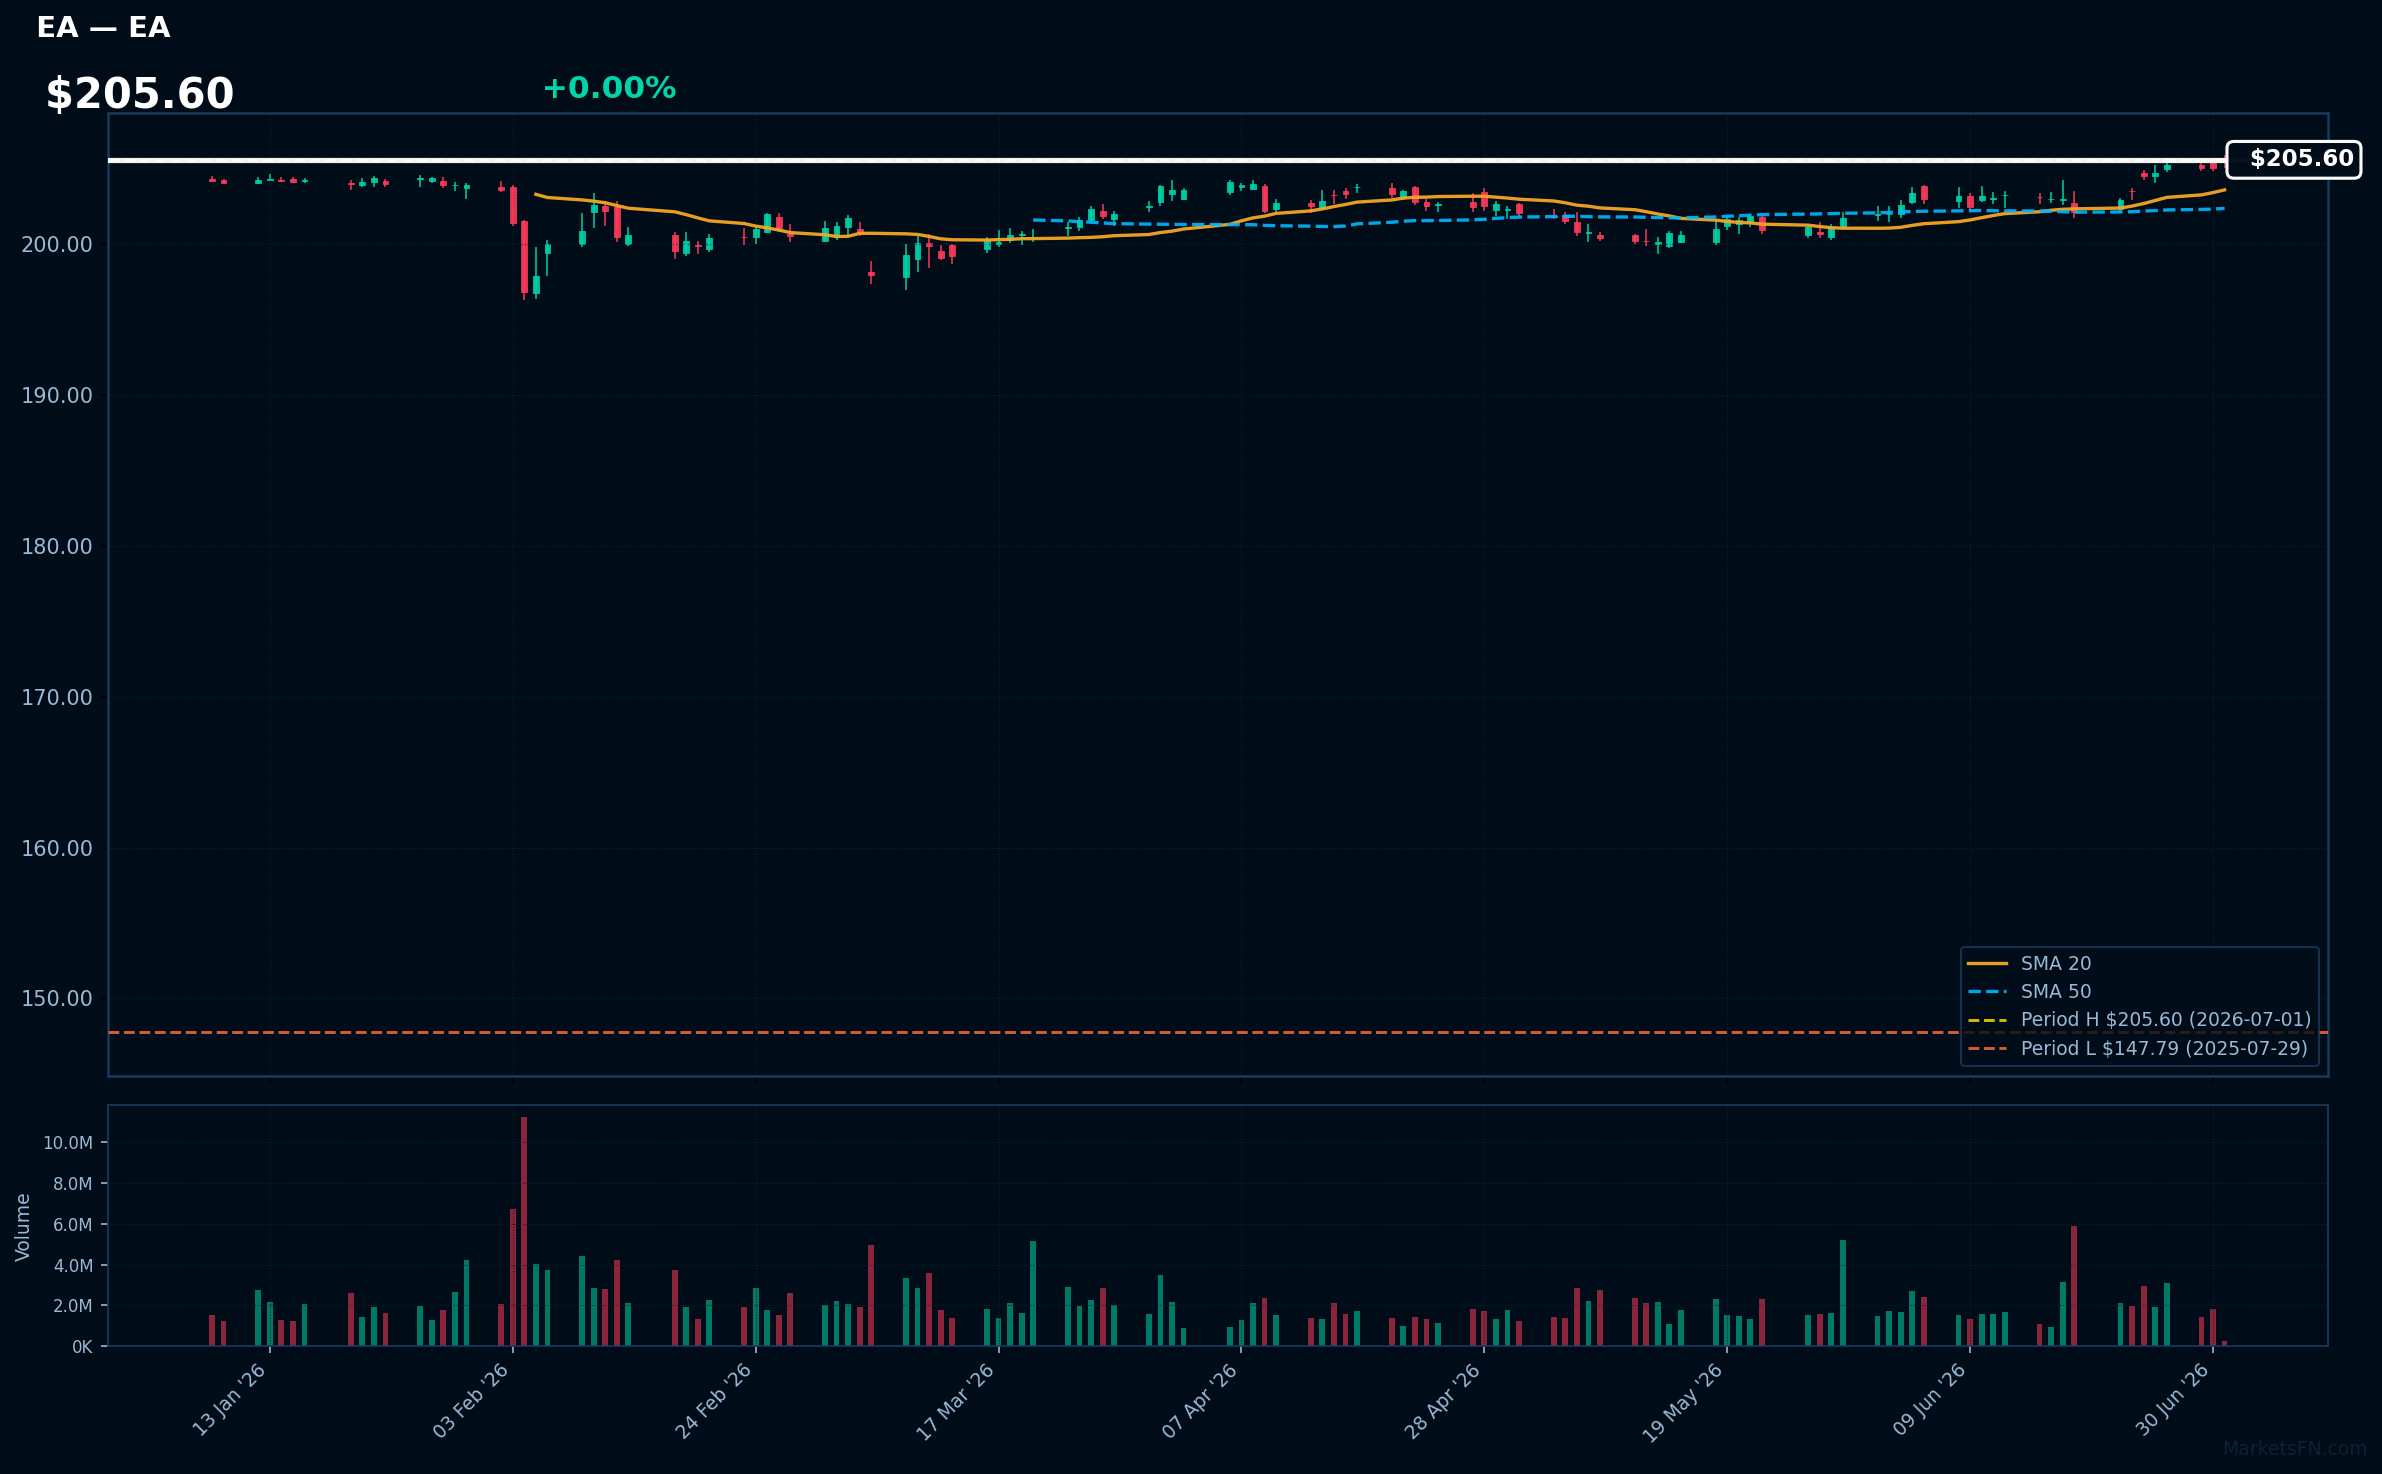
EA | Electronic Arts, Inc | Communication Services | Price Last: $205.60 | % Realized: +29.26% | RSI: 70.6 | % above MA200: +2.4% | Trend: Above MA20, MA50, MA200
Electronic Arts, Inc (EA) is a leading interactive entertainment software company that develops and publishes games such as Madden NFL, FIFA, and The Sims, making it a significant player in the gaming industry, with investors caring about its performance in this space.
EA's current technical situation indicates strong momentum with an RSI(14) of 70.6, a bullish MA alignment (price > MA20 > MA50 > MA200), and a 0.0% proximity to its 52-Week high, suggesting a potential breakout.
Related headlines
- NBCU And Gaming: Possible Merger Deals?
- EA SPORTS UFC 6 Launches Worldwide Today, Inviting Players Everywhere to Fight Their Fight
- Saudis seek EU approval for $55 billion EA deal, decision by July 22
- Oak-Eagle AcquireCo, Inc. Announces Extension of the Expiration Time and Settlement Date for the Previously Announced Tender Offers and Consent Solicitations for Any and All of Electronic Arts Inc.'s 1.850% Senior Notes Due 2031 and 2.950% Senior Notes Due 2051
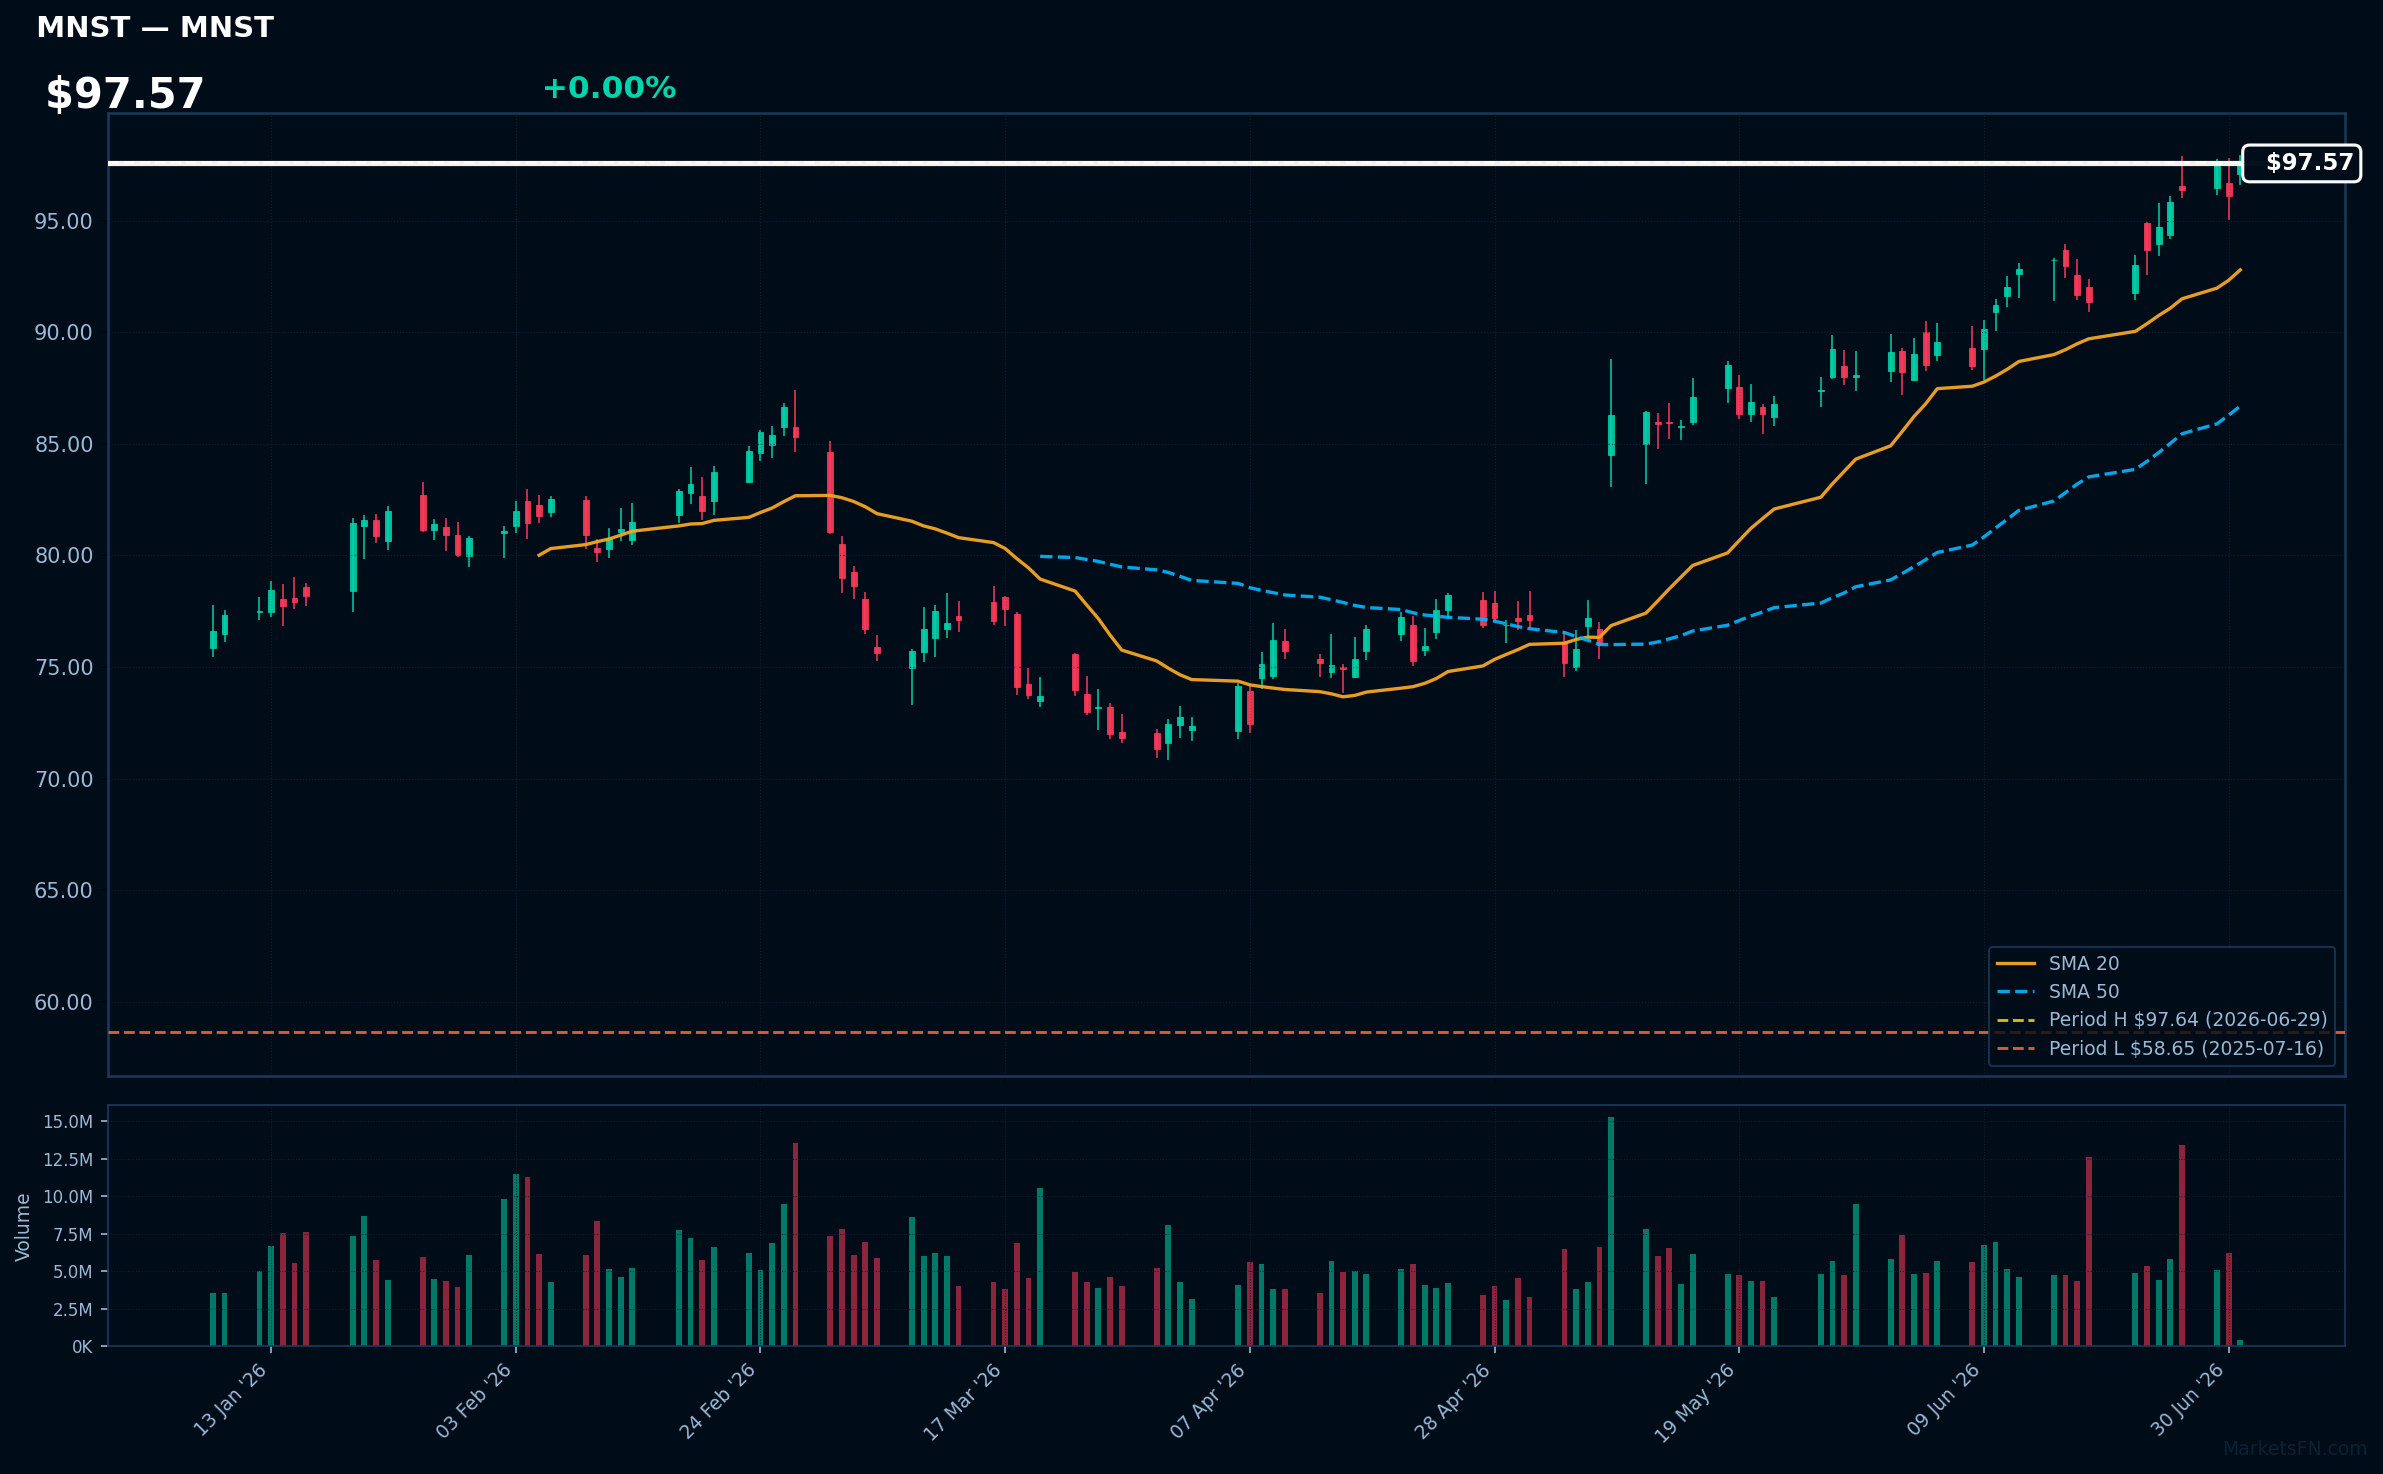
MNST | Monster Beverage Corp | Consumer Defensive | Price Last: $97.57 | % Realized: +53.56% | RSI: 71.8 | % above MA200: +26.0% | Trend: Above MA20, MA50, MA200
Monster Beverage Corp is a leading energy drink manufacturer with popular brands like Monster Energy. Investors should care due to its strong brand portfolio and growth potential in the energy drink market.
The stock shows bullish technicals with RSI(14) at 71.8, indicating strong momentum, and a sustained uptrend as price > MA20 > MA50 > MA200. It's 0.1% below its 52-Week high, nearing a potential breakout.
Related headlines
- Massive Gap-Up Propels This Monster To Record High. These Clues Point To More Gains Ahead.
- Monster Beverage Announces Participation in dbAccess Global Consumer Conference 2026
- Dow Jones Leader Amazon, AI Stock Quanta, Monster Beverage In Or Near Buy Zones
- See How Institutions Drive Monster Beverage Shares Higher
📉 Nearest to 52-Week Low
Sectors represented: Communication Services (2), Utilities (1), Healthcare (1), Real Estate (1)
| Ticker | Company | Sector | Price Last | % Realized | 52-Week Low Date | RSI | % above MA200 | Trend |
|---|---|---|---|---|---|---|---|---|
| CEG | Constellation Energy Corporation | Utilities | $239.65 | -22.17% | 2026-07-01 | 33.0 | -24.5% | Below MA20, MA50, MA200 |
| ISRG | Intuitive Surgical Inc | Healthcare | $402.79 | -25.13% | 2026-06-30 | 41.9 | -17.5% | Below MA20, MA50, MA200 |
| TMUS | T-Mobile US Inc | Communication Services | $171.79 | -28.87% | 2026-06-30 | 36.5 | -15.9% | Below MA20, MA50, MA200 |
| NFLX | Netflix Inc | Communication Services | $73.09 | -43.50% | 2026-06-25 | 33.9 | -24.1% | Below MA20, MA50, MA200 |
| CSGP | Costar Group, Inc | Real Estate | $29.22 | -64.33% | 2026-06-30 | 38.8 | -46.4% | Below MA20, MA50, MA200 |
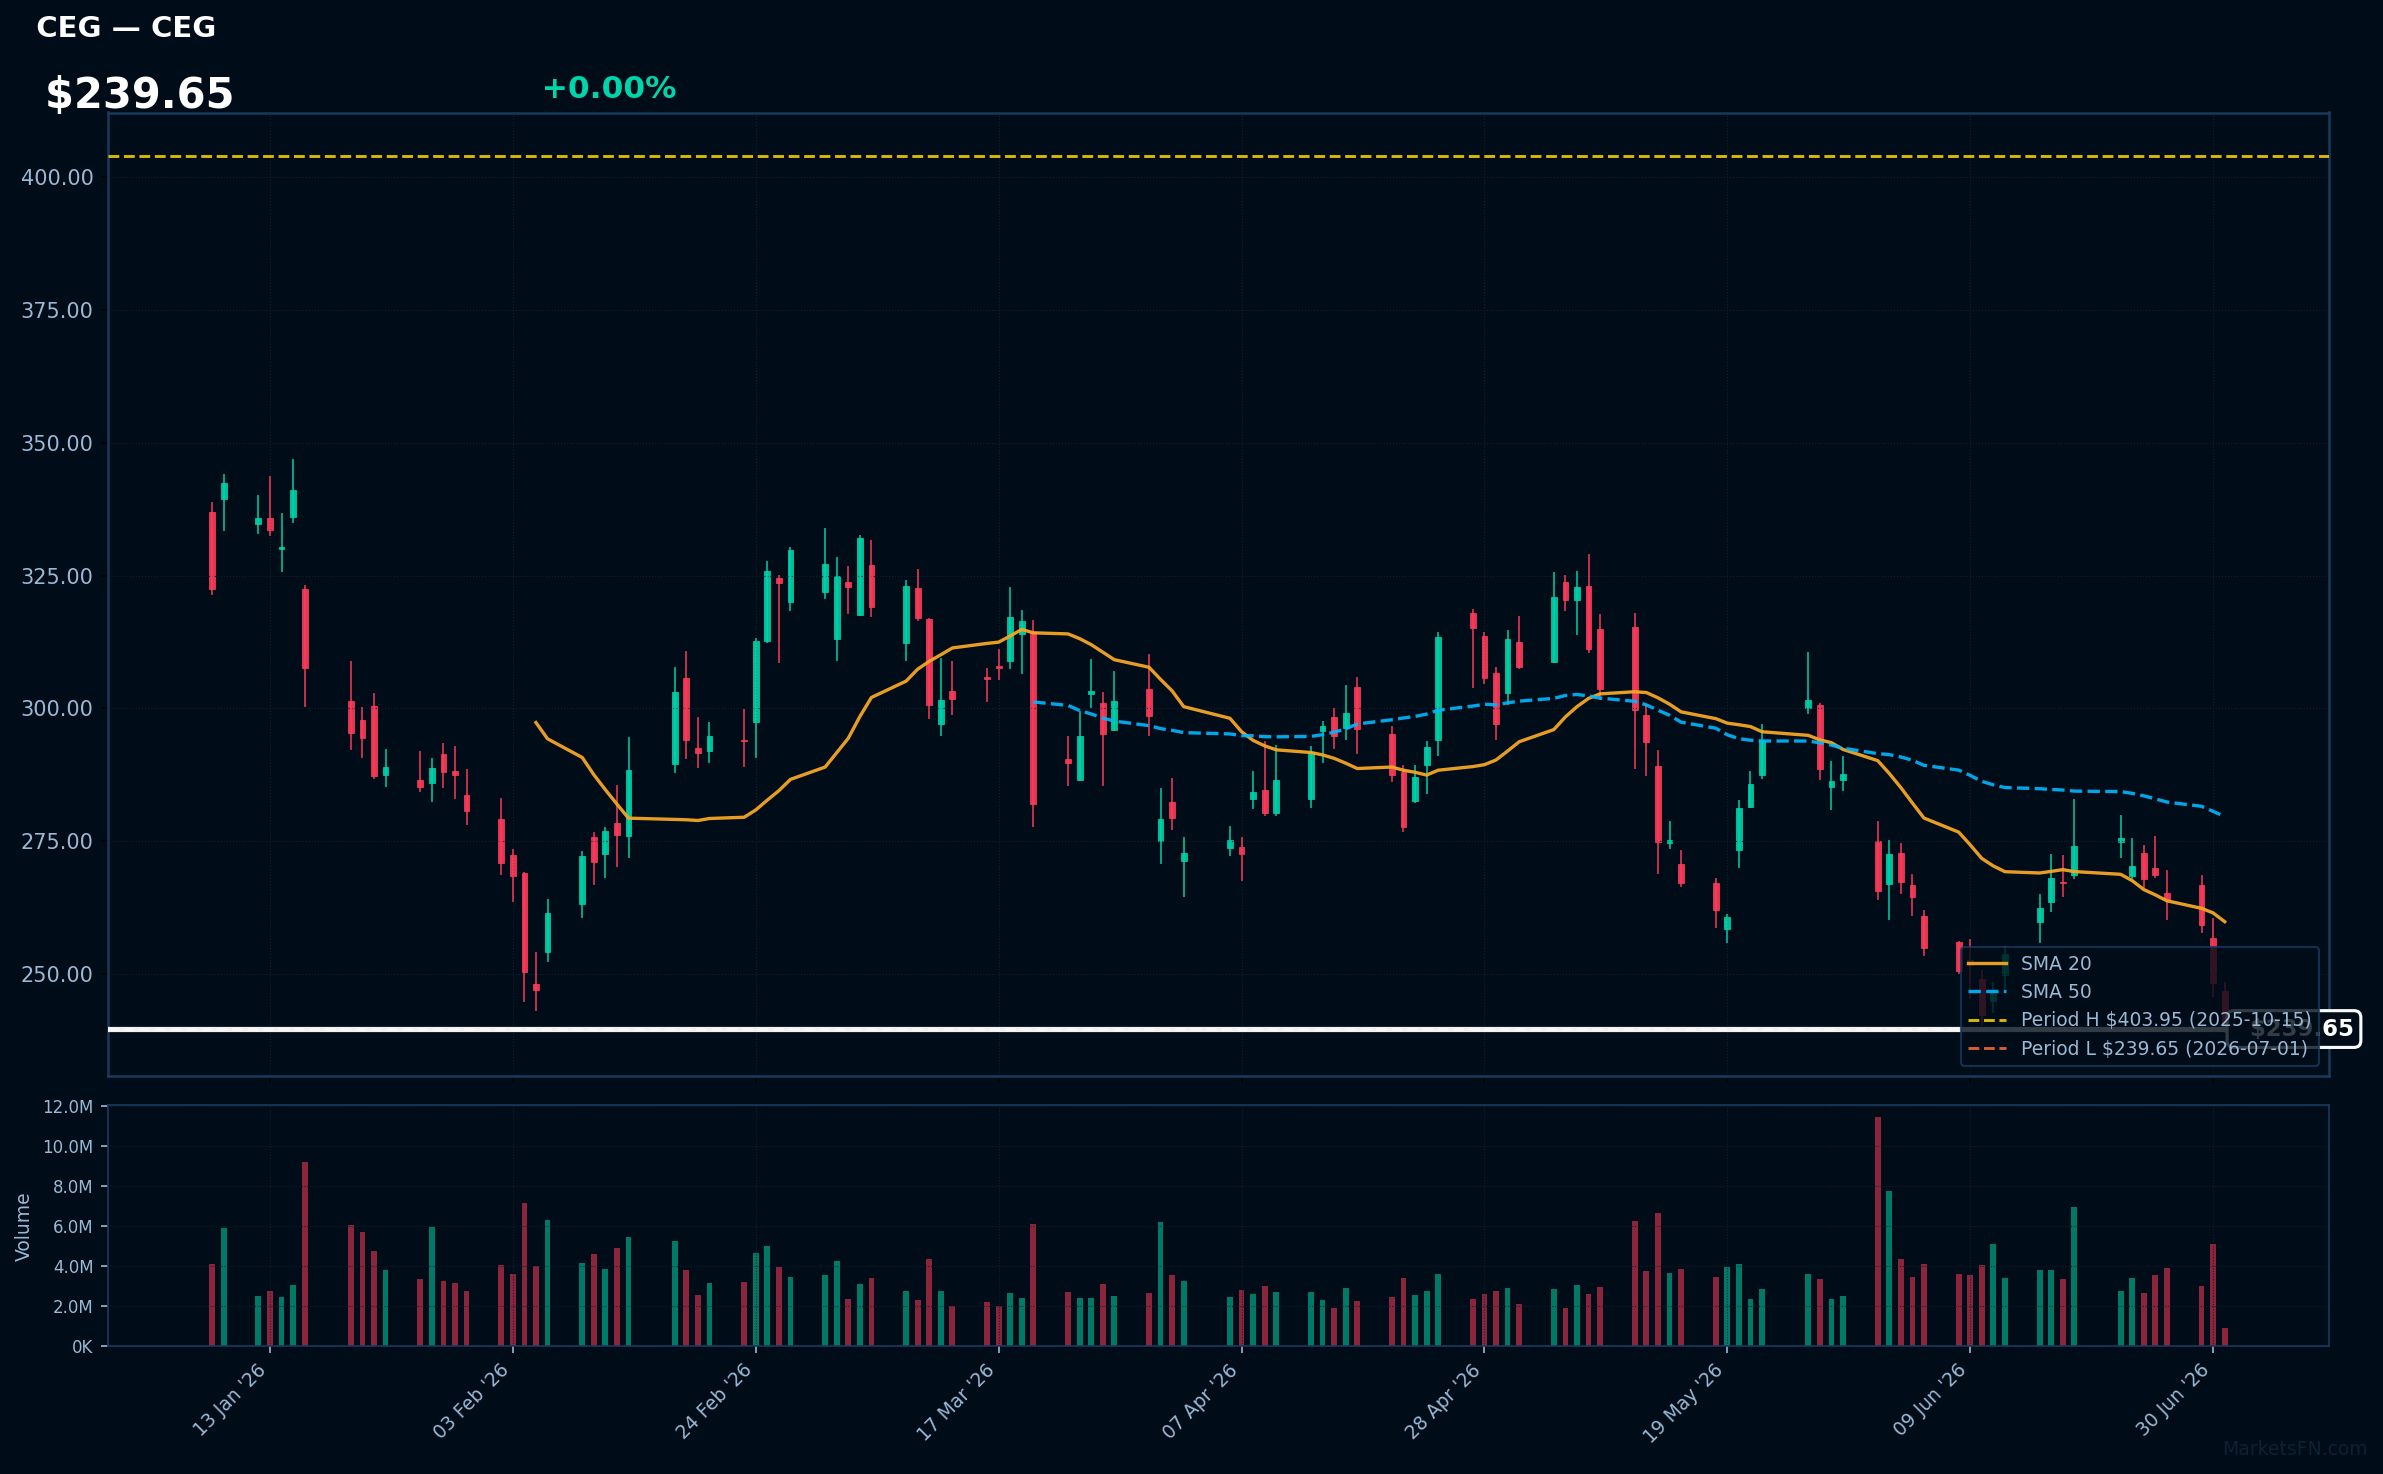
CEG | Constellation Energy Corporation | Utilities | Price Last: $239.65 | % Realized: -22.17% | RSI: 33.0 | % above MA200: -24.5% | Trend: Below MA20, MA50, MA200
Constellation Energy Corporation is a leading energy company that generates and supplies electricity and natural gas. Investors should care because its performance is tied to energy demand and pricing, impacting revenue and profitability.
CEG's technical situation is bearish, with an RSI(14) of 33.0, indicating oversold conditions, and a sustained downtrend as price ($239.65) remains below MA20, MA50, and MA200, with the stock testing its 52-Week low.
Related headlines
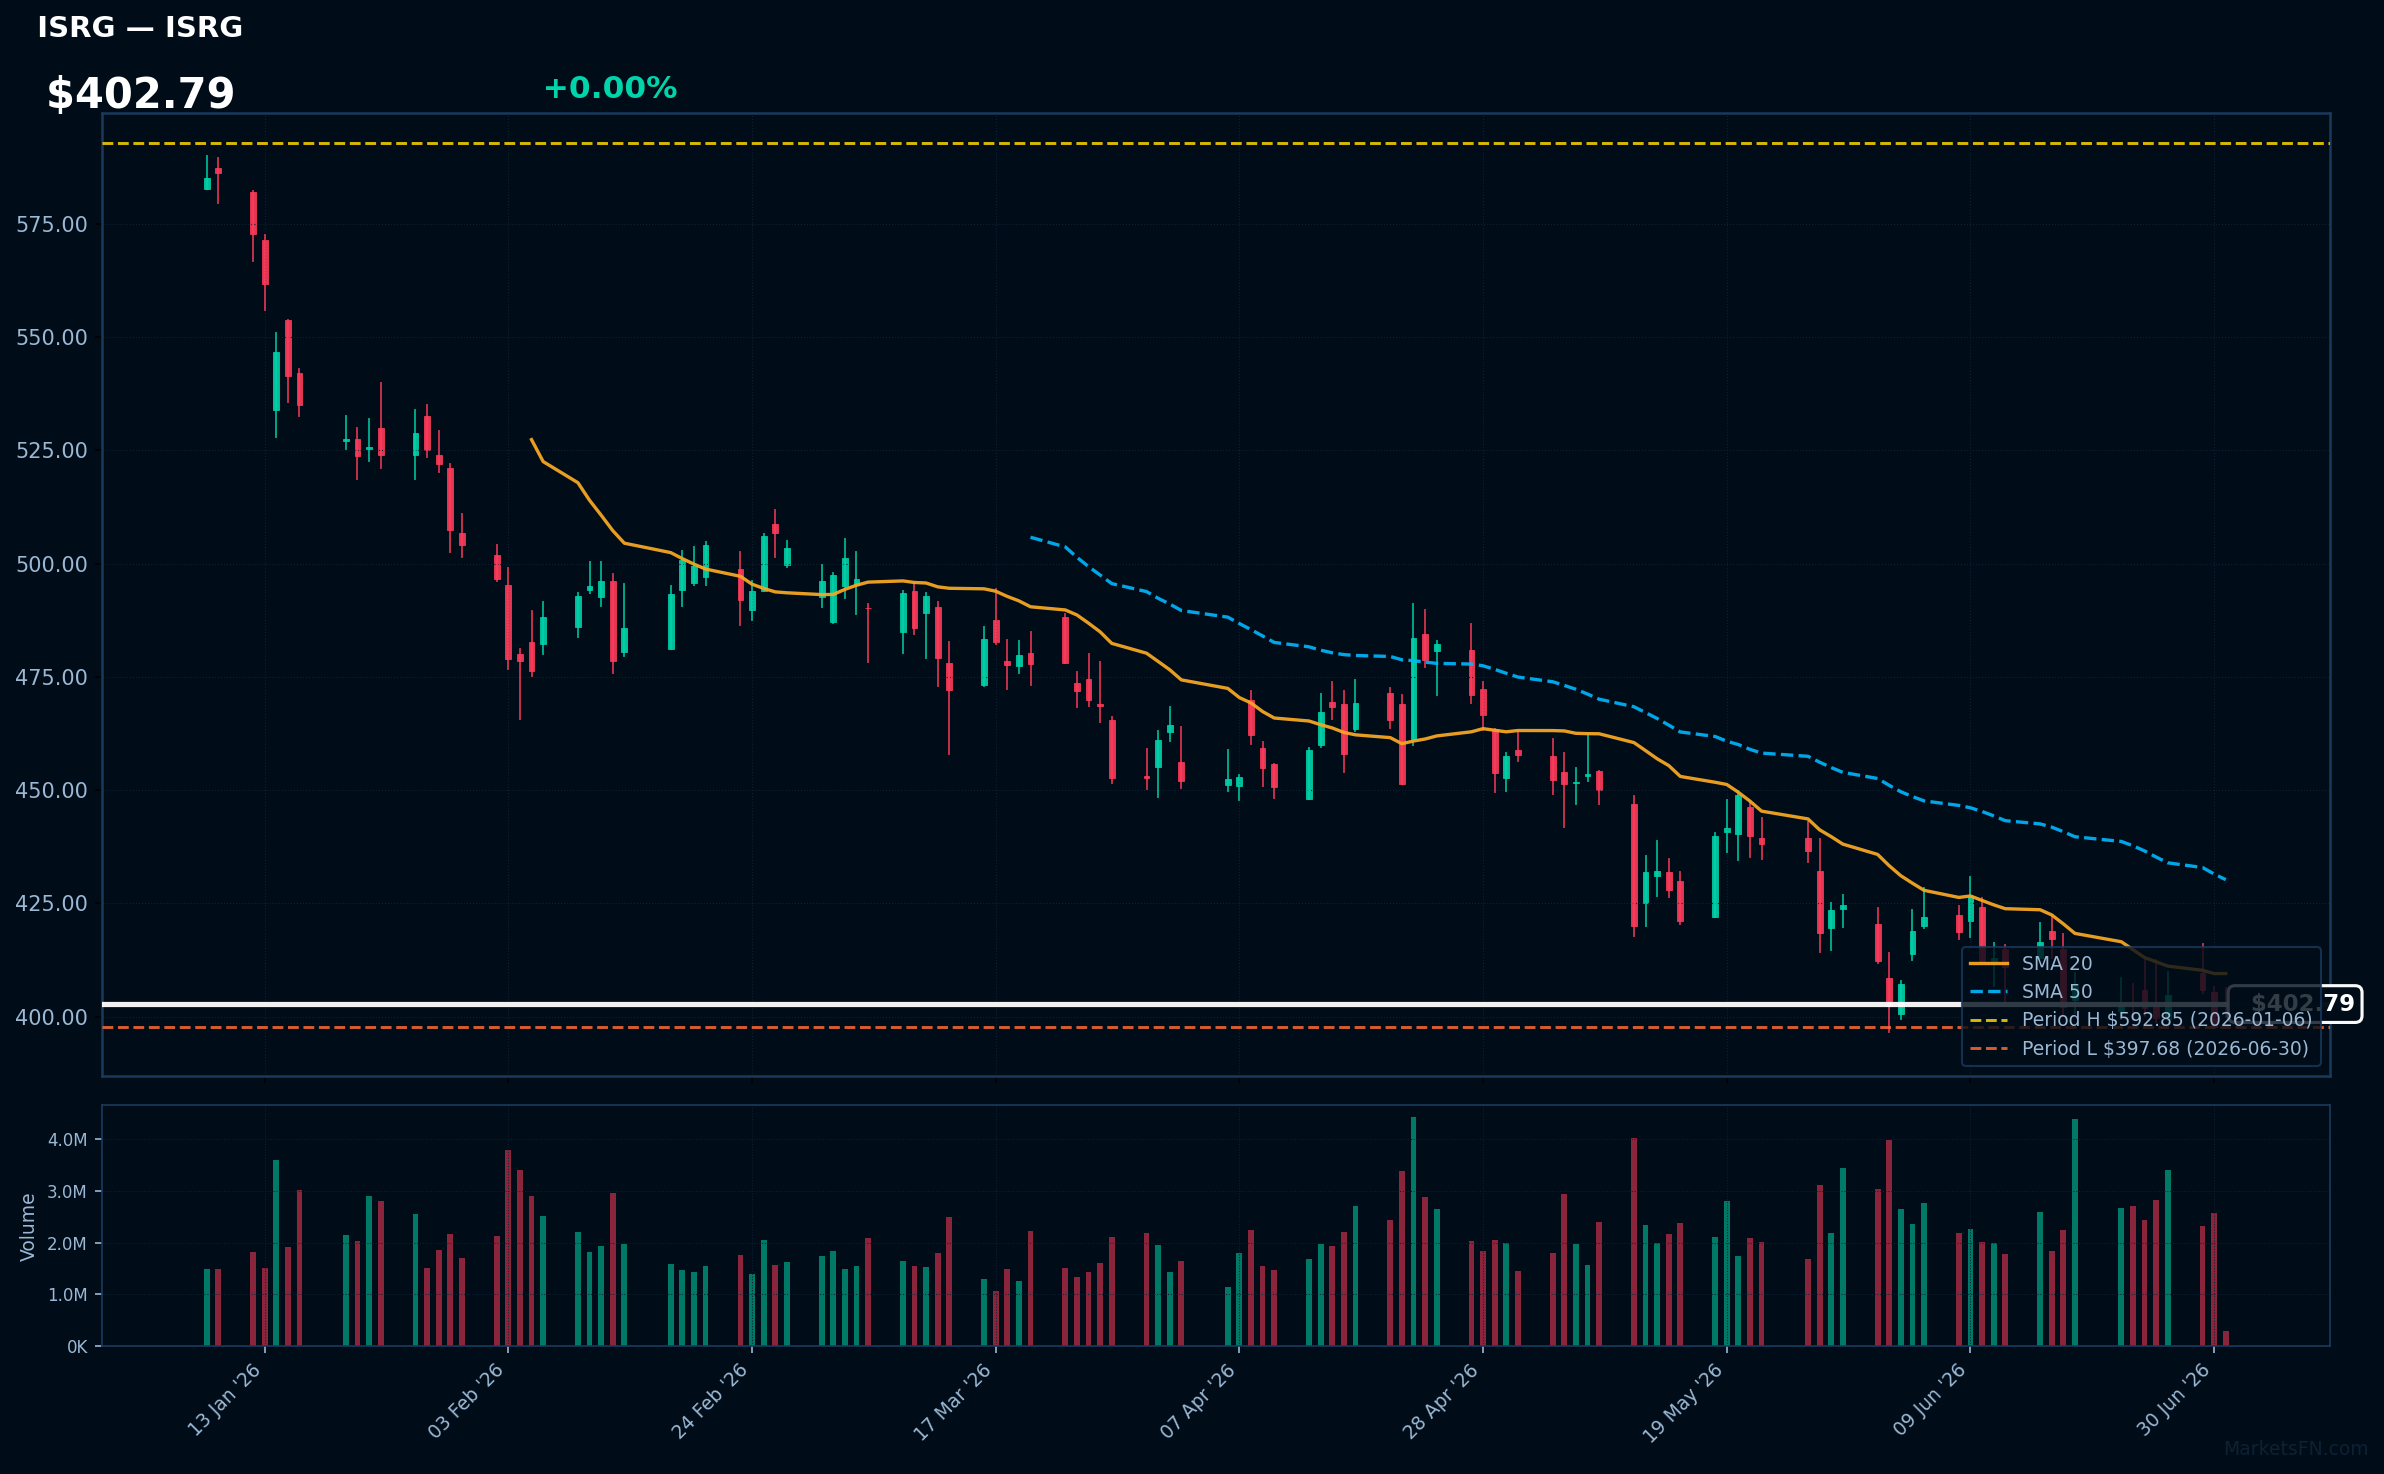
ISRG | Intuitive Surgical Inc | Healthcare | Price Last: $402.79 | % Realized: -25.13% | RSI: 41.9 | % above MA200: -17.5% | Trend: Below MA20, MA50, MA200
Intuitive Surgical Inc develops and markets robotic-assisted surgical systems, primarily the da Vinci Surgical System, enabling minimally invasive surgeries. Investors should care as its technology adoption drives growth and its market leadership position impacts the surgical robotics industry.
The stock's technical situation is bearish, with an RSI(14) of 41.9 indicating weakening momentum. The sustained downtrend is evident as price ($402.79) < MA20 < MA50 < MA200, and it's testing major support, only 1.3% above its 52-Week low.
Related headlines
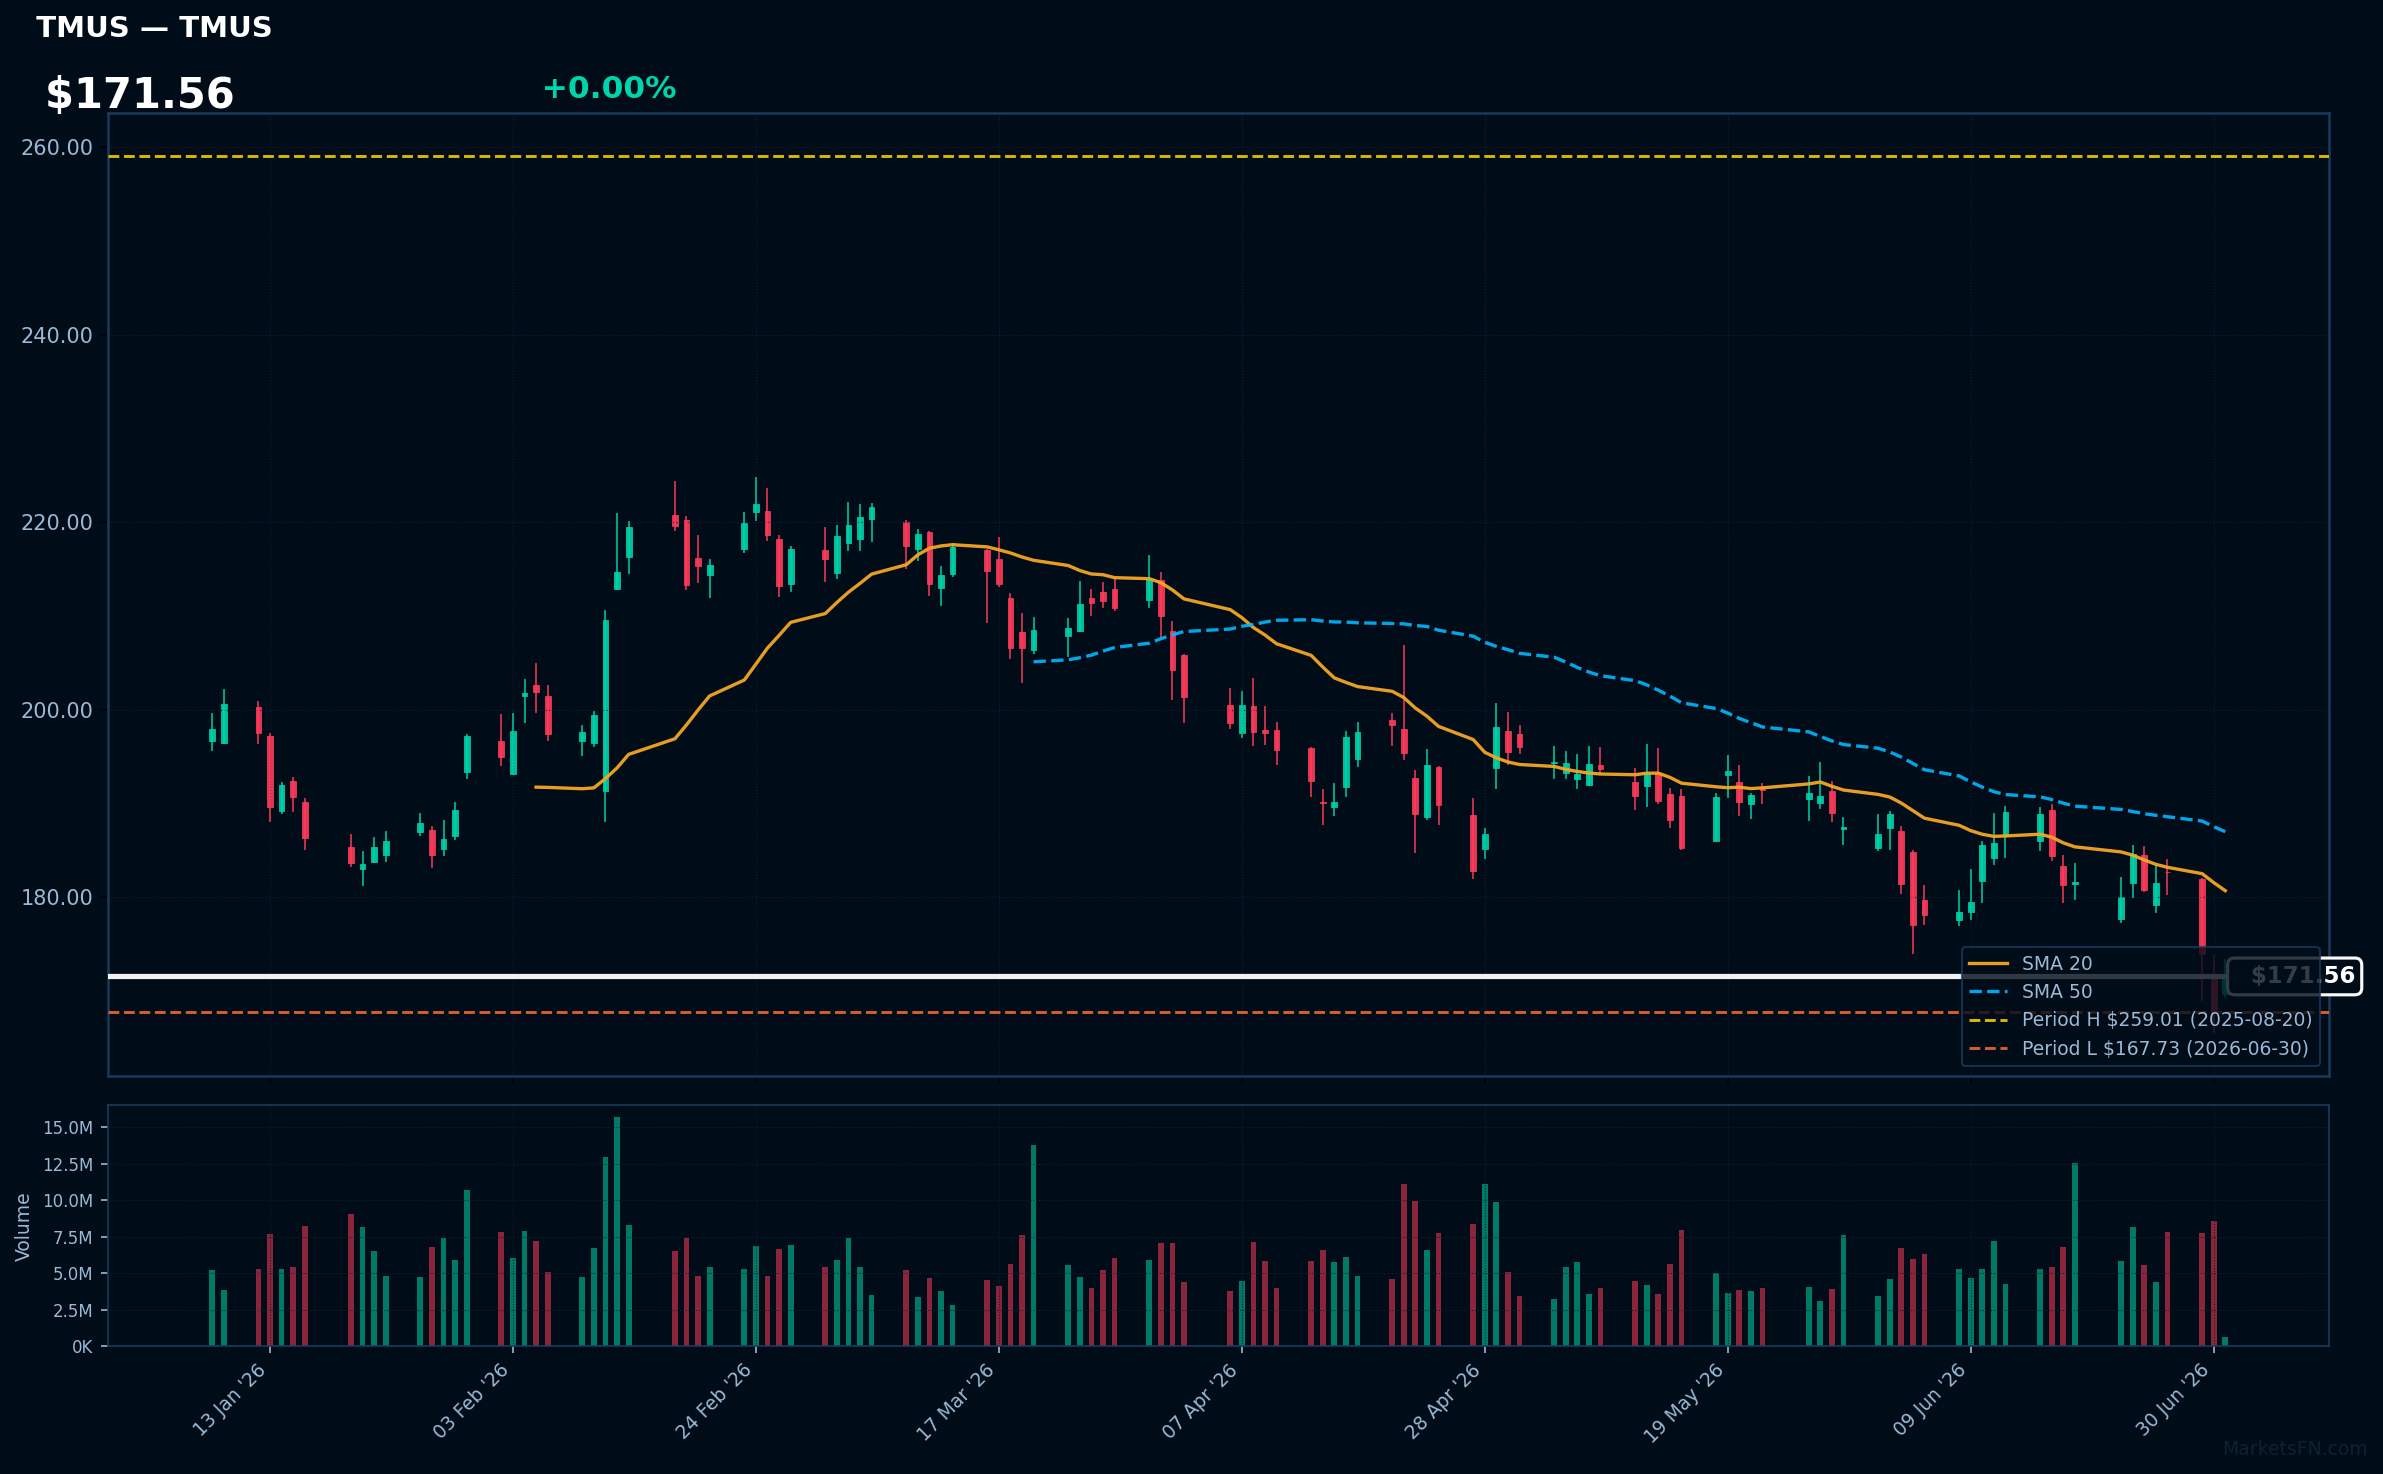
TMUS | T-Mobile US Inc | Communication Services | Price Last: $171.79 | % Realized: -28.87% | RSI: 36.5 | % above MA200: -15.9% | Trend: Below MA20, MA50, MA200
T-Mobile US Inc is a wireless network operator providing mobile services. Investors should care about its competitive positioning and growth prospects in the US telecom market, as well as its ability to execute on its 5G strategy and merger synergies.
T-Mobile US Inc is in a sustained downtrend with price ($171.56) below MA20, MA50, and MA200. The RSI(14) is 36.5, near oversold territory. The stock is 2.4% above its 52-Week low, testing major support, indicating a potential warning sign.
Related headlines
- VZ, T, TMUS Shares Under Pressure SpaceX's Starlink Mobile Service Push Rattles Telecom Stocks
- SpaceX Might Bring Mobile Phone to Market, and Verizon, AT&T, and T-Mobile Are Down
- SPCX Stock: SpaceX's Wireless Ambitions Fuel T-Mobile Acquisition Speculation
- T-Mobile to Host Q2 2026 Earnings Call on July 23, 2026

NFLX | Netflix Inc | Communication Services | Price Last: $73.09 | % Realized: -43.50% | RSI: 33.9 | % above MA200: -24.1% | Trend: Below MA20, MA50, MA200
Netflix Inc is a global streaming entertainment service offering a wide variety of TV series, documentaries, and feature films. Investors should care because its subscriber growth and content strategy drive revenue, influencing its stock performance.
NFLX is in a sustained downtrend with price ($73.09) below MA20, MA50, and MA200. The RSI(14) is 33.9, near oversold territory. It's 3.1% above its 52-Week low, testing major support, indicating a potential warning sign.
Related headlines
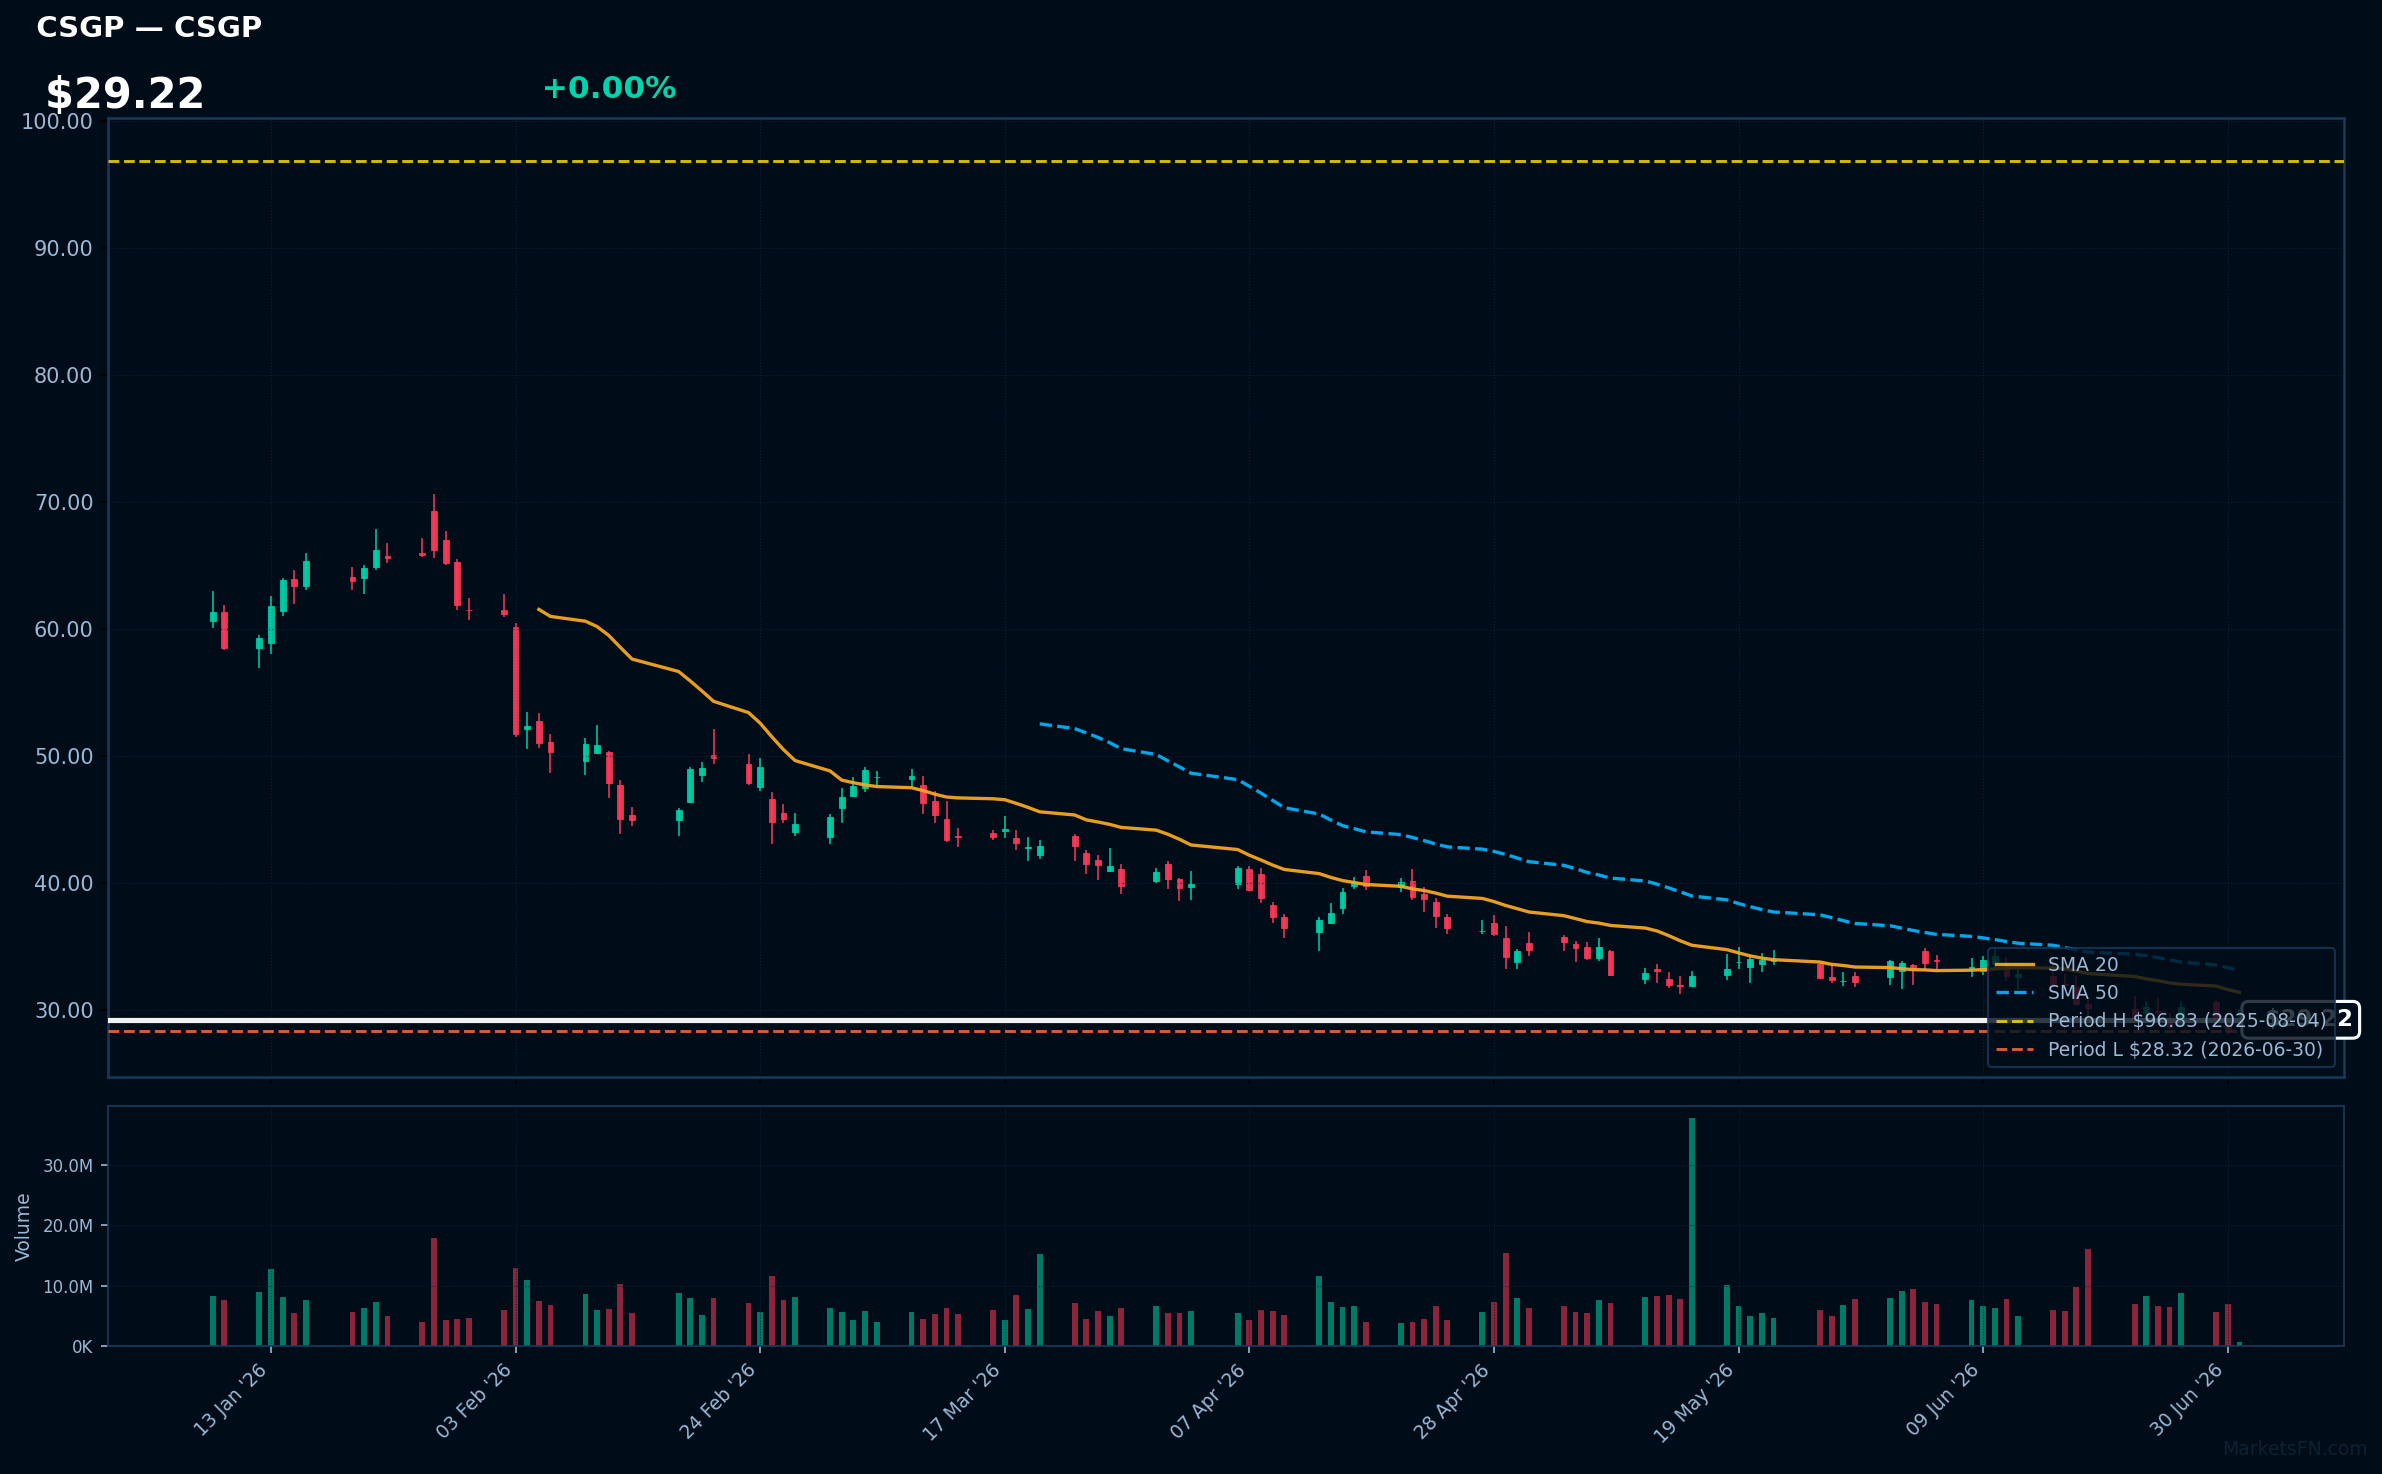
CSGP | Costar Group, Inc | Real Estate | Price Last: $29.22 | % Realized: -64.33% | RSI: 38.8 | % above MA200: -46.4% | Trend: Below MA20, MA50, MA200
Costar Group, Inc provides commercial real estate information, analytics, and marketplace services, enabling informed decisions for investors and professionals. Its databases and platforms are crucial for the industry, making it a key player in the commercial real estate ecosystem.
CSGP's technical situation is bearish, with an RSI(14) of 38.8 indicating oversold conditions, and a sustained downtrend as price ($29.22) remains below MA20, MA50, and MA200. The stock is 3.2% above its 52-Week low, testing major support.
Related headlines
- CoStar Group Invests in Wikicasa, Italys Agent-Backed Real Estate Marketplace
- CoStar Group Stockholders Overwhelmingly Reelect Director Nominees and Support Say-on-Pay at Annual Meeting of Stockholders
- Austin, San Jose Lead Apartments.com and CoStars U.S. Multifamily Momentum Index
- CoStar Group Launches Apartments.com Ai, Redefining the Future of Apartment Search
Market Commentary
The Nasdaq 100 tech stocks are currently trading near 52-week extremes, with some stocks like PANW, CRWD, FTNT, and EA at their 52-week highs, while others like CEG, ISRG, and TMUS are near their 52-week lows. This signals a strong trend in the technology sector, with some stocks exhibiting significant strength and others showing weakness.
The technology sector is being driven by various macro themes, including the ongoing cybersecurity demand driving stocks like PANW and CRWD to new highs. On the other hand, stocks like CEG and TMUS are near their 52-week lows, potentially due to sector-specific or company-specific challenges. The overall trend in the technology sector will likely be influenced by these themes.
Key levels to watch include the 52-week highs and lows for these stocks. A breakout above the 52-week high for stocks like MNST or a breakdown below the 52-week low for stocks like NFLX could be significant. Catalysts for a breakout or breakdown could include earnings reports, industry trends, or macroeconomic developments. Monitoring these levels and potential catalysts will be crucial for investors.
Methodology: All 101 Nasdaq 100 constituents screened. 52-week high = highest daily close over the past 252 trading days (approx. 1 year). 52-week low = lowest daily close over the same period. Distance = (current price / extreme − 1) × 100. Technical indicators computed on up to 1 year of daily OHLCV data.
Disclaimer: For informational purposes only. Not investment advice. Past performance is not indicative of future results.