Natural Gas: Down 3.1% to $3.19 — Above MA50 ($2.84) — Constructive
· Commodities · QuoteReporter
Natural Gas: Down 3.1% to $3.19 — Above MA50 ($2.84) — Constructive
Analysis Date: June 01, 2026
📊 Current Market Data
CURRENT PRICE
$3.19
DAILY CHANGE
-3.07%
WEEKLY CHANGE
+9.70%
52W HIGH
$7.83
52W LOW
$2.48
💡 Key Market Factors
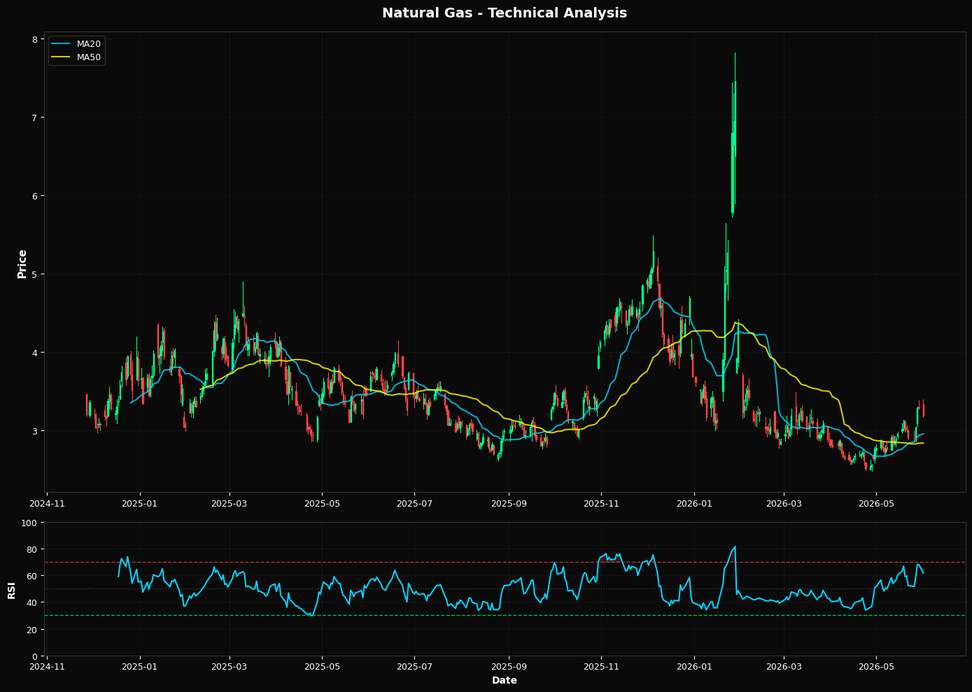
Natural gas is currently navigating a complex landscape, but the most pressing factor today is its technical positioning, which suggests a potential upward momentum despite a recent pullback. The price of natural gas stands at $3.19, having declined by 3.07% on the day, yet it has gained 9.70% over the week. This indicates a strong recovery from recent lows, supported by a Relative Strength Index (RSI) of 61.7, which is above the neutral 50 level, suggesting bullish momentum. The price is also trading above its 20-day and 50-day moving averages ($2.96 and $2.84, respectively), reinforcing a short-term bullish bias. However, it remains below the 200-day moving average of $3.43, indicating that while the short-term trend is positive, the longer-term trend has yet to confirm a reversal. The nearest Fibonacci resistance at $4.52 could be a significant hurdle, but if breached, it would signal a robust continuation of the upward trend. From a macroeconomic perspective, the impact of the U.S. dollar (USD) is particularly significant for natural gas at this juncture. A stronger USD typically exerts downward pressure on commodity prices, including natural gas, by making them more expensive for holders of other currencies. However, with the Federal Reserve maintaining a cautious stance on interest rates, any dovish signals could weaken the USD, providing a tailwind for natural gas prices. Inflationary pressures, while relevant, are currently less impactful than currency dynamics, as the market has largely priced in existing inflation expectations. Thus, the USD's trajectory remains a critical macro driver for natural gas. A key risk that could alter the current outlook for natural gas is a sudden shift in weather patterns, particularly as we approach the winter season. An unexpected cold snap could significantly increase demand for heating, thereby driving prices higher. Conversely, milder-than-expected weather could dampen demand and weigh on prices. Additionally, geopolitical developments affecting major natural gas producers or supply routes could also serve as a catalyst for price volatility. The market may be underpricing the potential for such disruptions, given the current focus on technical and macroeconomic factors. Looking ahead, the upcoming U.S. Federal Reserve meeting could serve as a pivotal moment for natural gas prices. Any indications of a shift in monetary policy that affects the USD could either confirm or invalidate the current bullish technical setup. A dovish Fed could weaken the USD, providing further support for natural gas prices, while a hawkish stance could strengthen the USD and apply downward pressure. Investors should closely monitor the Fed's language and any changes in economic projections, as these will be crucial in shaping the near-term trajectory of natural gas.📈 Technical Indicators Summary
RSI (14)
61.7
50-Day MA
$2.84
200-Day MA
$3.43
Fib Level
38.2%
📊 Technical Analysis Chart (18-Month View)
📐 Fibonacci Retracement Analysis
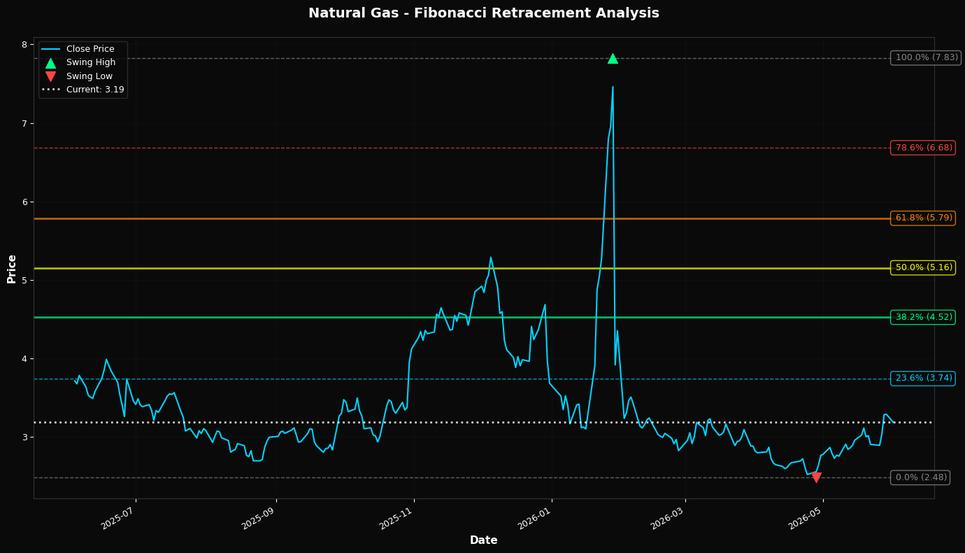
🎯 Key Trading Levels
Key Fibonacci Levels:
- 38.2%: $4.52
- 50.0%: $5.16
- 61.8%: $5.79
Support: $2.48 (Swing Low), $2.84 (50-Day MA)
Resistance: $7.83 (Swing High)
Disclaimer
The content on MarketsFN.com is provided for educational and informational purposes only. It does not constitute financial advice, investment recommendations, or trading guidance. All investments involve risks, and past performance does not guarantee future results. You are solely responsible for your investment decisions and should conduct independent research and consult a qualified financial advisor before acting. MarketsFN.com and its authors are not liable for any losses or damages arising from your use of this information.