Palladium: Up 0.2% to $1202.00 — Bearish — Below MA50 & MA200
· Commodities · QuoteReporter
Palladium: Up 0.2% to $1202.00 — Bearish — Below MA50 & MA200
Analysis Date: July 01, 2026
📊 Current Market Data
CURRENT PRICE
$1202.00
DAILY CHANGE
+0.17%
WEEKLY CHANGE
+3.50%
52W HIGH
$2169.90
52W LOW
$1082.00
💡 Key Market Factors
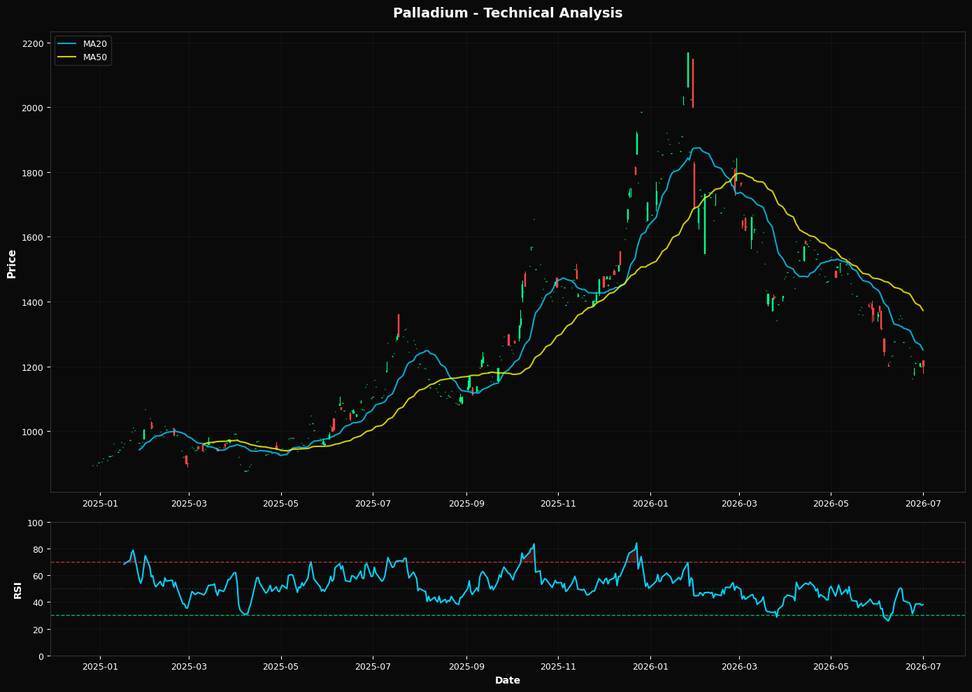
Palladium's recent price action suggests a potential rebound, but macroeconomic headwinds, particularly the strength of the U.S. dollar, remain a formidable obstacle. With palladium priced at $1202.00, a daily increase of +0.17% and a weekly gain of +3.50%, the commodity is attempting to recover from its 52-week low of $1082.00. However, the U.S. dollar's strength, driven by the Federal Reserve's hawkish stance on interest rates, is exerting downward pressure on palladium prices. As the Fed continues to prioritize inflation control, the dollar's appreciation makes dollar-denominated commodities like palladium more expensive for foreign buyers, potentially dampening demand. From a technical perspective, palladium's Relative Strength Index (RSI) at 38.0 indicates that the commodity is approaching oversold territory, suggesting a potential buying opportunity. However, the current price remains below key moving averages: the 20-day MA at $1250.80, the 50-day MA at $1372.64, and the 200-day MA at $1516.55. This bearish alignment underscores the prevailing downtrend. The nearest Fibonacci support level at 61.8% is at $1497.58, far above the current price, indicating significant resistance to any upward movement. The technical setup suggests a cautious outlook, with a directional bias towards further downside unless a strong catalyst emerges. A key risk that could alter palladium's trajectory is a shift in Federal Reserve policy. Should upcoming economic data, such as the Consumer Price Index (CPI), indicate that inflation is cooling faster than anticipated, the Fed might adopt a more dovish stance. This could weaken the U.S. dollar, providing relief to palladium prices by making them more attractive to international buyers. Conversely, stronger-than-expected inflation data could reinforce the Fed's current policy path, further pressuring palladium. Looking ahead, the next CPI release will be crucial in confirming or invalidating this outlook. A softer inflation print could signal a potential pivot in Fed policy, easing the dollar's strength and providing a tailwind for palladium. Investors should closely monitor this data point, as it will likely dictate the near-term direction of both the U.S. dollar and palladium prices.📈 Technical Indicators Summary
RSI (14)
38.0
50-Day MA
$1372.64
200-Day MA
$1516.55
Fib Level
61.8%
📊 Technical Analysis Chart (18-Month View)
📐 Fibonacci Retracement Analysis
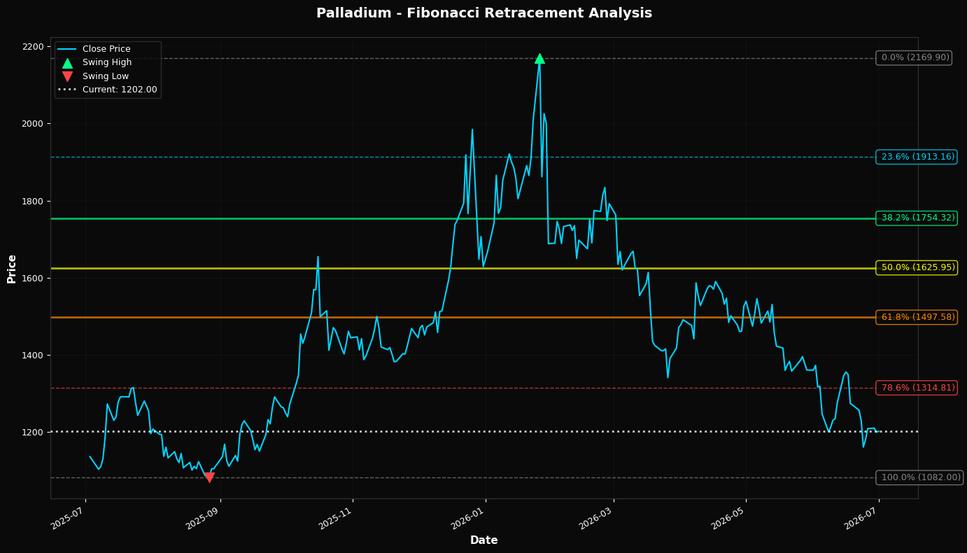
🎯 Key Trading Levels
Key Fibonacci Levels:
- 38.2%: $1754.32
- 50.0%: $1625.95
- 61.8%: $1497.58
Support: $1082.00 (Swing Low), $1372.64 (50-Day MA)
Resistance: $2169.90 (Swing High)
Disclaimer
The content on MarketsFN.com is provided for educational and informational purposes only. It does not constitute financial advice, investment recommendations, or trading guidance. All investments involve risks, and past performance does not guarantee future results. You are solely responsible for your investment decisions and should conduct independent research and consult a qualified financial advisor before acting. MarketsFN.com and its authors are not liable for any losses or damages arising from your use of this information.