Palladium: Up 0.9% to $1373.00 — Bearish — Below MA50 & MA200
· Commodities · QuoteReporter
Palladium: Up 0.9% to $1373.00 — Bearish — Below MA50 & MA200
Analysis Date: June 01, 2026
📊 Current Market Data
CURRENT PRICE
$1373.00
DAILY CHANGE
+0.88%
WEEKLY CHANGE
+1.10%
52W HIGH
$2169.90
52W LOW
$957.00
💡 Key Market Factors
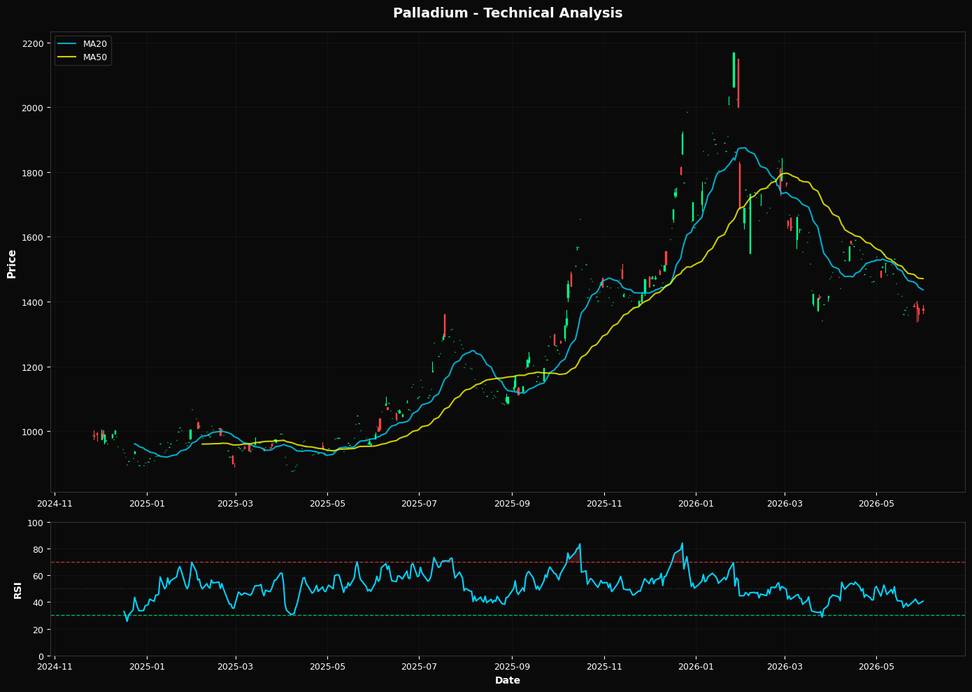
Palladium's current price action suggests a potential rebound, but macroeconomic headwinds, particularly the strength of the U.S. dollar, remain a formidable obstacle. The dollar's appreciation, driven by the Federal Reserve's hawkish stance on interest rates, continues to exert downward pressure on palladium prices. As the Fed maintains its commitment to controlling inflation, the resulting higher interest rates bolster the dollar, making dollar-denominated commodities like palladium more expensive for foreign buyers. This dynamic is crucial, as it directly impacts demand and could cap any significant price recovery in the near term. From a technical perspective, palladium is in a precarious position. The Relative Strength Index (RSI) at 40.6 indicates that the commodity is approaching oversold territory, suggesting potential for a price bounce. However, the current price of $1373.00 is below all major moving averages—MA20 at $1436.22, MA50 at $1470.88, and MA200 at $1503.31—signaling a bearish trend. The nearest Fibonacci support at 61.8% is at $1447.09, which is above the current price, indicating that palladium would need to break through this level to confirm any bullish reversal. Given these technical indicators, the directional bias remains bearish unless a significant catalyst emerges. A key risk that could alter the palladium market's trajectory is a shift in automotive demand, particularly from the Chinese market. As palladium is a critical component in catalytic converters, any increase in automotive production or a shift towards stricter emissions standards could spur demand. Conversely, a slowdown in the Chinese economy or a pivot towards electric vehicles, which do not require palladium, could further dampen demand. This is a critical factor that the market may be underpricing, given the current focus on macroeconomic indicators. Looking ahead, the upcoming U.S. inflation data release will be pivotal. Should inflation show signs of easing, it could lead to a reassessment of the Fed's rate hike trajectory, potentially weakening the dollar and providing a tailwind for palladium prices. Conversely, persistently high inflation figures would likely reinforce the Fed's current policy path, maintaining pressure on palladium. This data point will be crucial in confirming or invalidating the current bearish outlook for palladium.📈 Technical Indicators Summary
RSI (14)
40.6
50-Day MA
$1470.88
200-Day MA
$1503.31
Fib Level
61.8%
📊 Technical Analysis Chart (18-Month View)
📐 Fibonacci Retracement Analysis
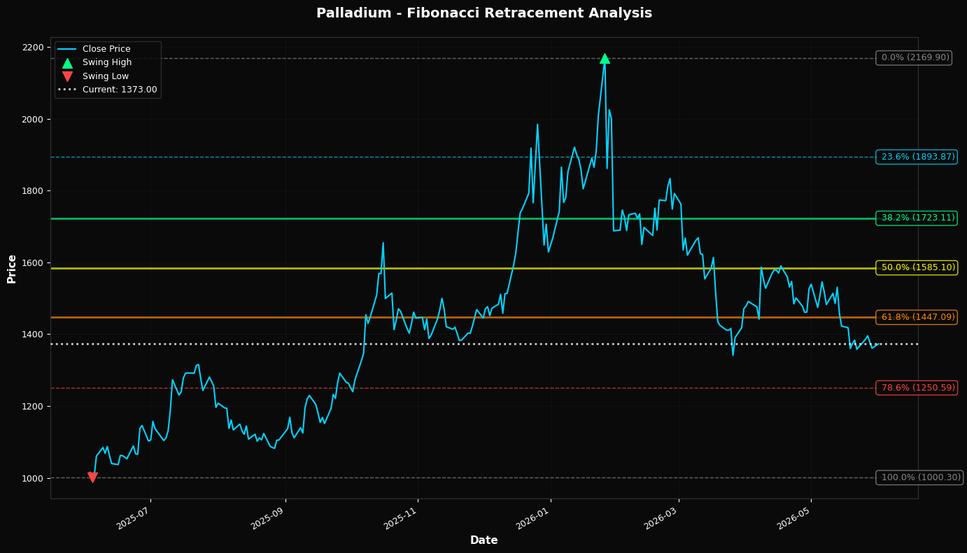
🎯 Key Trading Levels
Key Fibonacci Levels:
- 38.2%: $1723.11
- 50.0%: $1585.10
- 61.8%: $1447.09
Support: $1000.30 (Swing Low), $1470.88 (50-Day MA)
Resistance: $2169.90 (Swing High)
Disclaimer
The content on MarketsFN.com is provided for educational and informational purposes only. It does not constitute financial advice, investment recommendations, or trading guidance. All investments involve risks, and past performance does not guarantee future results. You are solely responsible for your investment decisions and should conduct independent research and consult a qualified financial advisor before acting. MarketsFN.com and its authors are not liable for any losses or damages arising from your use of this information.