Platinum: Up 0.3% to $1927.20 — Testing 50.0% Fibonacci Support
· Commodities · QuoteReporter
Platinum: Up 0.3% to $1927.20 — Testing 50.0% Fibonacci Support
Analysis Date: June 01, 2026
📊 Current Market Data
CURRENT PRICE
$1927.20
DAILY CHANGE
+0.26%
WEEKLY CHANGE
-0.23%
52W HIGH
$2852.40
52W LOW
$1051.70
💡 Key Market Factors
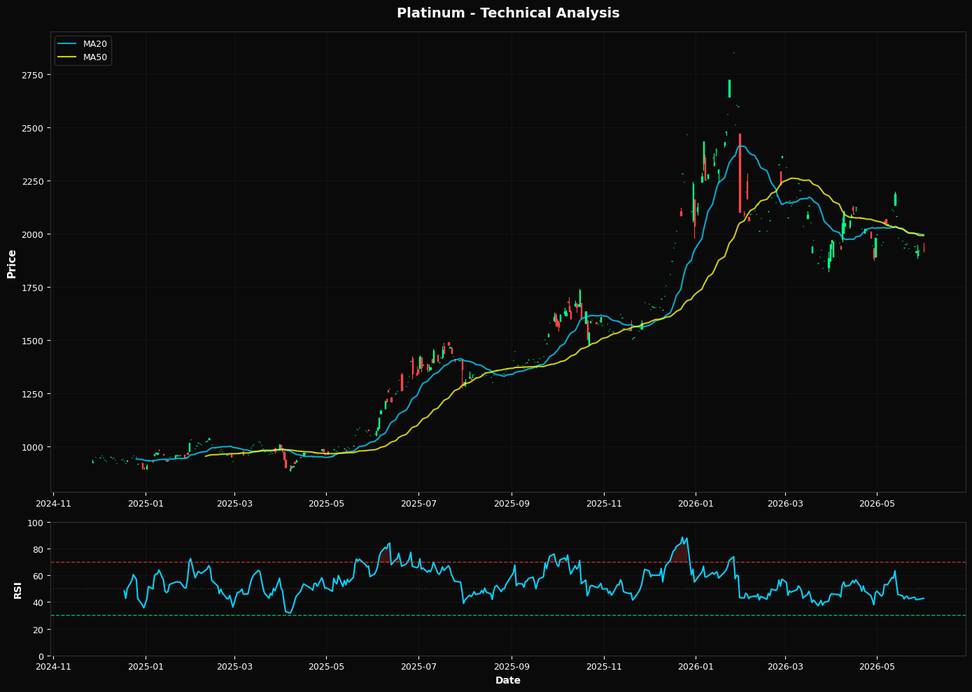
Platinum's current price action suggests a cautious outlook, with its price at $1927.20, slightly above the 200-day moving average of $1865.75 but below both the 20-day and 50-day moving averages. This positioning, combined with a Relative Strength Index (RSI) of 42.8, indicates a bearish sentiment in the short term. The market appears to be underpricing the potential impact of a stronger U.S. dollar, which could exert further downward pressure on platinum prices. As the Federal Reserve maintains a hawkish stance on interest rates, the dollar's strength is likely to persist, making it the most critical macro driver for platinum at this juncture. Technically, platinum is struggling to break above key resistance levels, with its price below the 50.0% Fibonacci retracement level at $1964.35. This suggests that any upward momentum is likely to face significant resistance. The RSI of 42.8, which is below the neutral 50 mark, further supports a bearish bias, indicating that the commodity is not yet oversold and could see further declines. The convergence of the 20-day and 50-day moving averages above the current price reinforces this view, suggesting that the path of least resistance remains to the downside. A key risk that could alter this bearish outlook is a sudden shift in Federal Reserve policy. Should the Fed signal a pause or reversal in its rate hikes due to unexpected economic data, such as a sharp decline in inflation or a significant slowdown in economic growth, the dollar could weaken, providing a tailwind for platinum prices. This would likely lead to a reassessment of the current bearish technical indicators and could trigger a rally above the $1964.35 Fibonacci level, challenging the 20-day and 50-day moving averages. Looking ahead, the upcoming U.S. inflation data release will be pivotal. A lower-than-expected inflation figure could prompt a reassessment of the Fed's rate trajectory, potentially weakening the dollar and providing support for platinum. Conversely, persistently high inflation would likely reinforce the Fed's current policy path, maintaining pressure on platinum prices. This data point will be crucial in confirming or invalidating the current bearish outlook for platinum.📈 Technical Indicators Summary
RSI (14)
42.8
50-Day MA
$1991.52
200-Day MA
$1865.75
Fib Level
50.0%
📊 Technical Analysis Chart (18-Month View)
📐 Fibonacci Retracement Analysis
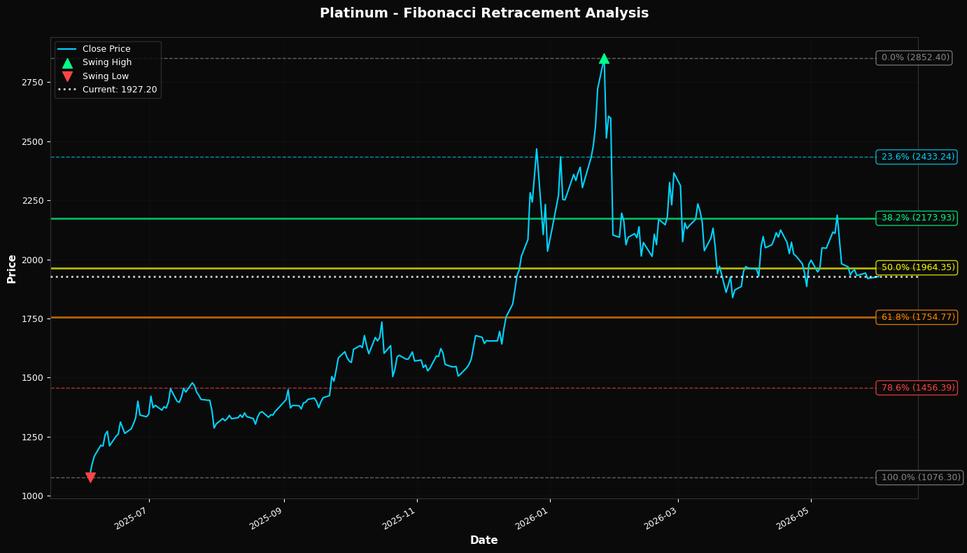
🎯 Key Trading Levels
Key Fibonacci Levels:
- 38.2%: $2173.93
- 50.0%: $1964.35
- 61.8%: $1754.77
Support: $1076.30 (Swing Low), $1991.52 (50-Day MA)
Resistance: $2852.40 (Swing High)
Disclaimer
The content on MarketsFN.com is provided for educational and informational purposes only. It does not constitute financial advice, investment recommendations, or trading guidance. All investments involve risks, and past performance does not guarantee future results. You are solely responsible for your investment decisions and should conduct independent research and consult a qualified financial advisor before acting. MarketsFN.com and its authors are not liable for any losses or damages arising from your use of this information.