Platinum: Up 1.6% to $1574.70 — Bearish — Below MA50 & MA200
· Commodities · QuoteReporter
Platinum: Up 1.6% to $1574.70 — Bearish — Below MA50 & MA200
Analysis Date: July 01, 2026
📊 Current Market Data
CURRENT PRICE
$1574.70
DAILY CHANGE
+1.58%
WEEKLY CHANGE
-0.37%
52W HIGH
$2852.40
52W LOW
$1276.20
💡 Key Market Factors
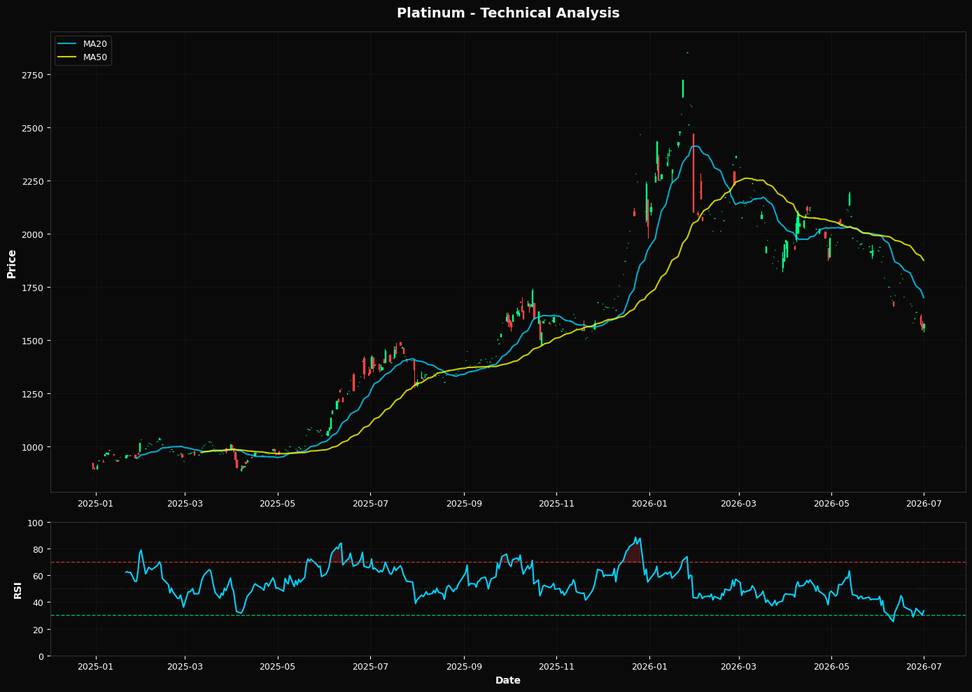
Platinum's current price action suggests a potential rebound opportunity, driven by its oversold technical condition and macroeconomic backdrop. With the Relative Strength Index (RSI) at 33.5, platinum is nearing oversold territory, indicating a potential for upward momentum. This technical setup is crucial as the commodity trades significantly below its 20-day, 50-day, and 200-day moving averages, which are $1699.71, $1874.90, and $1902.17, respectively. The substantial gap between the current price of $1574.70 and these moving averages underscores a bearish trend, yet the RSI suggests a possible reversal. In the macroeconomic landscape, the U.S. dollar's strength is the most critical factor impacting platinum prices today. A strong dollar typically exerts downward pressure on commodity prices, including platinum, as it makes them more expensive for holders of other currencies. However, if the Federal Reserve signals a pause or slowdown in rate hikes, this could weaken the dollar, providing a tailwind for platinum. The market may be underestimating the potential for such a shift in Fed policy, which could catalyze a significant price recovery in platinum. The key risk to this outlook is the upcoming U.S. inflation data. A higher-than-expected inflation reading could reinforce the Fed's hawkish stance, strengthening the dollar further and putting additional pressure on platinum prices. Conversely, a softer inflation print could alleviate some of the dollar's strength, supporting a rebound in platinum. This data point is pivotal; it will either confirm the potential for a dollar-driven recovery in platinum or exacerbate the current bearish trend. Looking ahead, the most critical event to watch is the next Federal Reserve meeting. Any indication of a dovish pivot or a pause in rate hikes would likely weaken the dollar, providing a much-needed boost to platinum prices. This would validate the technical signals of a potential rebound and could mark the beginning of a recovery phase for the metal. Conversely, continued hawkish rhetoric could invalidate the current technical setup, pushing platinum further into bearish territory.📈 Technical Indicators Summary
RSI (14)
33.5
50-Day MA
$1874.90
200-Day MA
$1902.17
Fib Level
61.8%
📊 Technical Analysis Chart (18-Month View)
📐 Fibonacci Retracement Analysis
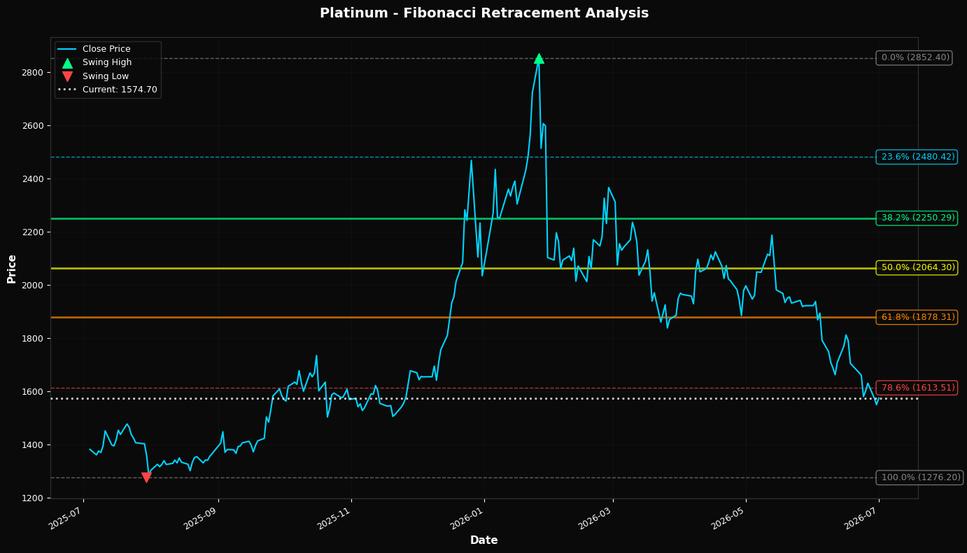
🎯 Key Trading Levels
Key Fibonacci Levels:
- 38.2%: $2250.29
- 50.0%: $2064.30
- 61.8%: $1878.31
Support: $1276.20 (Swing Low), $1874.90 (50-Day MA)
Resistance: $2852.40 (Swing High)
Disclaimer
The content on MarketsFN.com is provided for educational and informational purposes only. It does not constitute financial advice, investment recommendations, or trading guidance. All investments involve risks, and past performance does not guarantee future results. You are solely responsible for your investment decisions and should conduct independent research and consult a qualified financial advisor before acting. MarketsFN.com and its authors are not liable for any losses or damages arising from your use of this information.