Ripple Holds Steady at $1.1765 Amid Neutral RSI
· Crypto · QuoteReporter
Ripple Holds Steady at $1.1765 Amid Neutral RSI
Ripple (XRP/USD) | June 18, 2026 $1.1765 -0.72%
🔍 Technical Analysis
### Technical Analysis: Ripple (XRP)
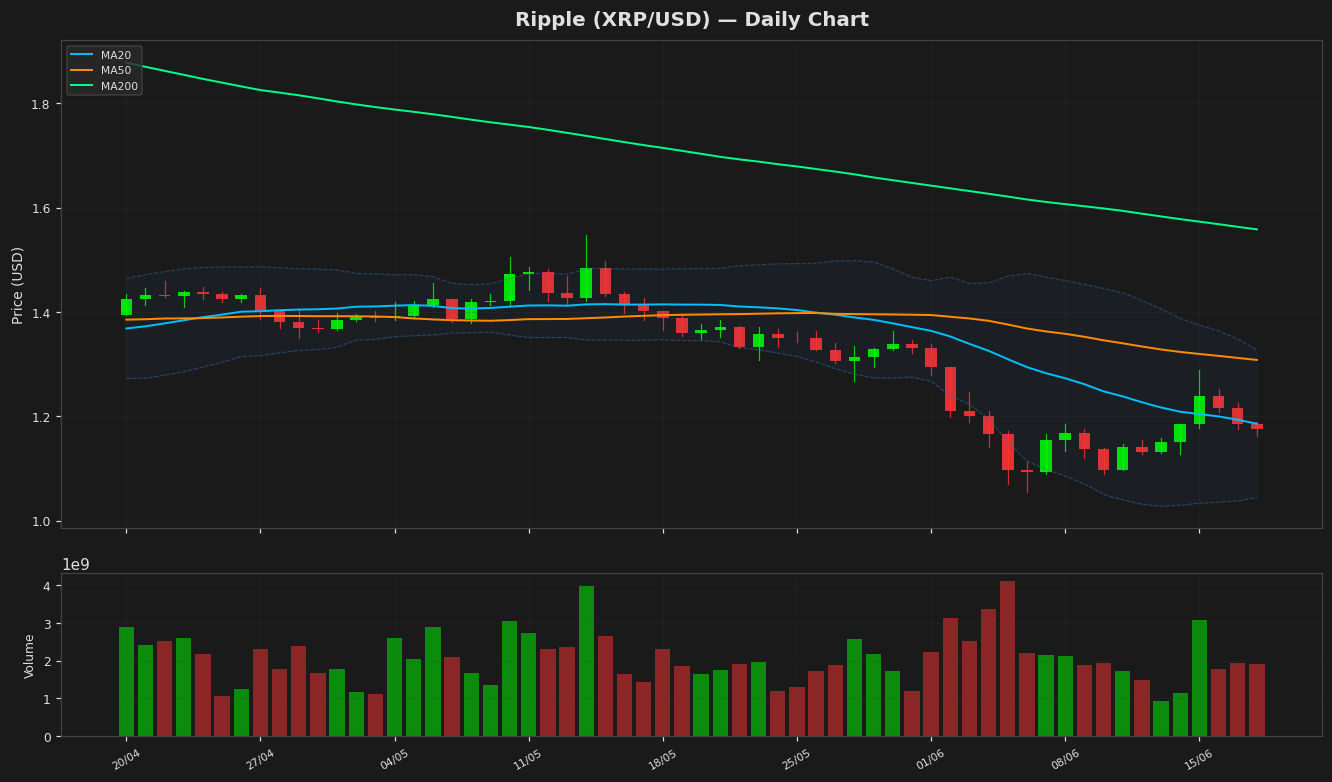
Ripple (XRP) is currently trading at **$1.1765**, down **0.72%** on the day, reflecting mild bearish pressure. The price remains below the **20-day moving average (MA20) at $1.1857**, signaling short-term weakness, while the **50-day MA ($1.3080)** and **200-day MA ($1.5584)** confirm a broader downtrend as both act as resistance levels.
Bollinger Bands show a narrowing range, with the upper band at **$1.3274** and the lower band at **$1.0440**, suggesting reduced volatility. The price hovering near the middle band indicates neutral momentum. The **RSI at 51.12** is balanced, neither overbought nor oversold, but a break below 50 could signal further downside.
The **MACD histogram is negative (-0.0356)**, with the MACD line below the signal line (-0.0479), reinforcing bearish momentum. The **Average True Range (ATR) of 0.0563** reflects low volatility, typical of consolidation.
Key support lies at the **52-week low of $1.0547**, while resistance is seen at the **MA20 ($1.1857)** and the **50-day MA ($1.3080)**. A break below support could test $1.00, whereas reclaiming the MA20 may target the upper Bollinger Band. The mixed signals from RSI and MACD suggest cautious trading until a clearer trend emerges.
Technical Metrics
| Metric | Value |
|---|---|
| Current Price | $1.1765 |
| Daily Change | -0.72% |
| MA 20 | $1.1857 |
| % from MA20 | -0.78% |
| MA 50 | $1.3080 |
| % from MA50 | -10.05% |
| MA 200 | $1.5584 |
| % from MA200 | -24.50% |
| BB Upper | $1.3274 |
| % from BB Upper | -11.37% |
| BB Lower | $1.0440 |
| % from BB Lower | +12.69% |
| RSI (14) | 51.12 |
| MACD | -0.035585 |
| MACD Signal | -0.047896 |
| ATR (14) | 0.056332 |
| 3-Day High | $1.2525 |
| 3-Day Low | $1.1629 |
| 52-Week High | $2.8336 |
| % from 52W High | -58.48% |
| 52-Week Low | $1.0547 |
| % from 52W Low | +11.55% |
| YTD High | $2.4103 |
| % from YTD High | -51.19% |
| YTD Low | $1.0547 |
| % from YTD Low | +11.55% |
📊 Market Commentary
Ripple (XRP) is trading at $1.1765, down 0.72% today, as the broader cryptocurrency market shows mixed sentiment. The Relative Strength Index (RSI) at 51.1 indicates a neutral momentum, neither overbought nor oversold, suggesting a balanced tug-of-war between buyers and sellers. XRP remains within its 52-week range of $1.0547 to $2.8336, with the current price hovering near the middle of this band, reflecting cautious trading activity.
Market sentiment for XRP is currently influenced by broader macroeconomic factors and regulatory developments surrounding Ripple’s ongoing legal case with the U.S. Securities and Exchange Commission (SEC). Traders are closely monitoring key support and resistance levels, with immediate support seen around $1.10, a psychological and technical floor that has held in recent weeks. On the upside, resistance near $1.25 remains a critical level to watch, as a break above could signal renewed bullish interest.
Volume trends have been subdued, indicating a lack of strong conviction from either bulls or bears. Traders are also keeping an eye on Bitcoin’s price action, as XRP often correlates with the broader market movements. The neutral RSI suggests that XRP may continue to consolidate in the near term unless a significant catalyst emerges. For now, the focus remains on regulatory clarity and macroeconomic conditions, which could dictate XRP’s next directional move.
Disclaimer
The content on MarketsFN.com is provided for educational and informational purposes only. It does not constitute financial advice or investment recommendations. All investments involve risk. Cryptocurrency markets are highly volatile. Past performance does not guarantee future results.