"Ripple Plunges to Oversold Levels at $1.13 – Rebound Ahead?"
· Crypto · QuoteReporter
"Ripple Plunges to Oversold Levels at $1.13 – Rebound Ahead?"
Ripple (XRP/USD) | June 05, 2026 $1.1323 -2.94%
🔍 Technical Analysis
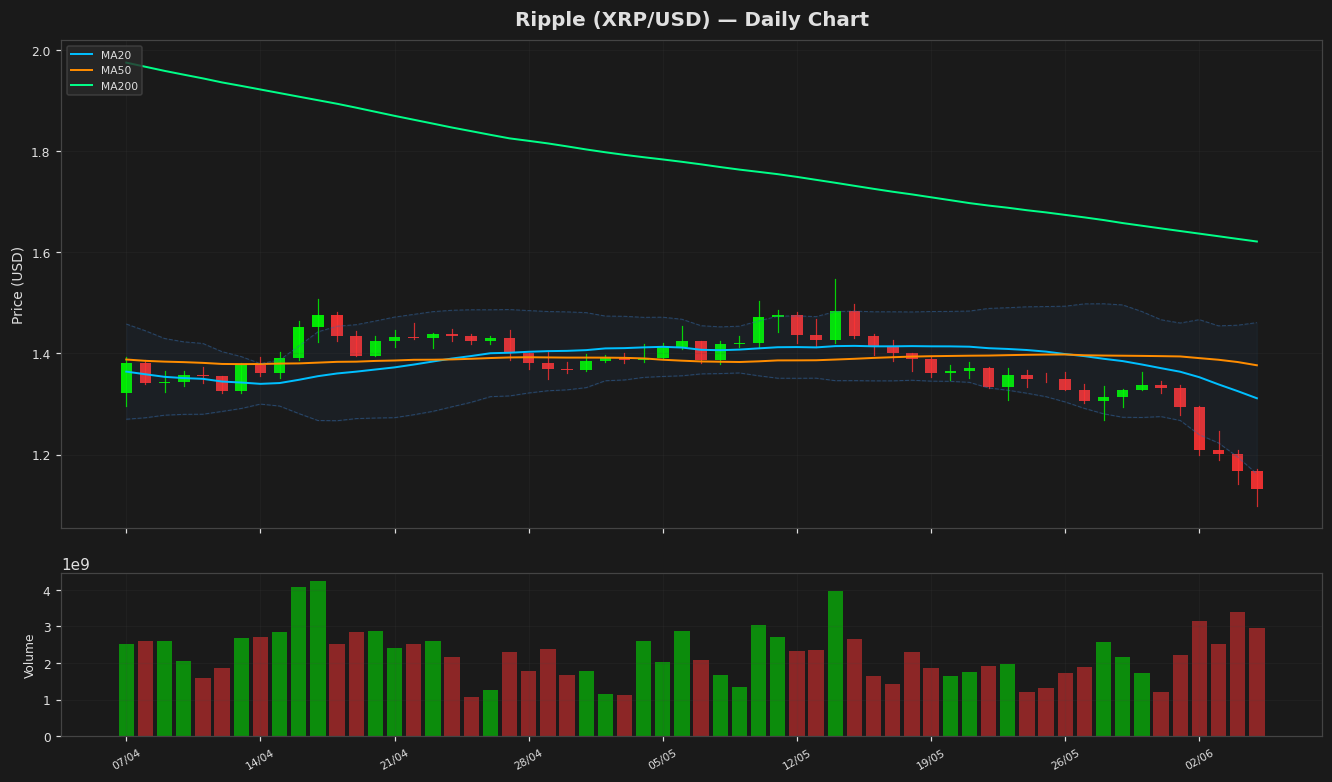
Ripple (XRP) is currently trading at $1.132300, down 2.94% on the day, showing continued bearish pressure. The price remains below all key moving averages—MA20 ($1.311405), MA50 ($1.376654), and MA200 ($1.621477)—indicating a strong downtrend. The Bollinger Bands highlight heightened volatility, with the upper band at $1.461007 and the lower band at $1.161802. The price is hovering near the lower band, suggesting potential oversold conditions. The RSI(14) at 17.863592 is deeply oversold, signaling extreme bearish momentum but also hinting at a possible reversal if buying pressure emerges. The MACD histogram reads -0.055574, below the signal line (-0.035255), confirming bearish momentum. Key support lies at the yearly low of $1.09784961, while resistance is seen at the MA20 ($1.311405). The 52-week high of $3.09925103 and YTD high of $2.41026402 remain distant, underscoring the asset's significant decline. The ATR(14) at 0.050314 suggests moderate volatility. For a bullish reversal, XRP must reclaim the MA20 and stabilize above $1.30, while failure to hold $1.10 could lead to further downside.
Technical Metrics
| Metric | Value |
|---|---|
| Current Price | $1.1323 |
| Daily Change | -2.94% |
| MA 20 | $1.3114 |
| % from MA20 | -13.66% |
| MA 50 | $1.3767 |
| % from MA50 | -17.75% |
| MA 200 | $1.6215 |
| % from MA200 | -30.17% |
| BB Upper | $1.4610 |
| % from BB Upper | -22.50% |
| BB Lower | $1.1618 |
| % from BB Lower | -2.54% |
| RSI (14) | 17.86 |
| MACD | -0.055574 |
| MACD Signal | -0.035255 |
| ATR (14) | 0.050314 |
| 3-Day High | $1.2463 |
| 3-Day Low | $1.0978 |
| 52-Week High | $3.0993 |
| % from 52W High | -63.47% |
| 52-Week Low | $1.0978 |
| % from 52W Low | +3.14% |
| YTD High | $2.4103 |
| % from YTD High | -53.02% |
| YTD Low | $1.0978 |
| % from YTD Low | +3.14% |
📊 Market Commentary
**Ripple (XRP) Market Commentary**
Ripple (XRP) is currently trading at **$1.1323**, down **2.94%** today, as broader crypto market weakness weighs on sentiment. The Relative Strength Index (RSI) sits at **17.9**, indicating deeply oversold conditions—the lowest since late 2022. This suggests potential exhaustion in selling pressure, though a sustained recovery depends on broader market sentiment and trading volume.
XRP’s **52-week range** of **$1.0978 – $3.0993** highlights significant volatility, with the current price near the lower bound. Traders are closely watching the **$1.10** support level, a critical psychological and technical floor. A break below could trigger further downside toward the **$1.00** mark. Conversely, resistance is seen near **$1.20**, followed by **$1.30**, where previous sell-offs have occurred.
Market sentiment remains cautious amid ongoing regulatory uncertainty surrounding Ripple’s legal battle with the SEC. While recent court rulings have been mixed, clarity on the case remains a key driver for XRP’s price action. Additionally, Bitcoin’s performance and overall crypto market trends continue to influence XRP’s direction.
Traders are monitoring whether the oversold RSI leads to a short-term bounce or if bearish momentum persists. Given the lack of strong bullish catalysts, sideways consolidation near current levels appears likely unless broader market conditions improve. Volume trends and regulatory developments will remain critical in determining XRP’s next move.
Disclaimer
The content on MarketsFN.com is provided for educational and informational purposes only. It does not constitute financial advice or investment recommendations. All investments involve risk. Cryptocurrency markets are highly volatile. Past performance does not guarantee future results.