S&P 500: Máximos y Mínimos de 52 Semanas
· market-analysis · MarketsFN Team
S&P 500 52-Week Highs & Lows Radar: Walmart (WMT), Sherwin-Williams (SHW) and more
Screening all 503 S&P 500 constituents for stocks nearest to their 52-week high and their 52-week low. Data as of May 19, 2026. % Realized = 52-week total return.
Legend: RSI > 70 = overbought · RSI < 30 = oversold · Green % Realized = positive 52W return · Red = negative.
📈 Nearest to 52-Week High
Sectors represented: Consumer Defensive (4), Consumer Cyclical (1)
| Ticker | Company | Sector | Price Last | % Realized | 52-Week High Date | RSI | % above MA200 | Trend |
|---|---|---|---|---|---|---|---|---|
| WMT | Walmart Inc | Consumer Defensive | $134.82 | +37.40% | 2026-05-19 | 64.0 | +17.8% | Above MA20, MA50, MA200 |
| COST | Costco Wholesale Corp | Consumer Defensive | $1092.58 | +5.63% | 2026-05-19 | 74.7 | +14.3% | Above MA20, MA50, MA200 |
| KO | Coca-Cola Co | Consumer Defensive | $82.22 | +14.31% | 2026-05-19 | 72.8 | +13.3% | Above MA20, MA50, MA200 |
| PM | Philip Morris International Inc | Consumer Defensive | $192.89 | +11.39% | 2026-05-19 | 74.2 | +16.8% | Above MA20, MA50, MA200 |
| SBUX | Starbucks Corp | Consumer Cyclical | $107.18 | +26.68% | 2026-05-19 | 66.0 | +17.9% | Above MA20, MA50, MA200 |
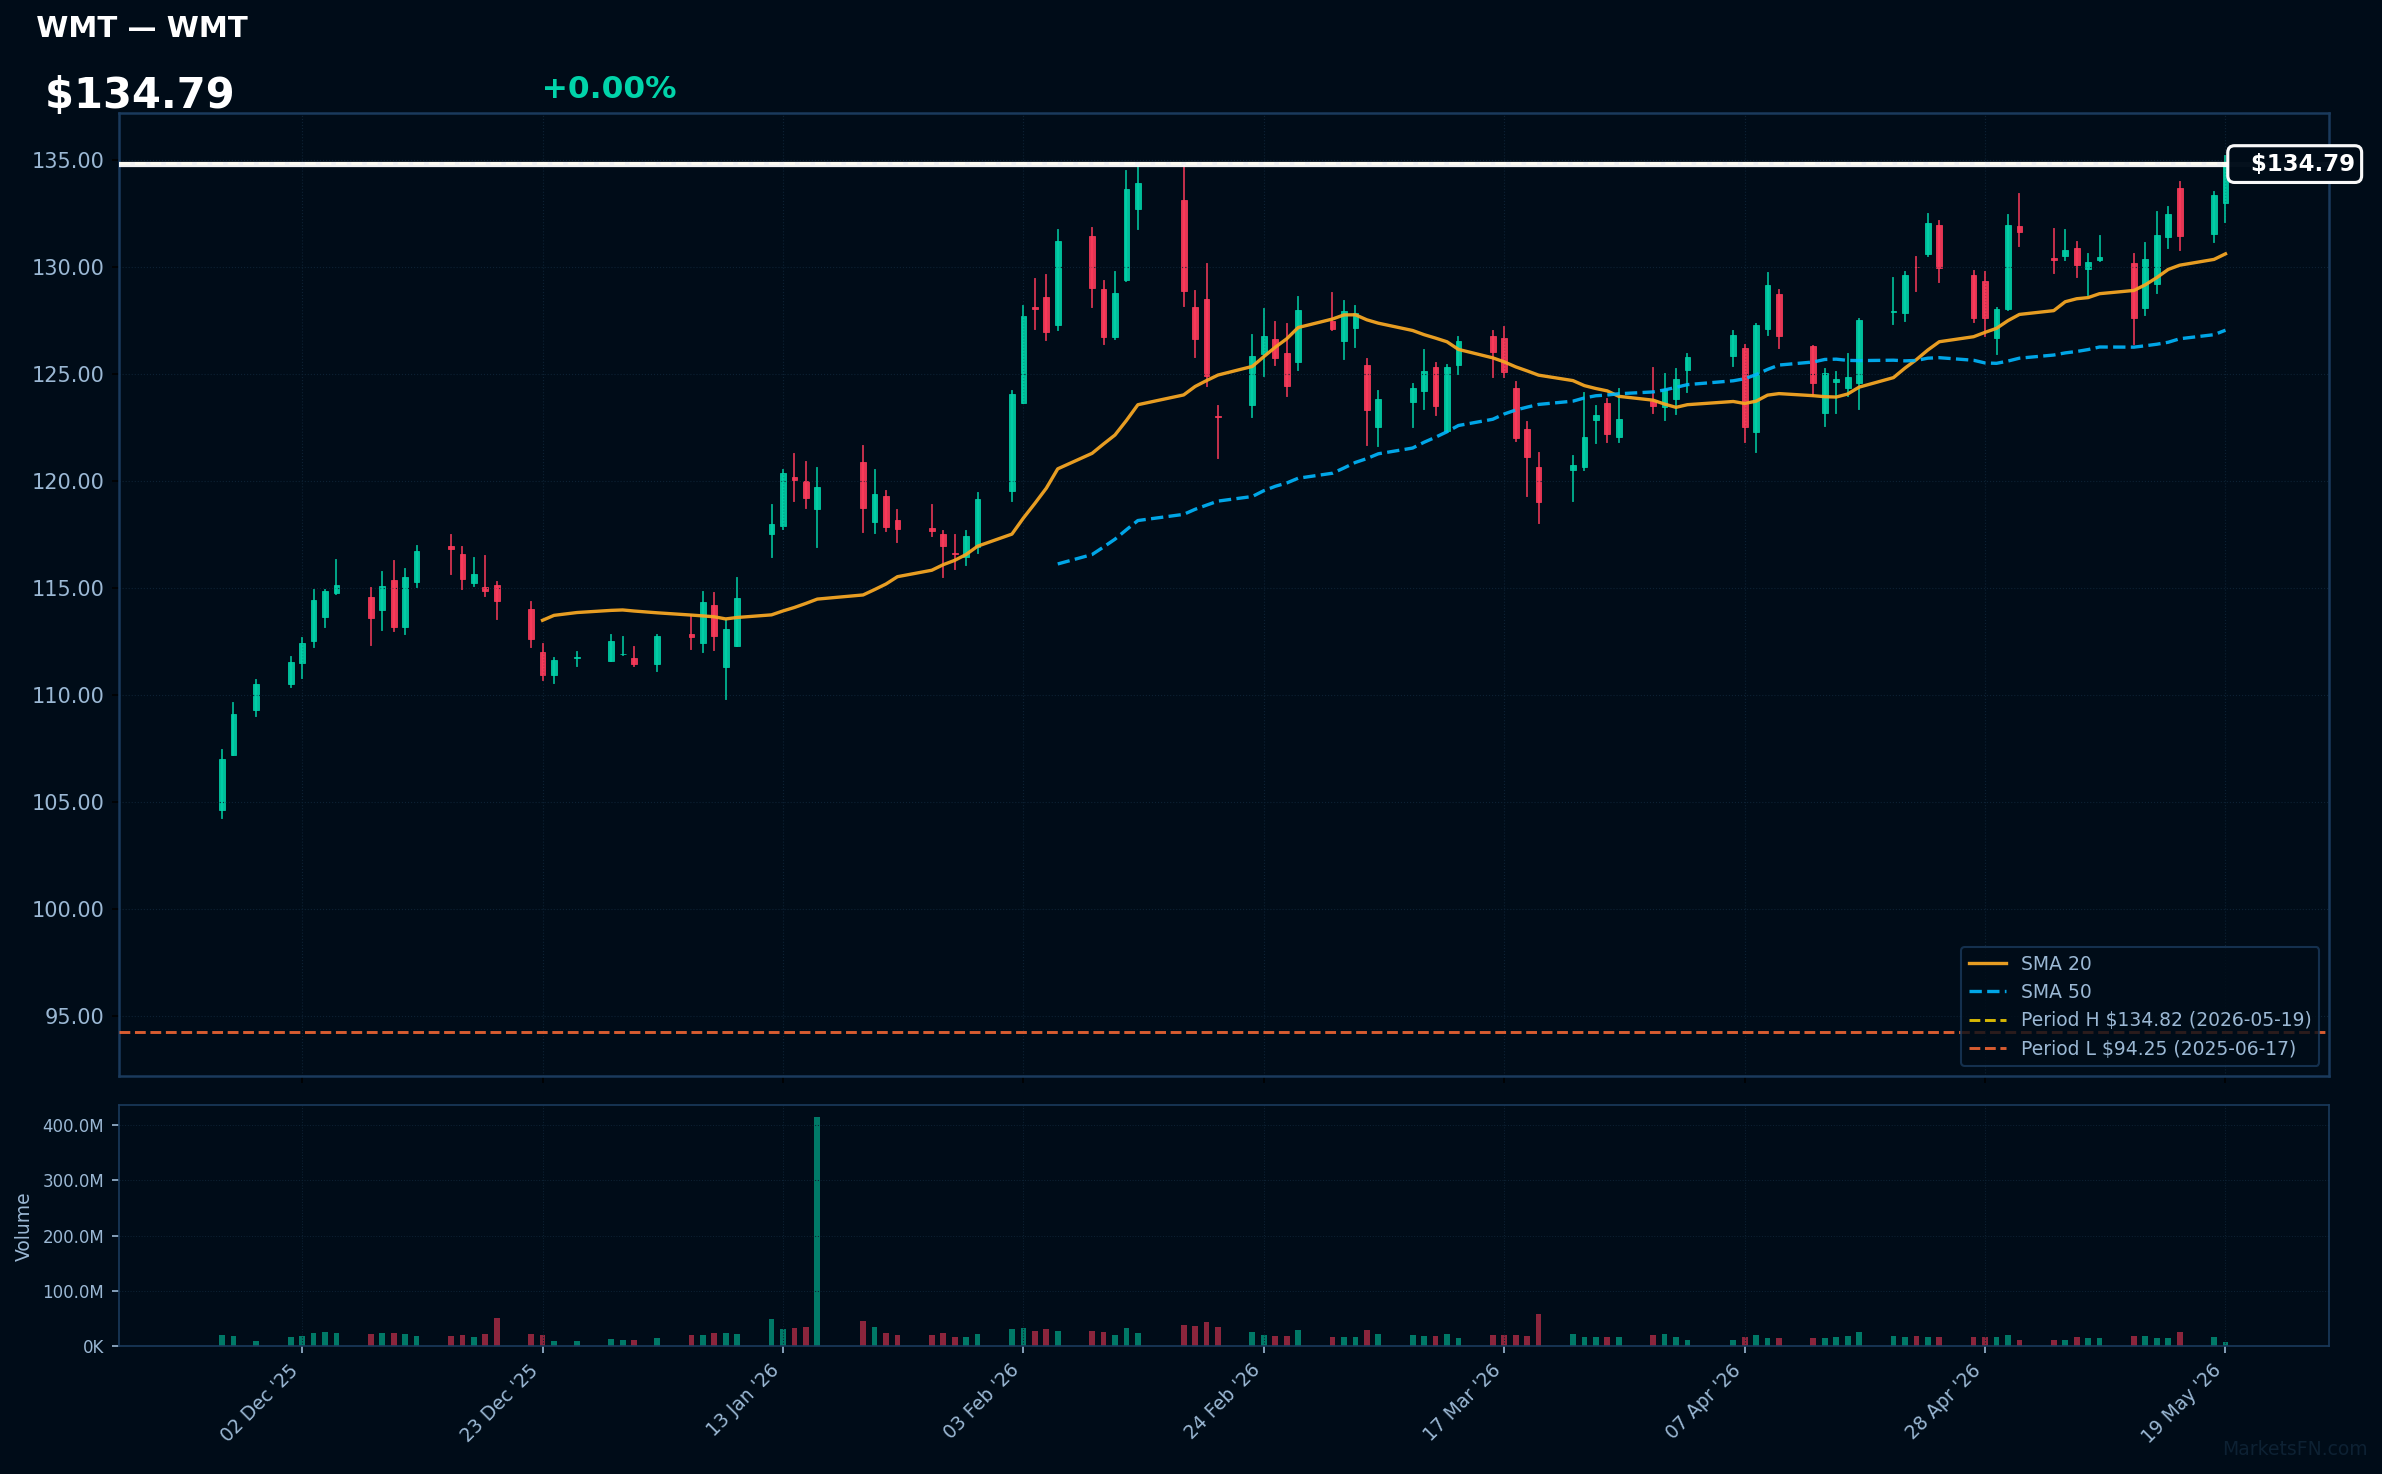
WMT | Walmart Inc | Consumer Defensive | Price Last: $134.82 | % Realized: +37.40% | RSI: 64.0 | % above MA200: +17.8% | Trend: Above MA20, MA50, MA200
Commentary unavailable.
Related headlines
- Target is hiring a former Walmart executive to lead its supply chain
- Target names former Walmart executive as chief supply chain officer
- Target names former Walmart executive as supply chain chief
- Lee Announces First Celebrity Collaboration with 8x Grammy Award Winning Artist Kacey Musgraves Exclusively for Walmart
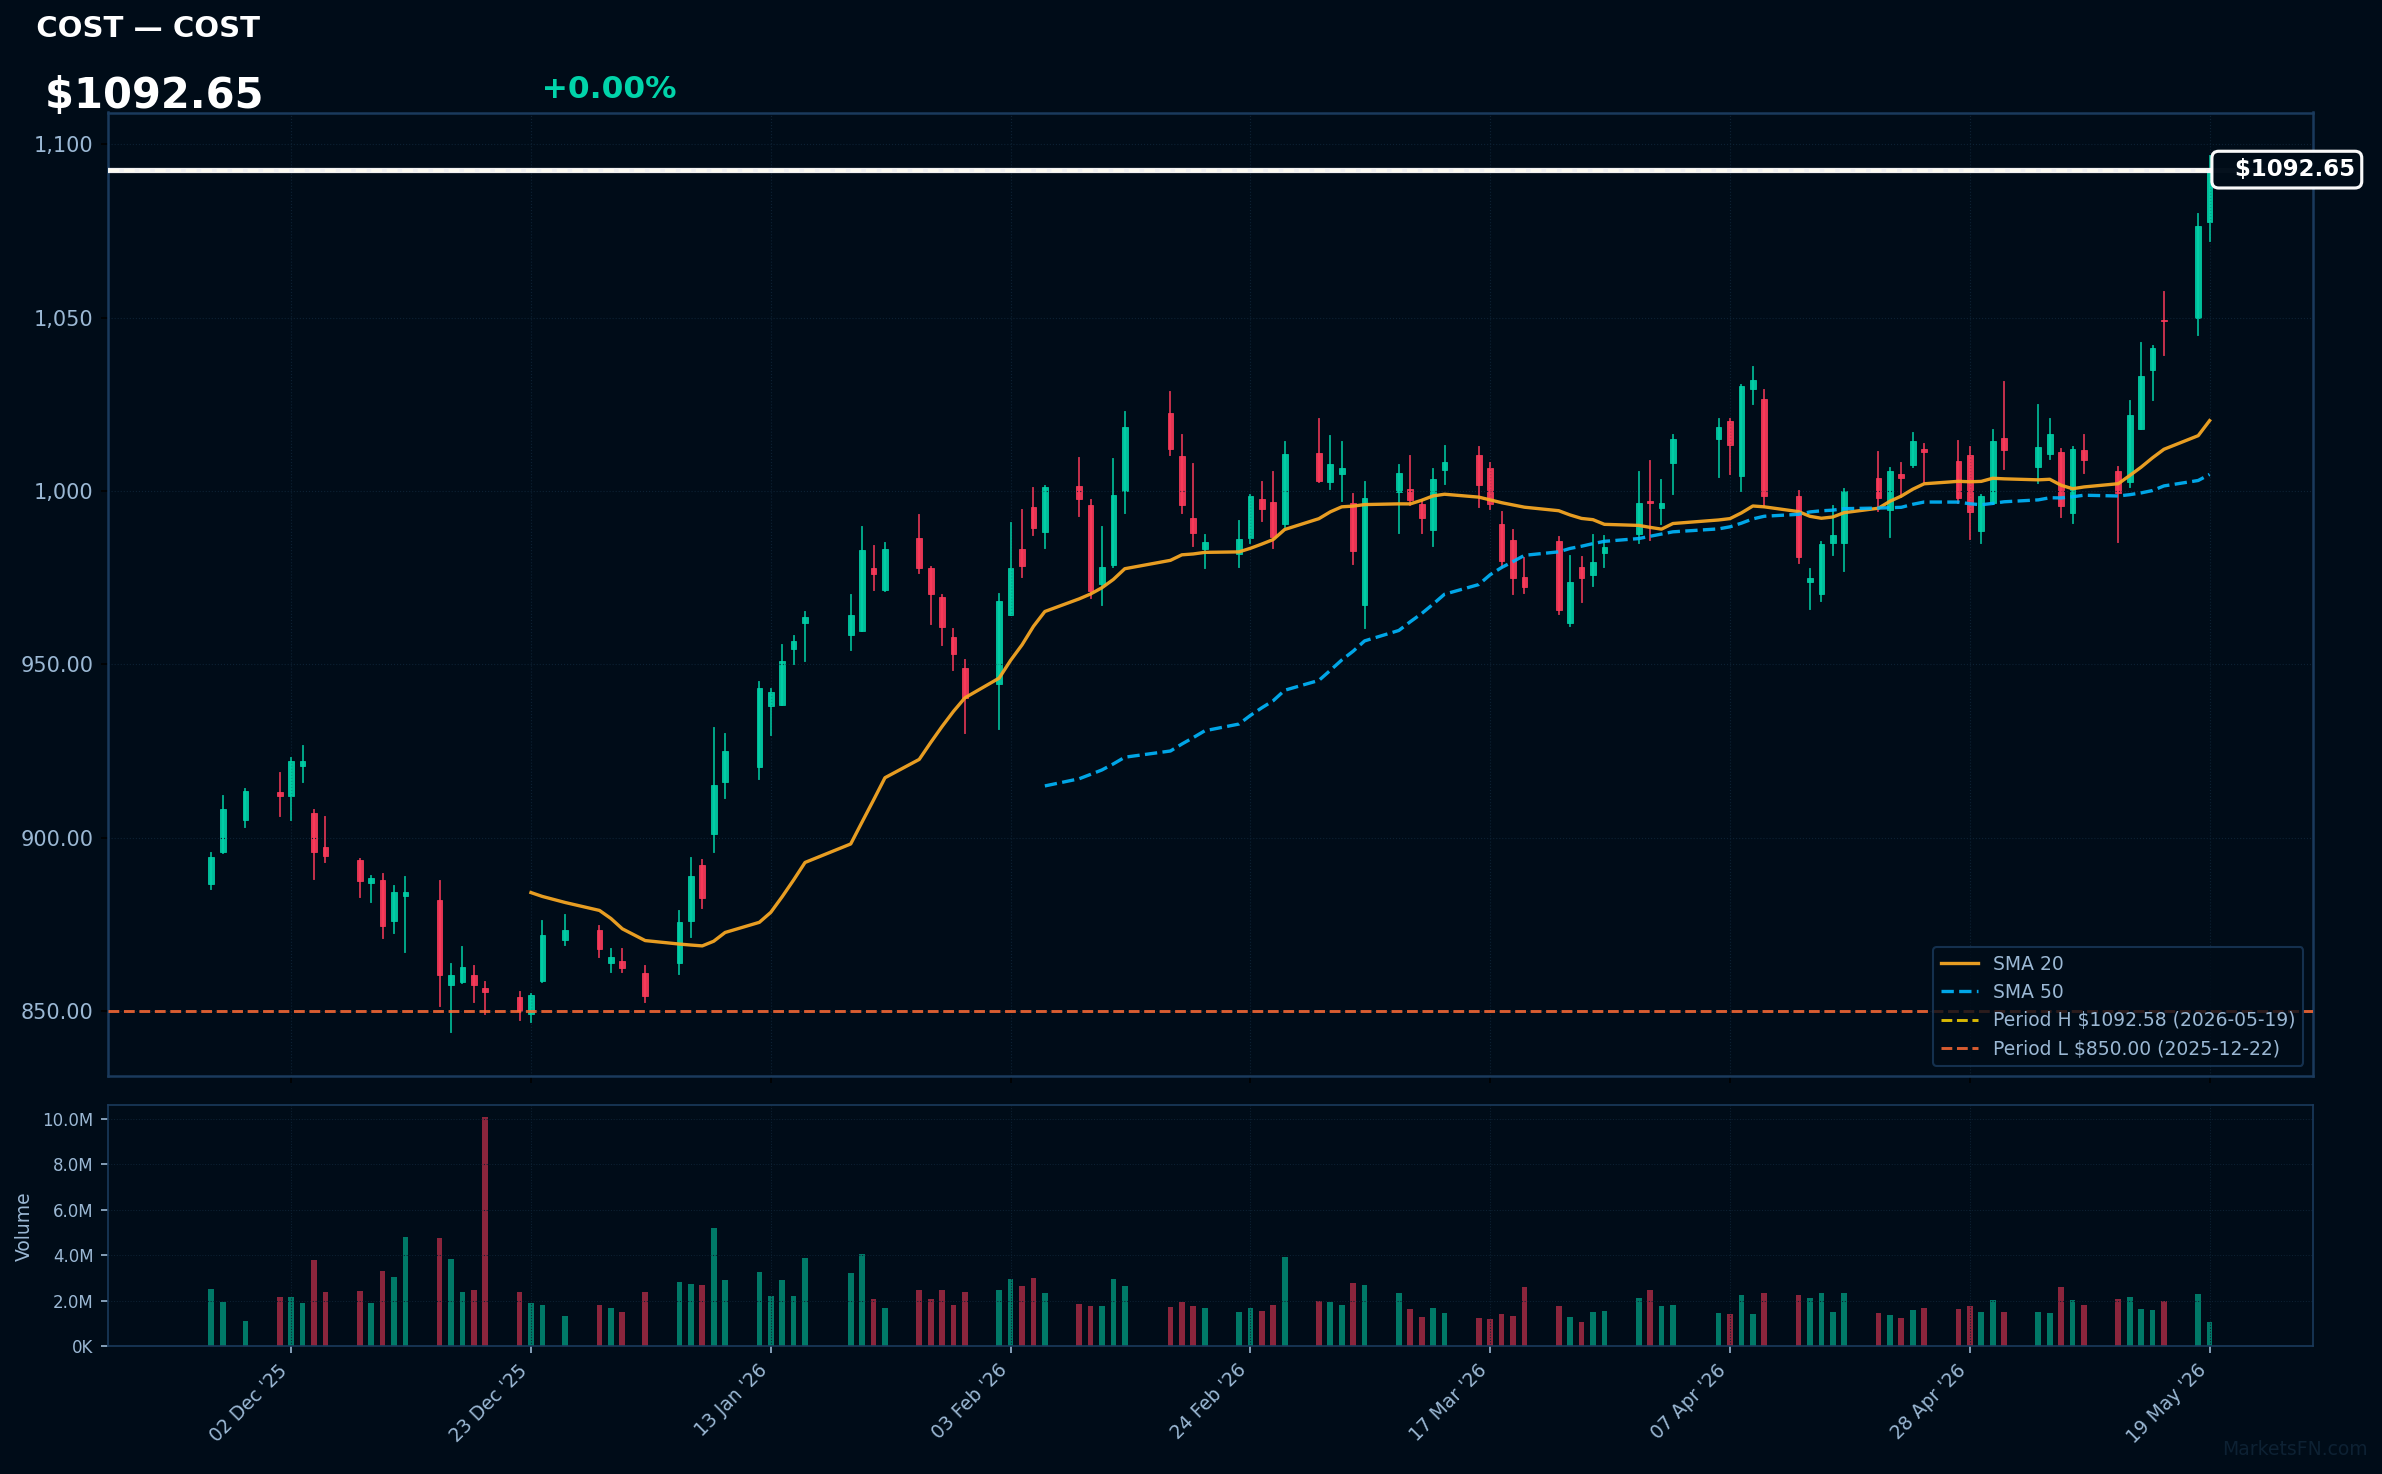
COST | Costco Wholesale Corp | Consumer Defensive | Price Last: $1092.58 | % Realized: +5.63% | RSI: 74.7 | % above MA200: +14.3% | Trend: Above MA20, MA50, MA200
Commentary unavailable.
Related headlines
- Costco Recession Signal Goes Viral as Old CFO Remarks Resurface On Record Beef Prices
- Costco Is Innovating Its Way to More Growth, Says Analyst. Plus, Valvoline and 3 More Stocks.
- Oracle, Google, Costco options trading: This expert explains all
- Costco April sales top expectations despite Easter shift, macroeconomic uncertainty
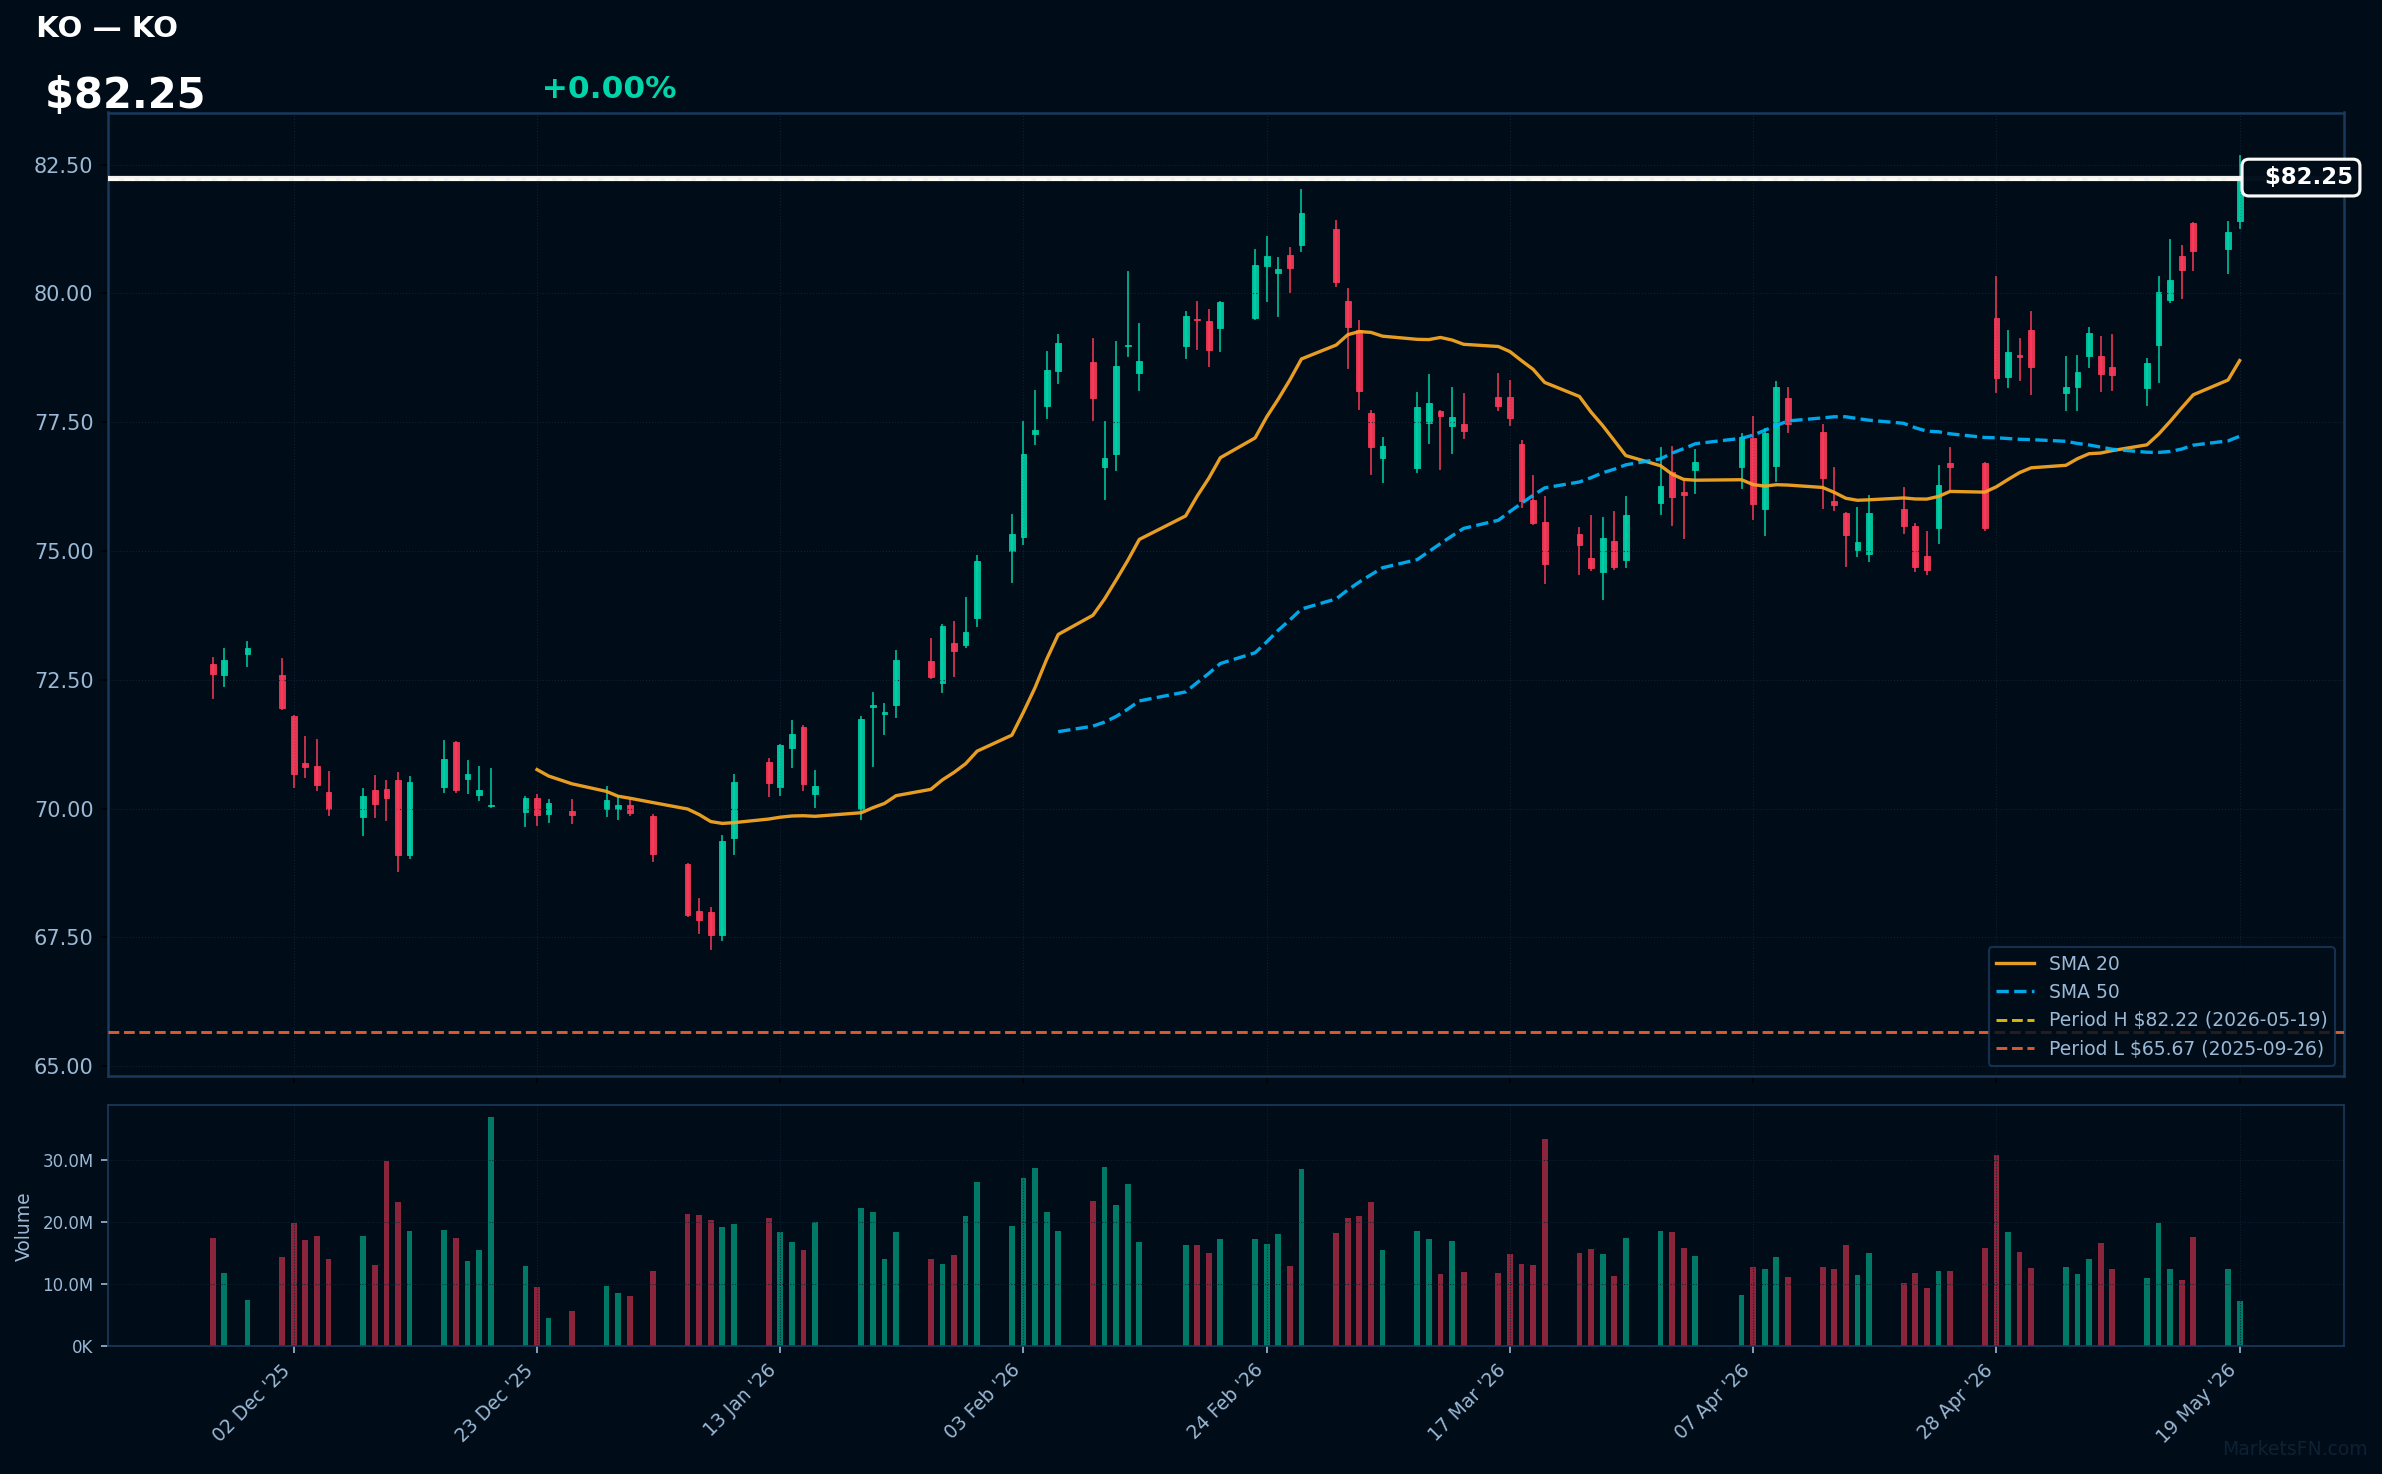
KO | Coca-Cola Co | Consumer Defensive | Price Last: $82.22 | % Realized: +14.31% | RSI: 72.8 | % above MA200: +13.3% | Trend: Above MA20, MA50, MA200
Commentary unavailable.
Related headlines
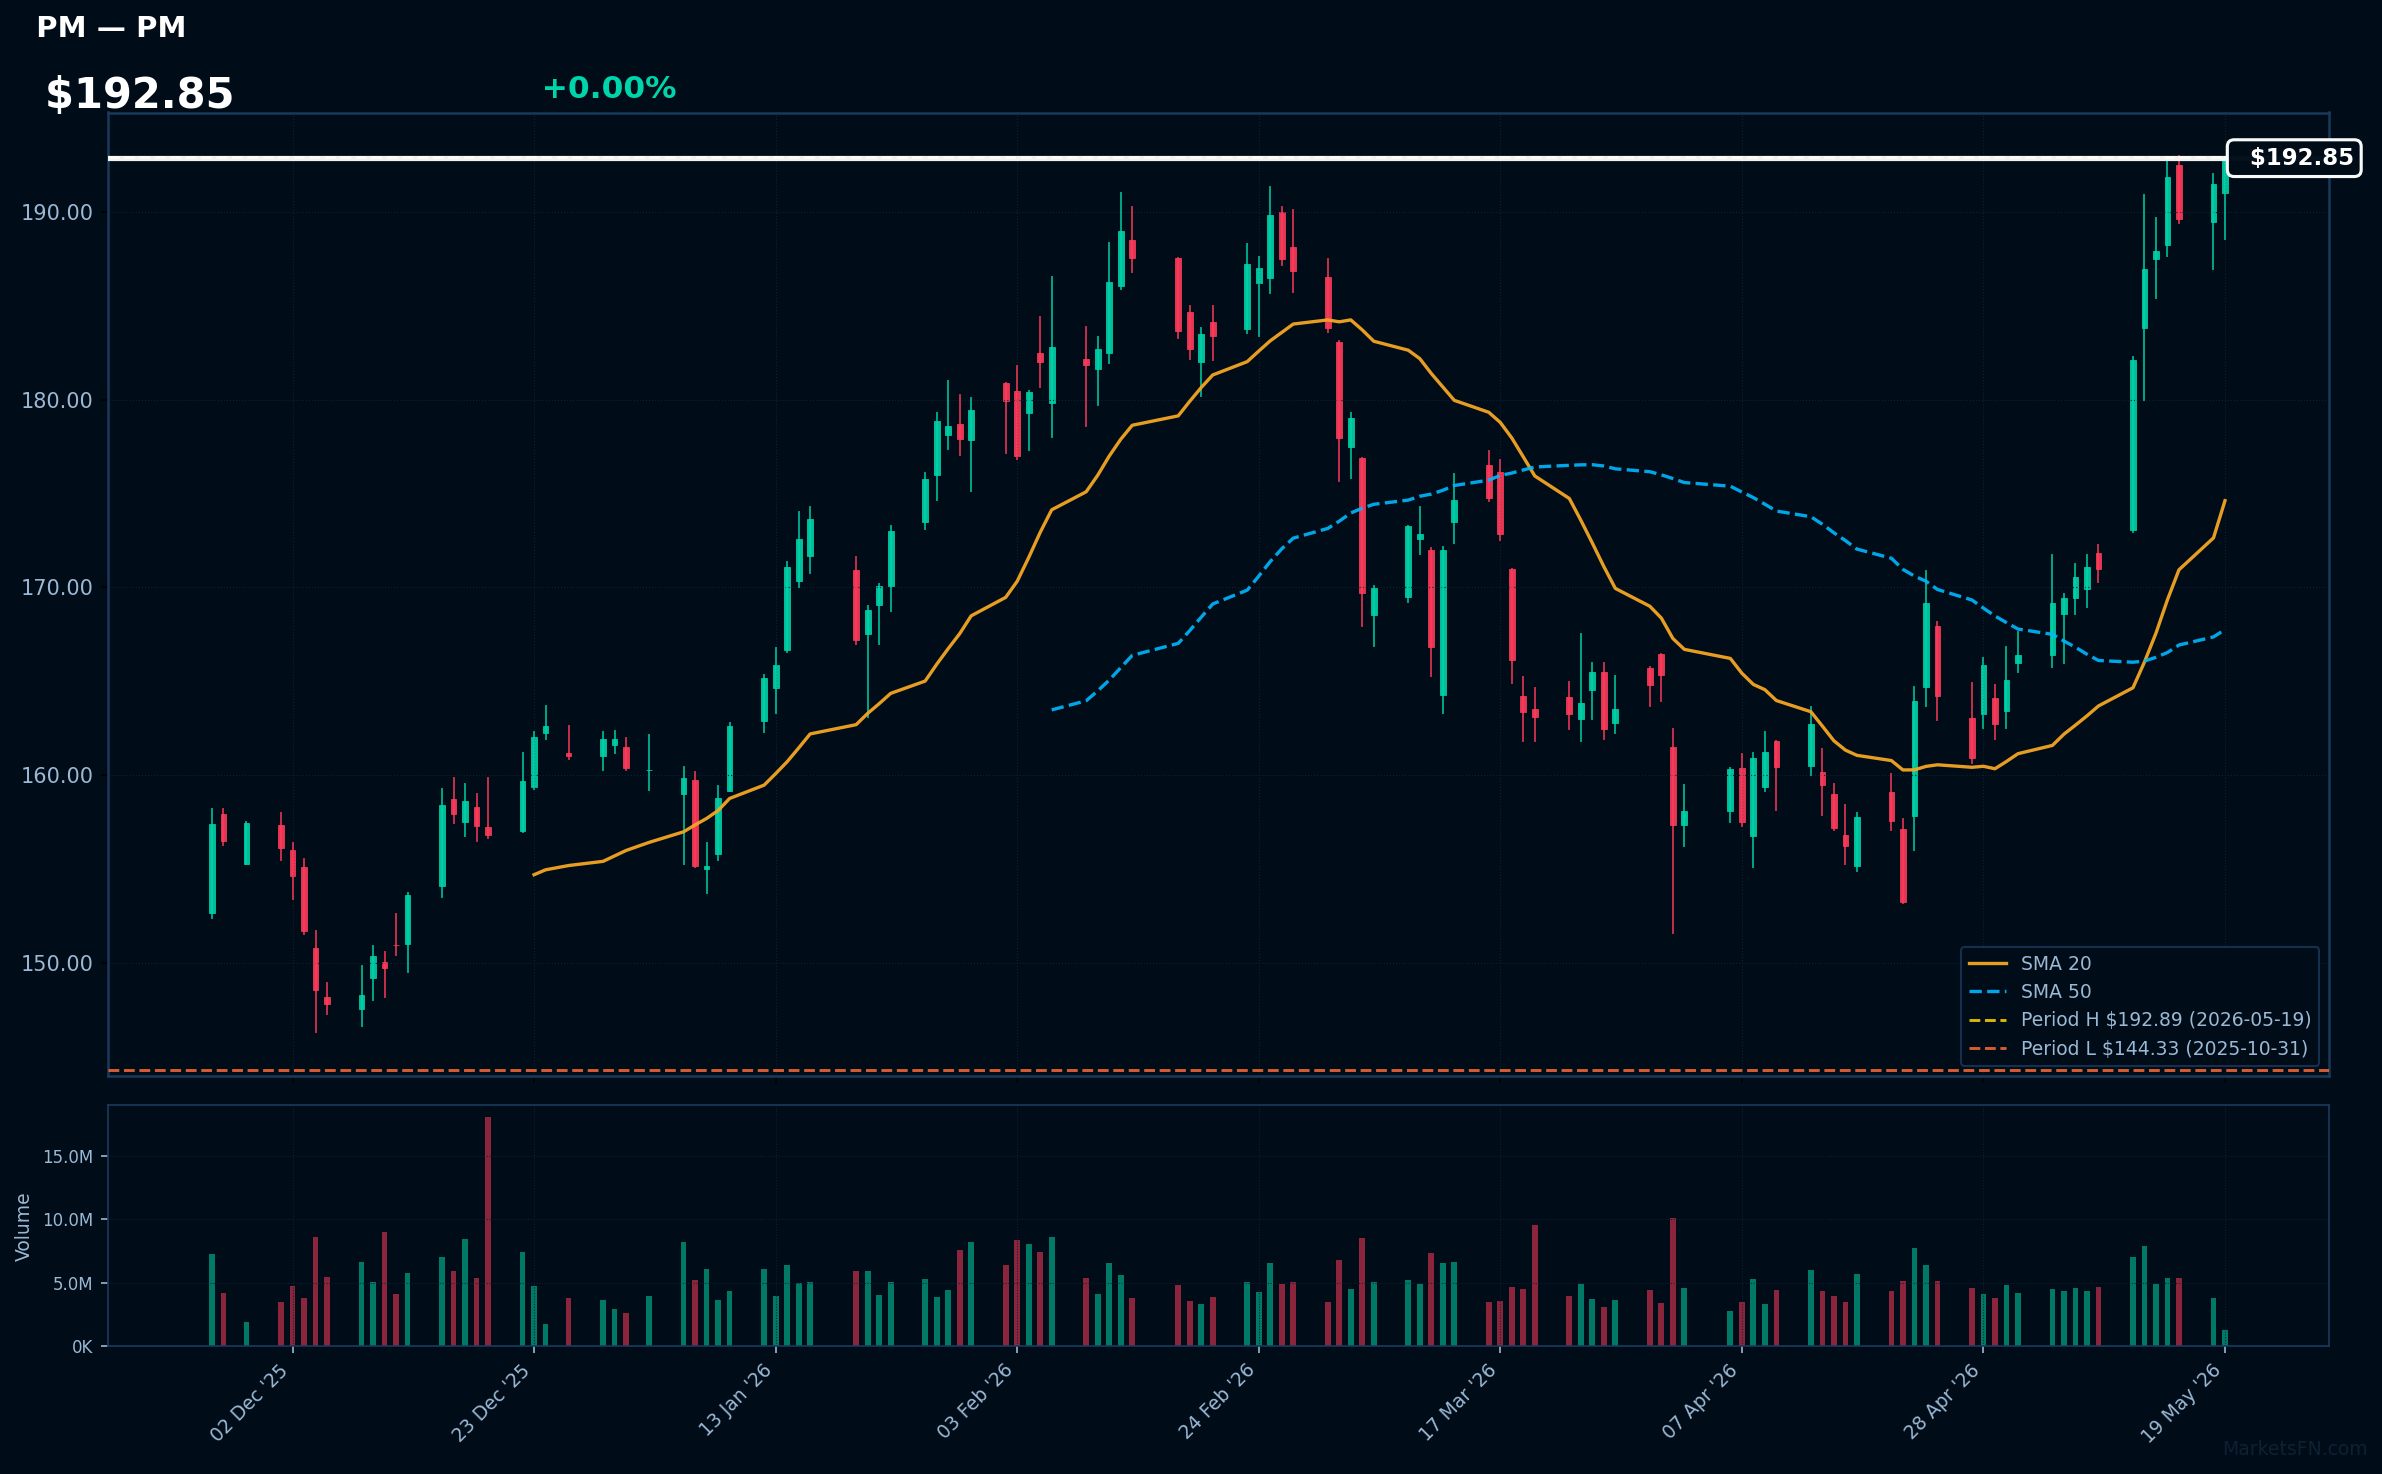
PM | Philip Morris International Inc | Consumer Defensive | Price Last: $192.89 | % Realized: +11.39% | RSI: 74.2 | % above MA200: +16.8% | Trend: Above MA20, MA50, MA200
Commentary unavailable.
Related headlines
- PMI U.S. Expands Its Talent Pipeline and Welcomes New Class of Interns Across the Enterprise
- Philip Morris International Inc. stock outperforms competitors on strong trading day
- Philip Morris International's Moira Gilchrist Positions Human Judgment as a Critical Leadership Advantage Amid Rapid AI Adoption at Wall Street Journal Forum
- PMI U.S. Expands Support for Military Families with $260,000 in New Donations During Military Appreciation Month
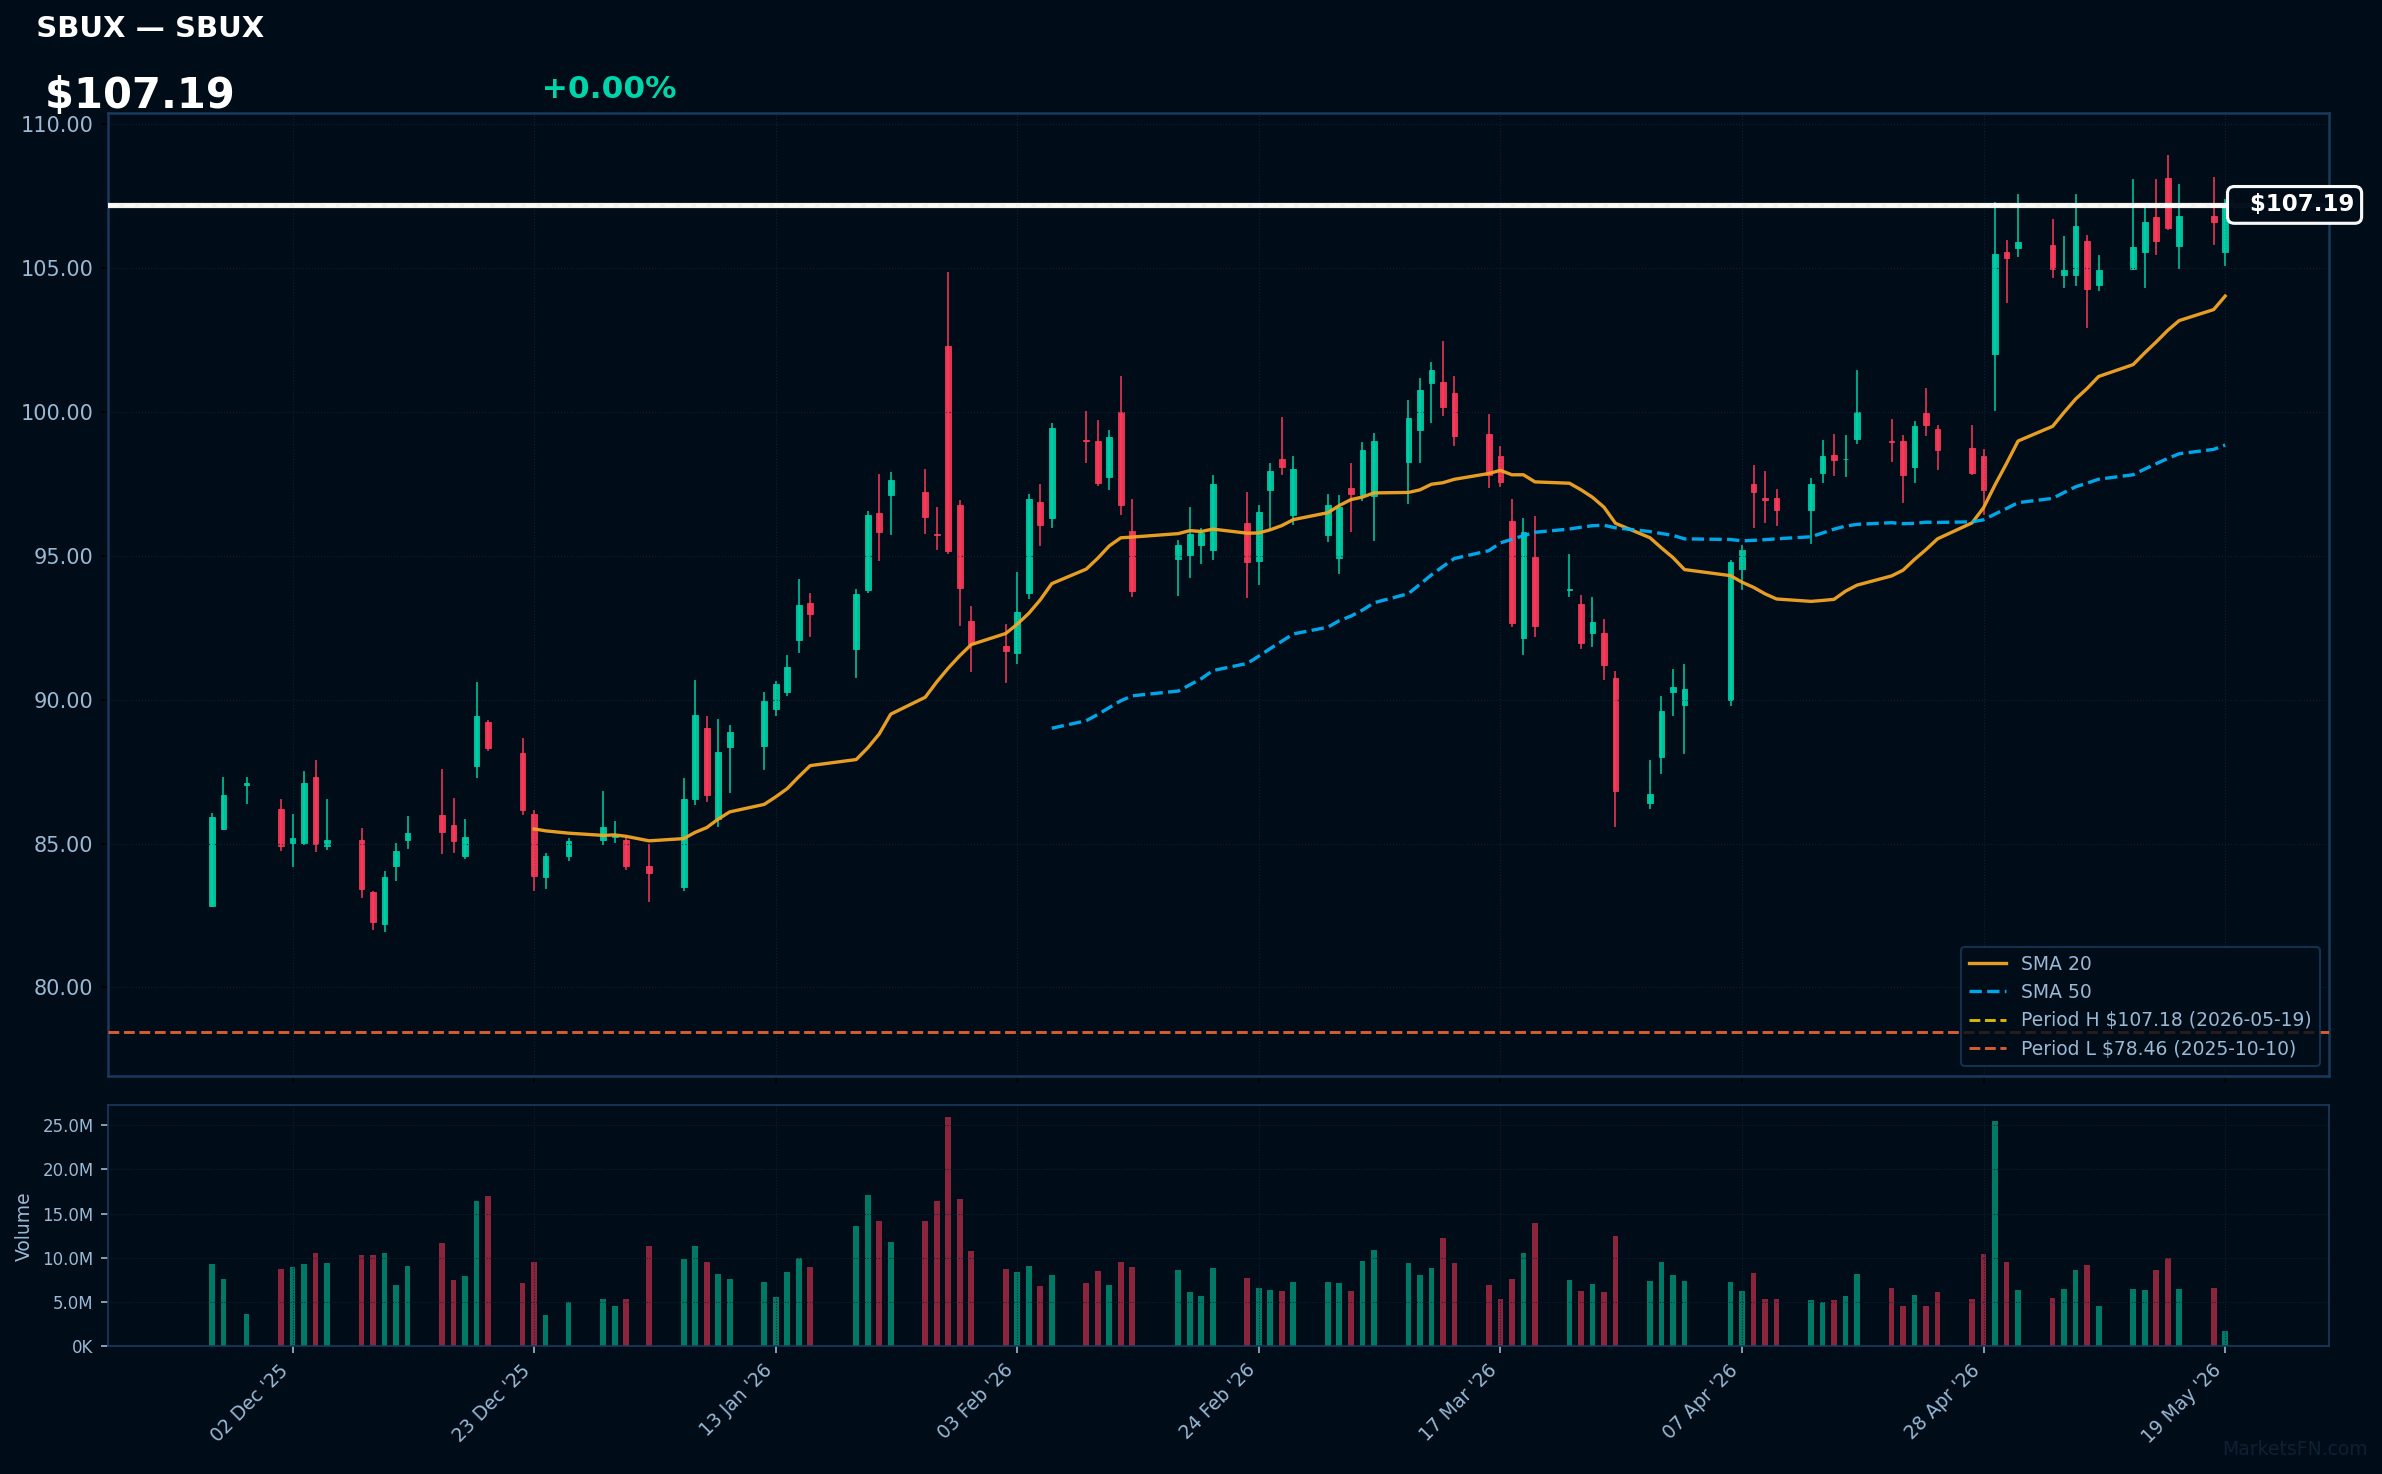
SBUX | Starbucks Corp | Consumer Cyclical | Price Last: $107.18 | % Realized: +26.68% | RSI: 66.0 | % above MA200: +17.9% | Trend: Above MA20, MA50, MA200
Commentary unavailable.
Related headlines
- Starbucks is launching a limited-edition Miffy merchandise collection in the U.S. and Canada
- Starbucks Corporation Announces Pricing Terms for its Upsized Tender Offers for Eight Series of Notes
- Starbucks to cut 300 corporate roles in US report
- Starbucks to open first corporate office in India for tech expansion
📉 Nearest to 52-Week Low
Sectors represented: Basic Materials (2), Industrials (2), Utilities (1)
| Ticker | Company | Sector | Price Last | % Realized | 52-Week Low Date | RSI | % above MA200 | Trend |
|---|---|---|---|---|---|---|---|---|
| SHW | Sherwin-Williams Co | Basic Materials | $298.83 | -17.45% | 2026-05-19 | 34.4 | -12.2% | Below MA20, MA50, MA200 |
| ECL | Ecolab, Inc | Basic Materials | $245.85 | -5.93% | 2026-05-19 | 32.7 | -9.7% | Below MA20, MA50, MA200 |
| VST | Vistra Corp | Utilities | $134.71 | -14.37% | 2026-05-19 | 31.6 | -23.0% | Below MA20, MA50, MA200 |
| XYL | Xylem Inc | Industrials | $106.77 | -16.59% | 2026-05-19 | 29.0 | -21.1% | Below MA20, MA50, MA200 |
| IR | Ingersoll-Rand Inc | Industrials | $68.83 | -17.62% | 2026-05-19 | 28.6 | -16.1% | Below MA20, MA50, MA200 |
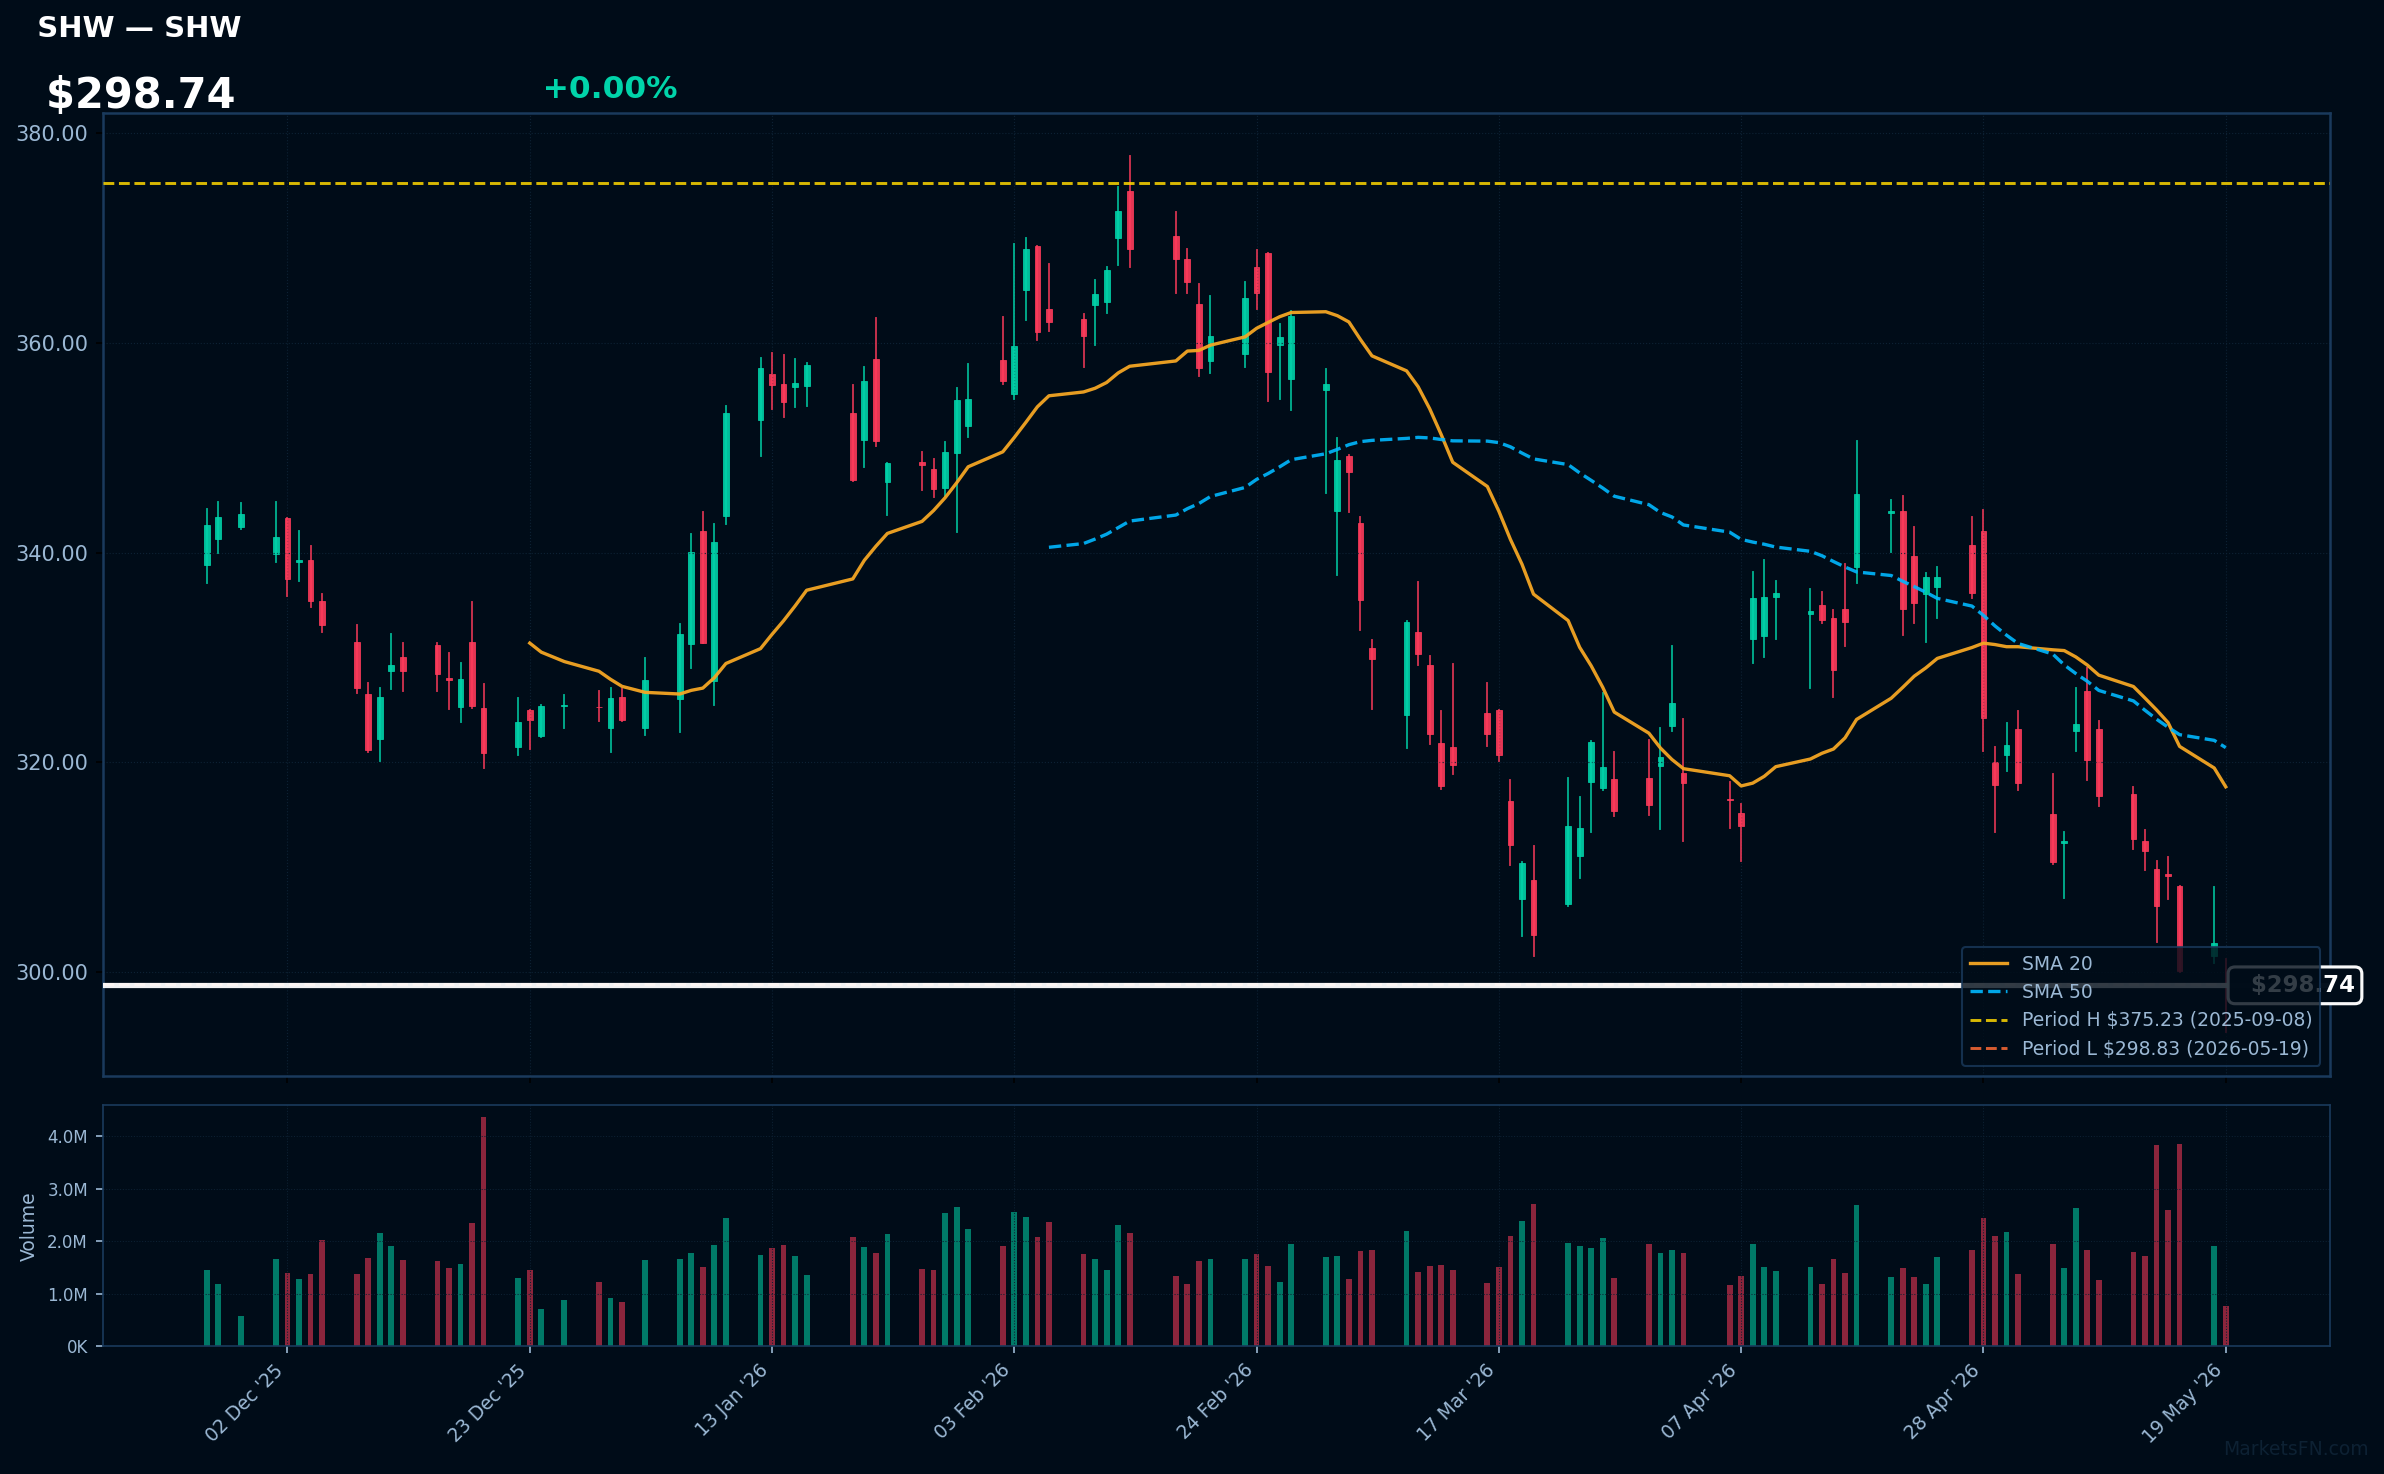
SHW | Sherwin-Williams Co | Basic Materials | Price Last: $298.83 | % Realized: -17.45% | RSI: 34.4 | % above MA200: -12.2% | Trend: Below MA20, MA50, MA200
Commentary unavailable.
Related headlines
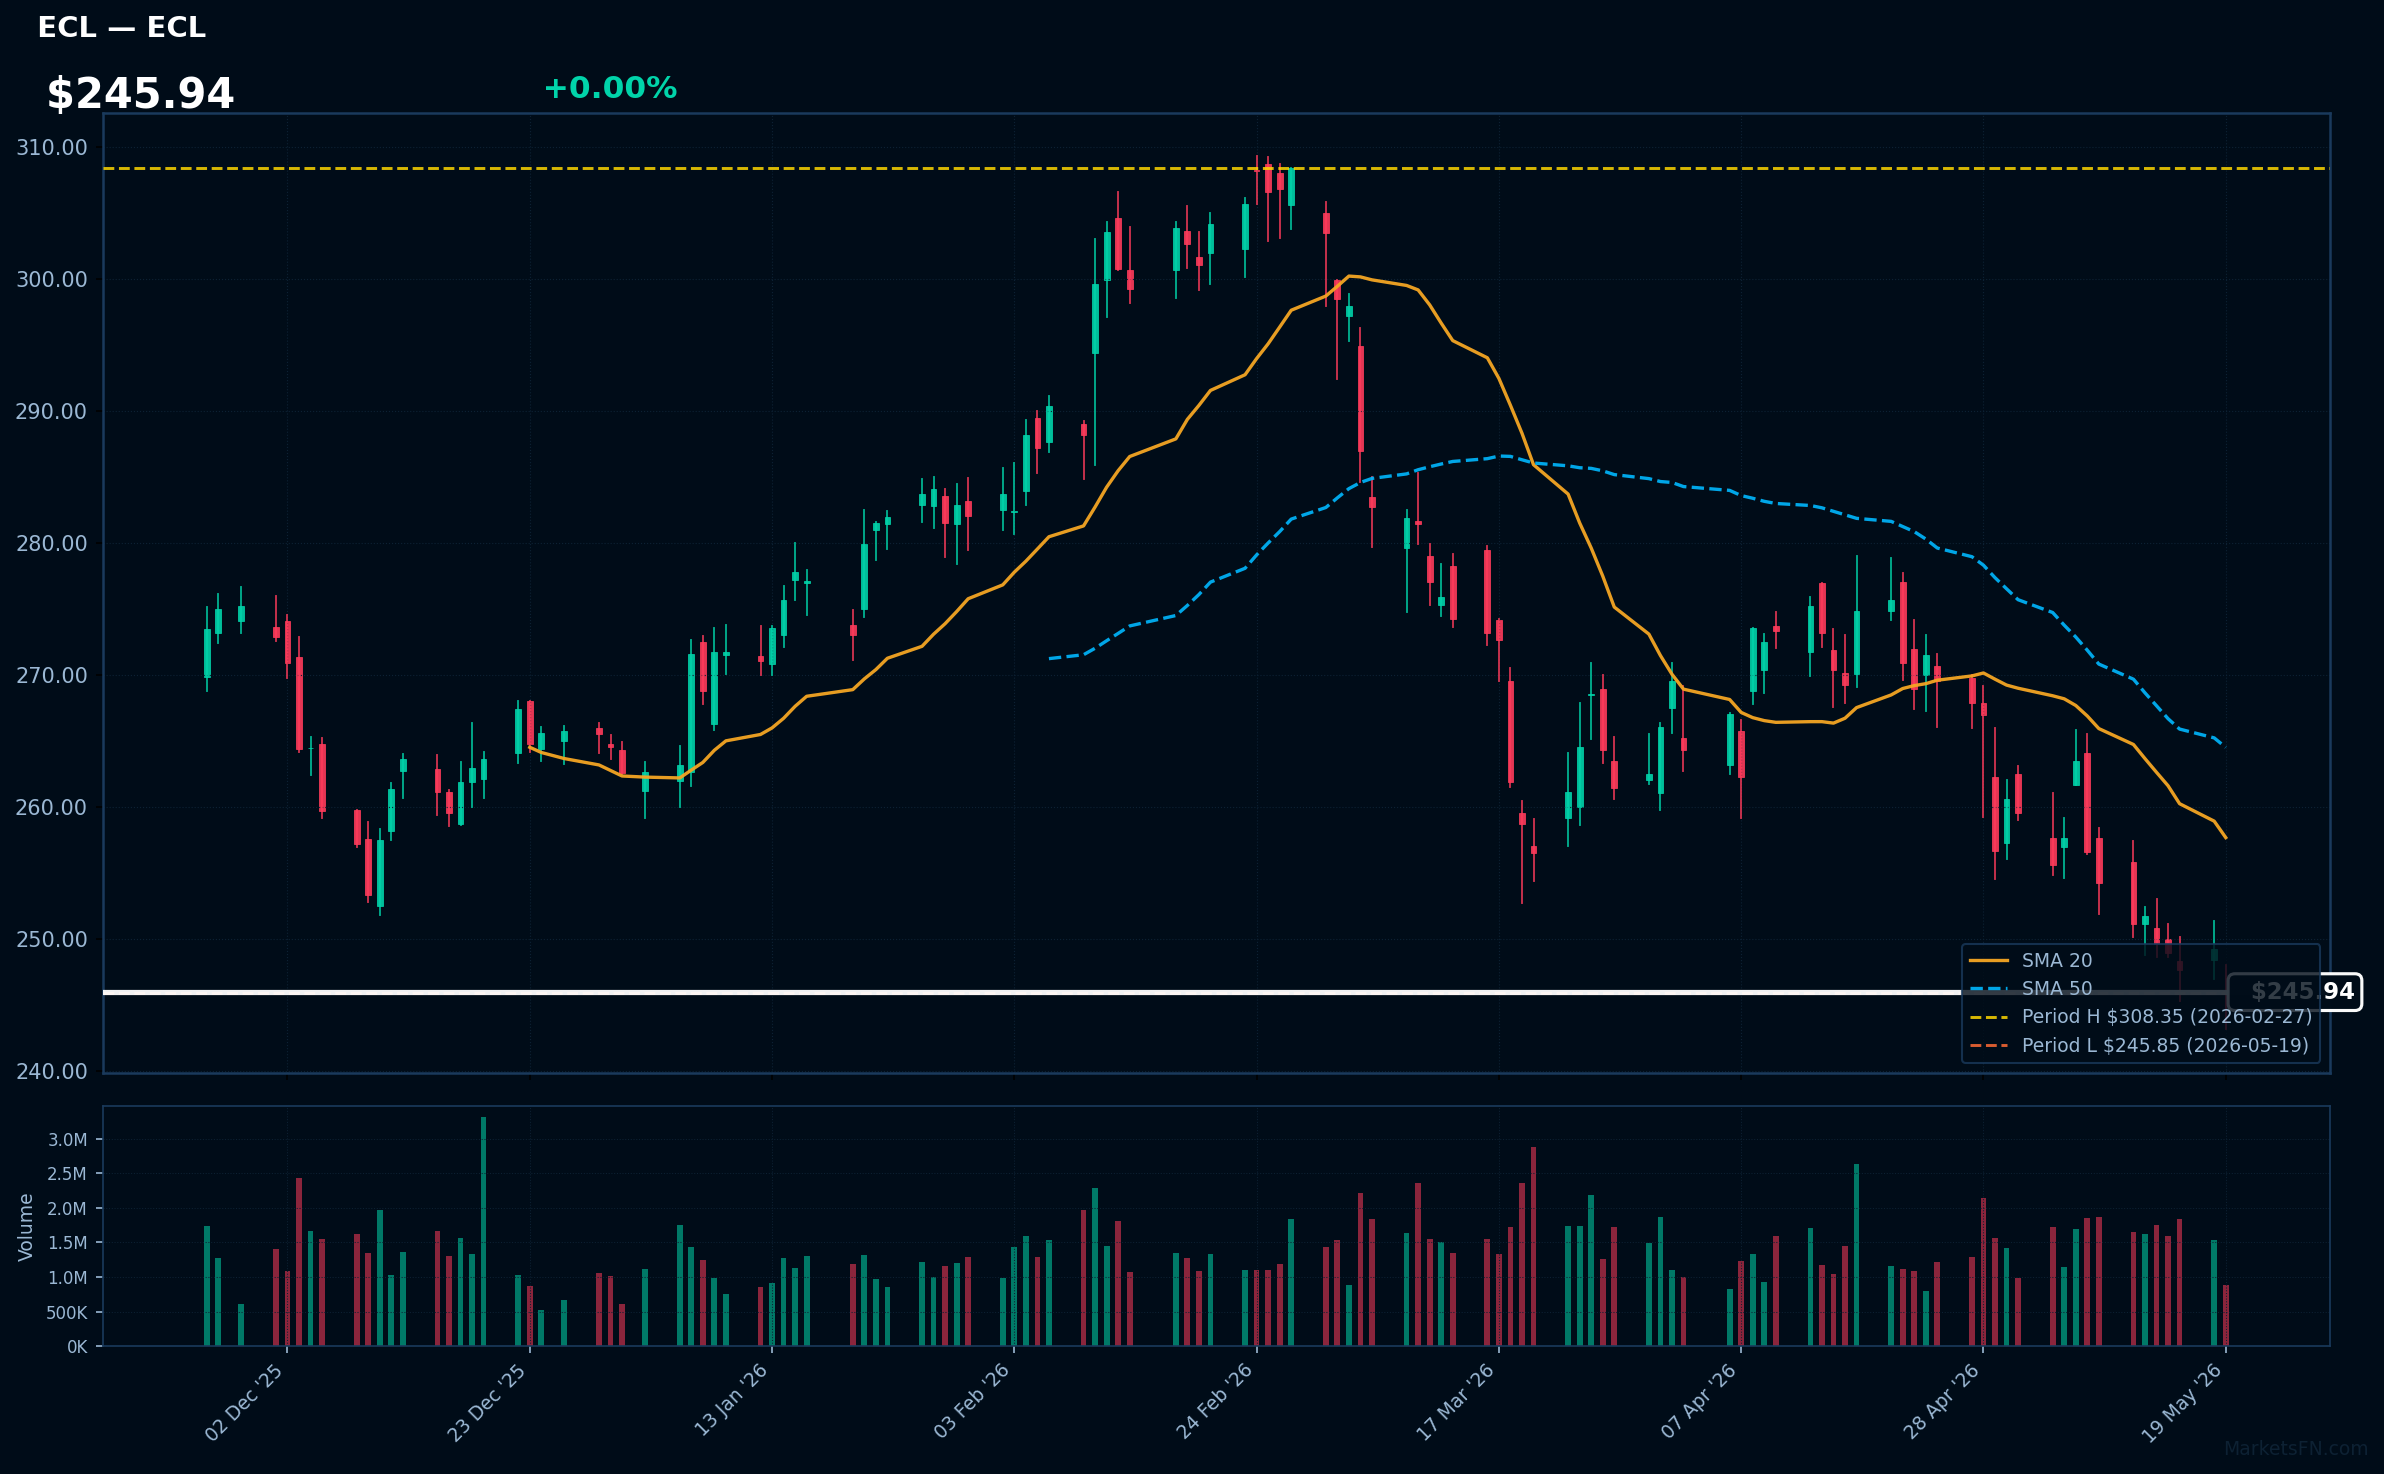
ECL | Ecolab, Inc | Basic Materials | Price Last: $245.85 | % Realized: -5.93% | RSI: 32.7 | % above MA200: -9.7% | Trend: Below MA20, MA50, MA200
Commentary unavailable.
Related headlines
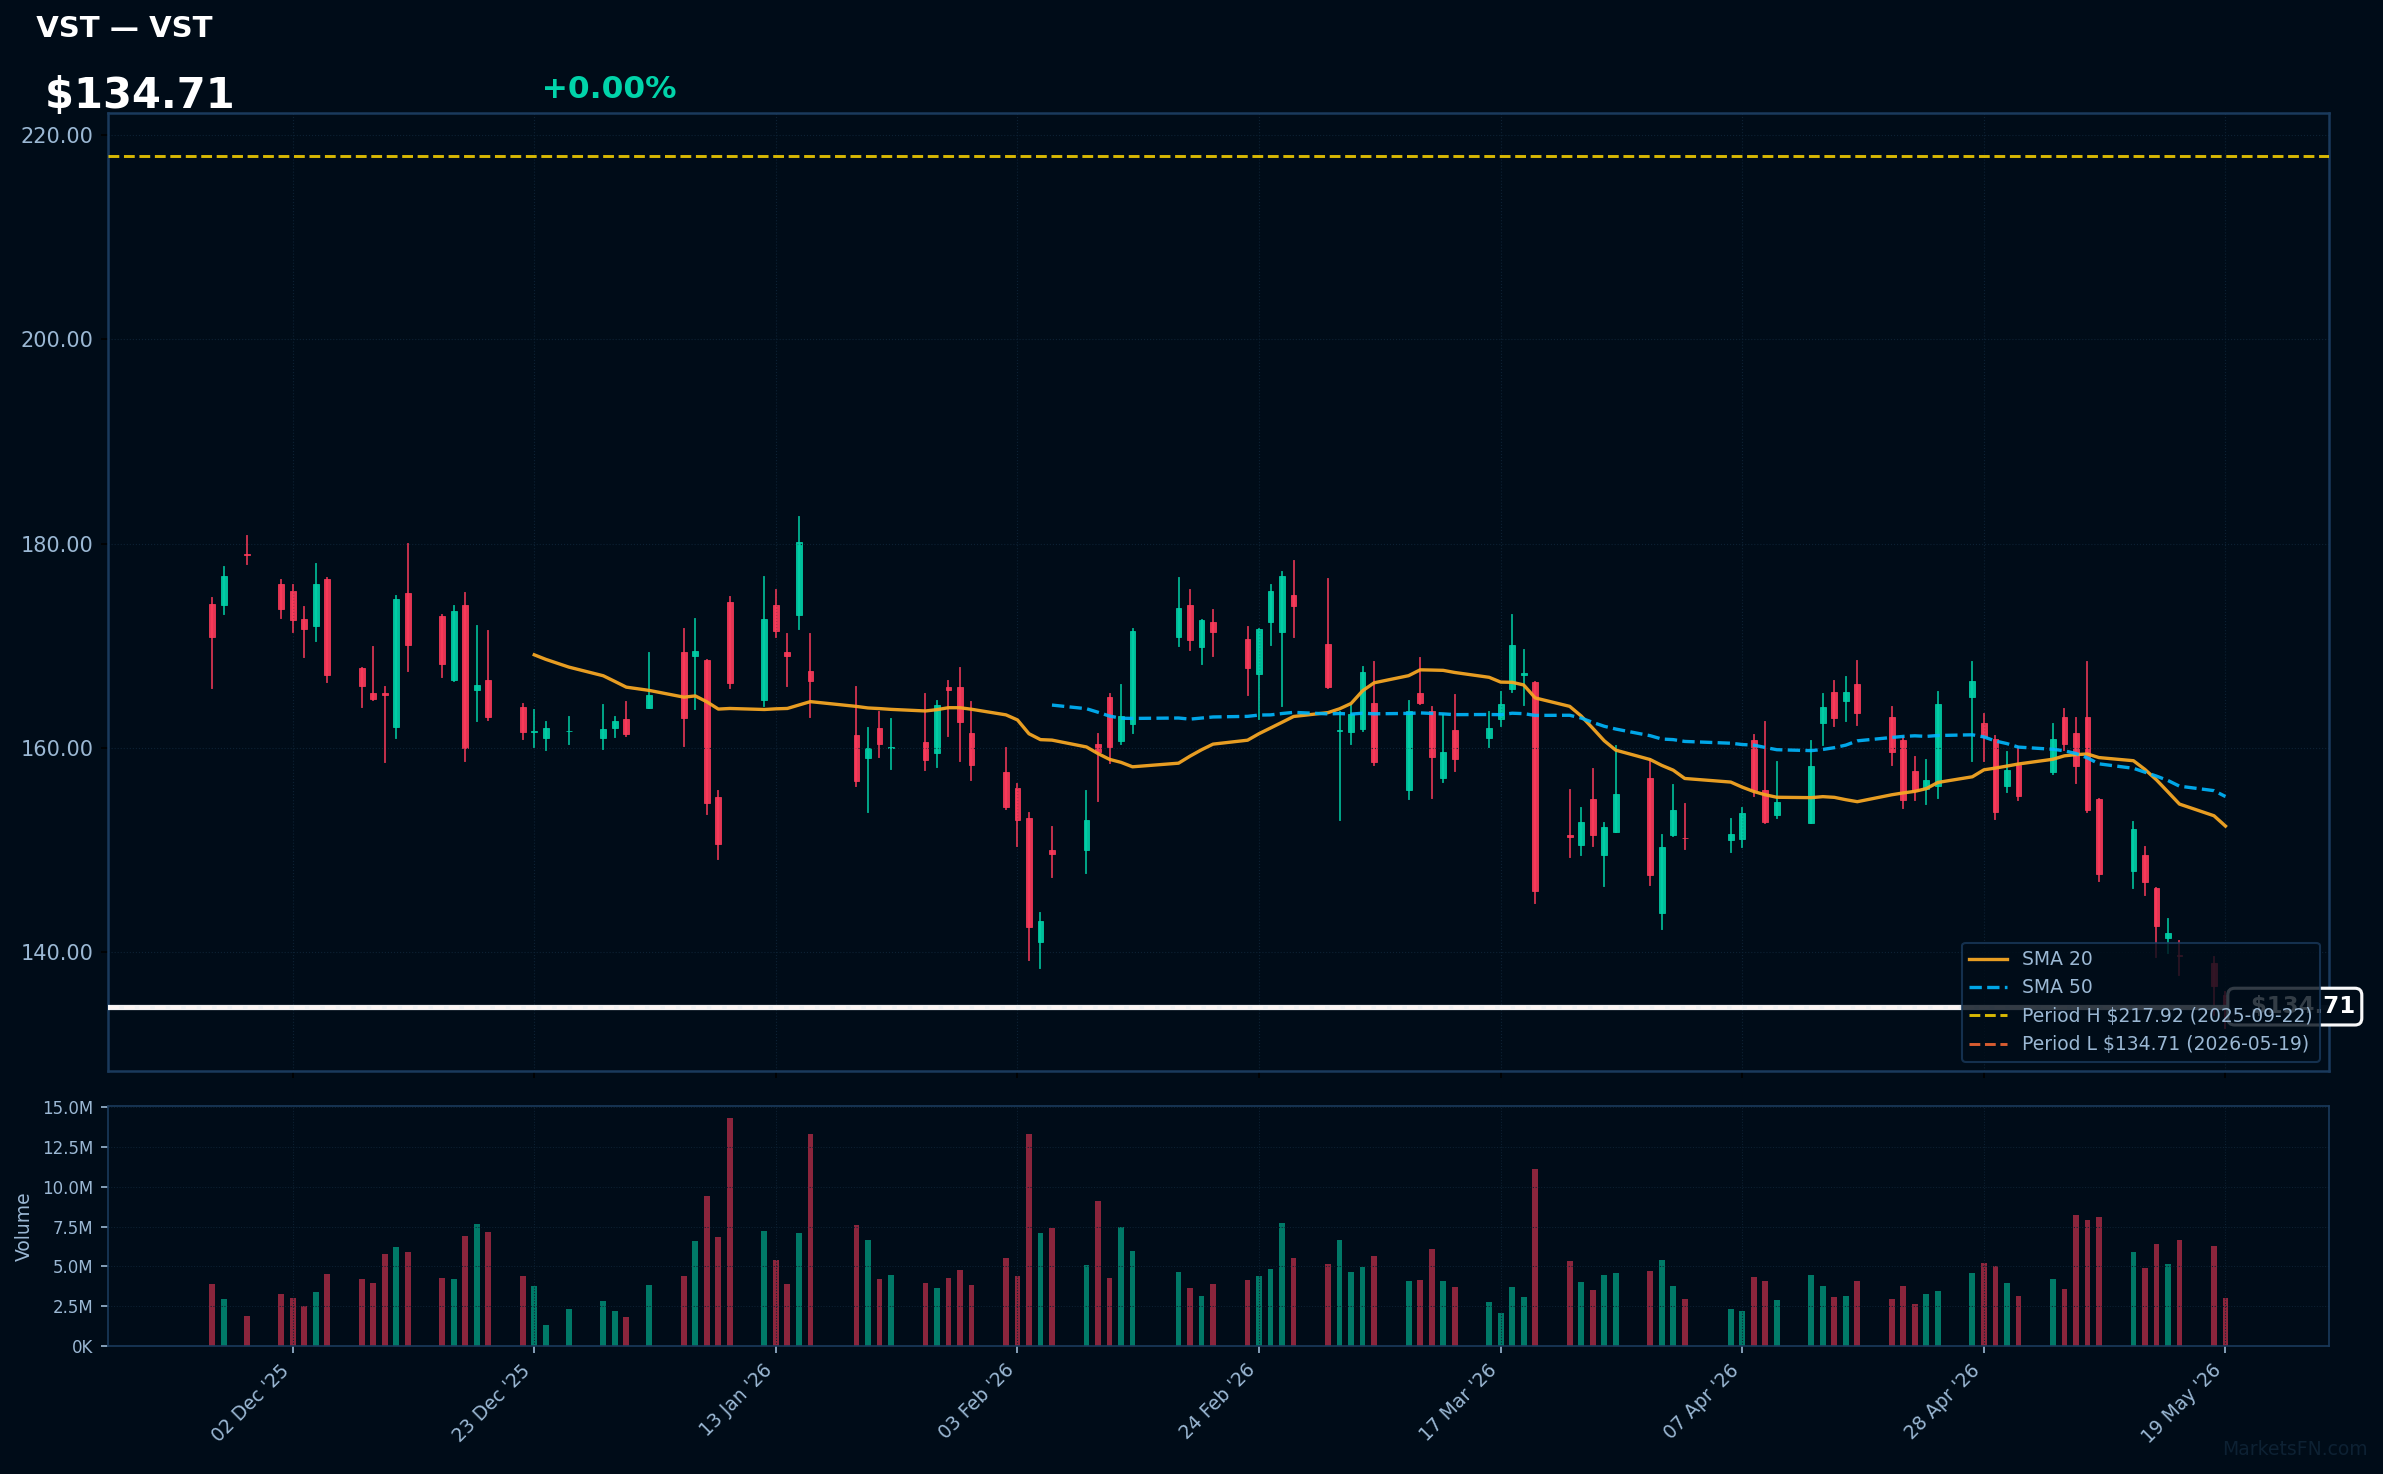
VST | Vistra Corp | Utilities | Price Last: $134.71 | % Realized: -14.37% | RSI: 31.6 | % above MA200: -23.0% | Trend: Below MA20, MA50, MA200
Commentary unavailable.
Related headlines
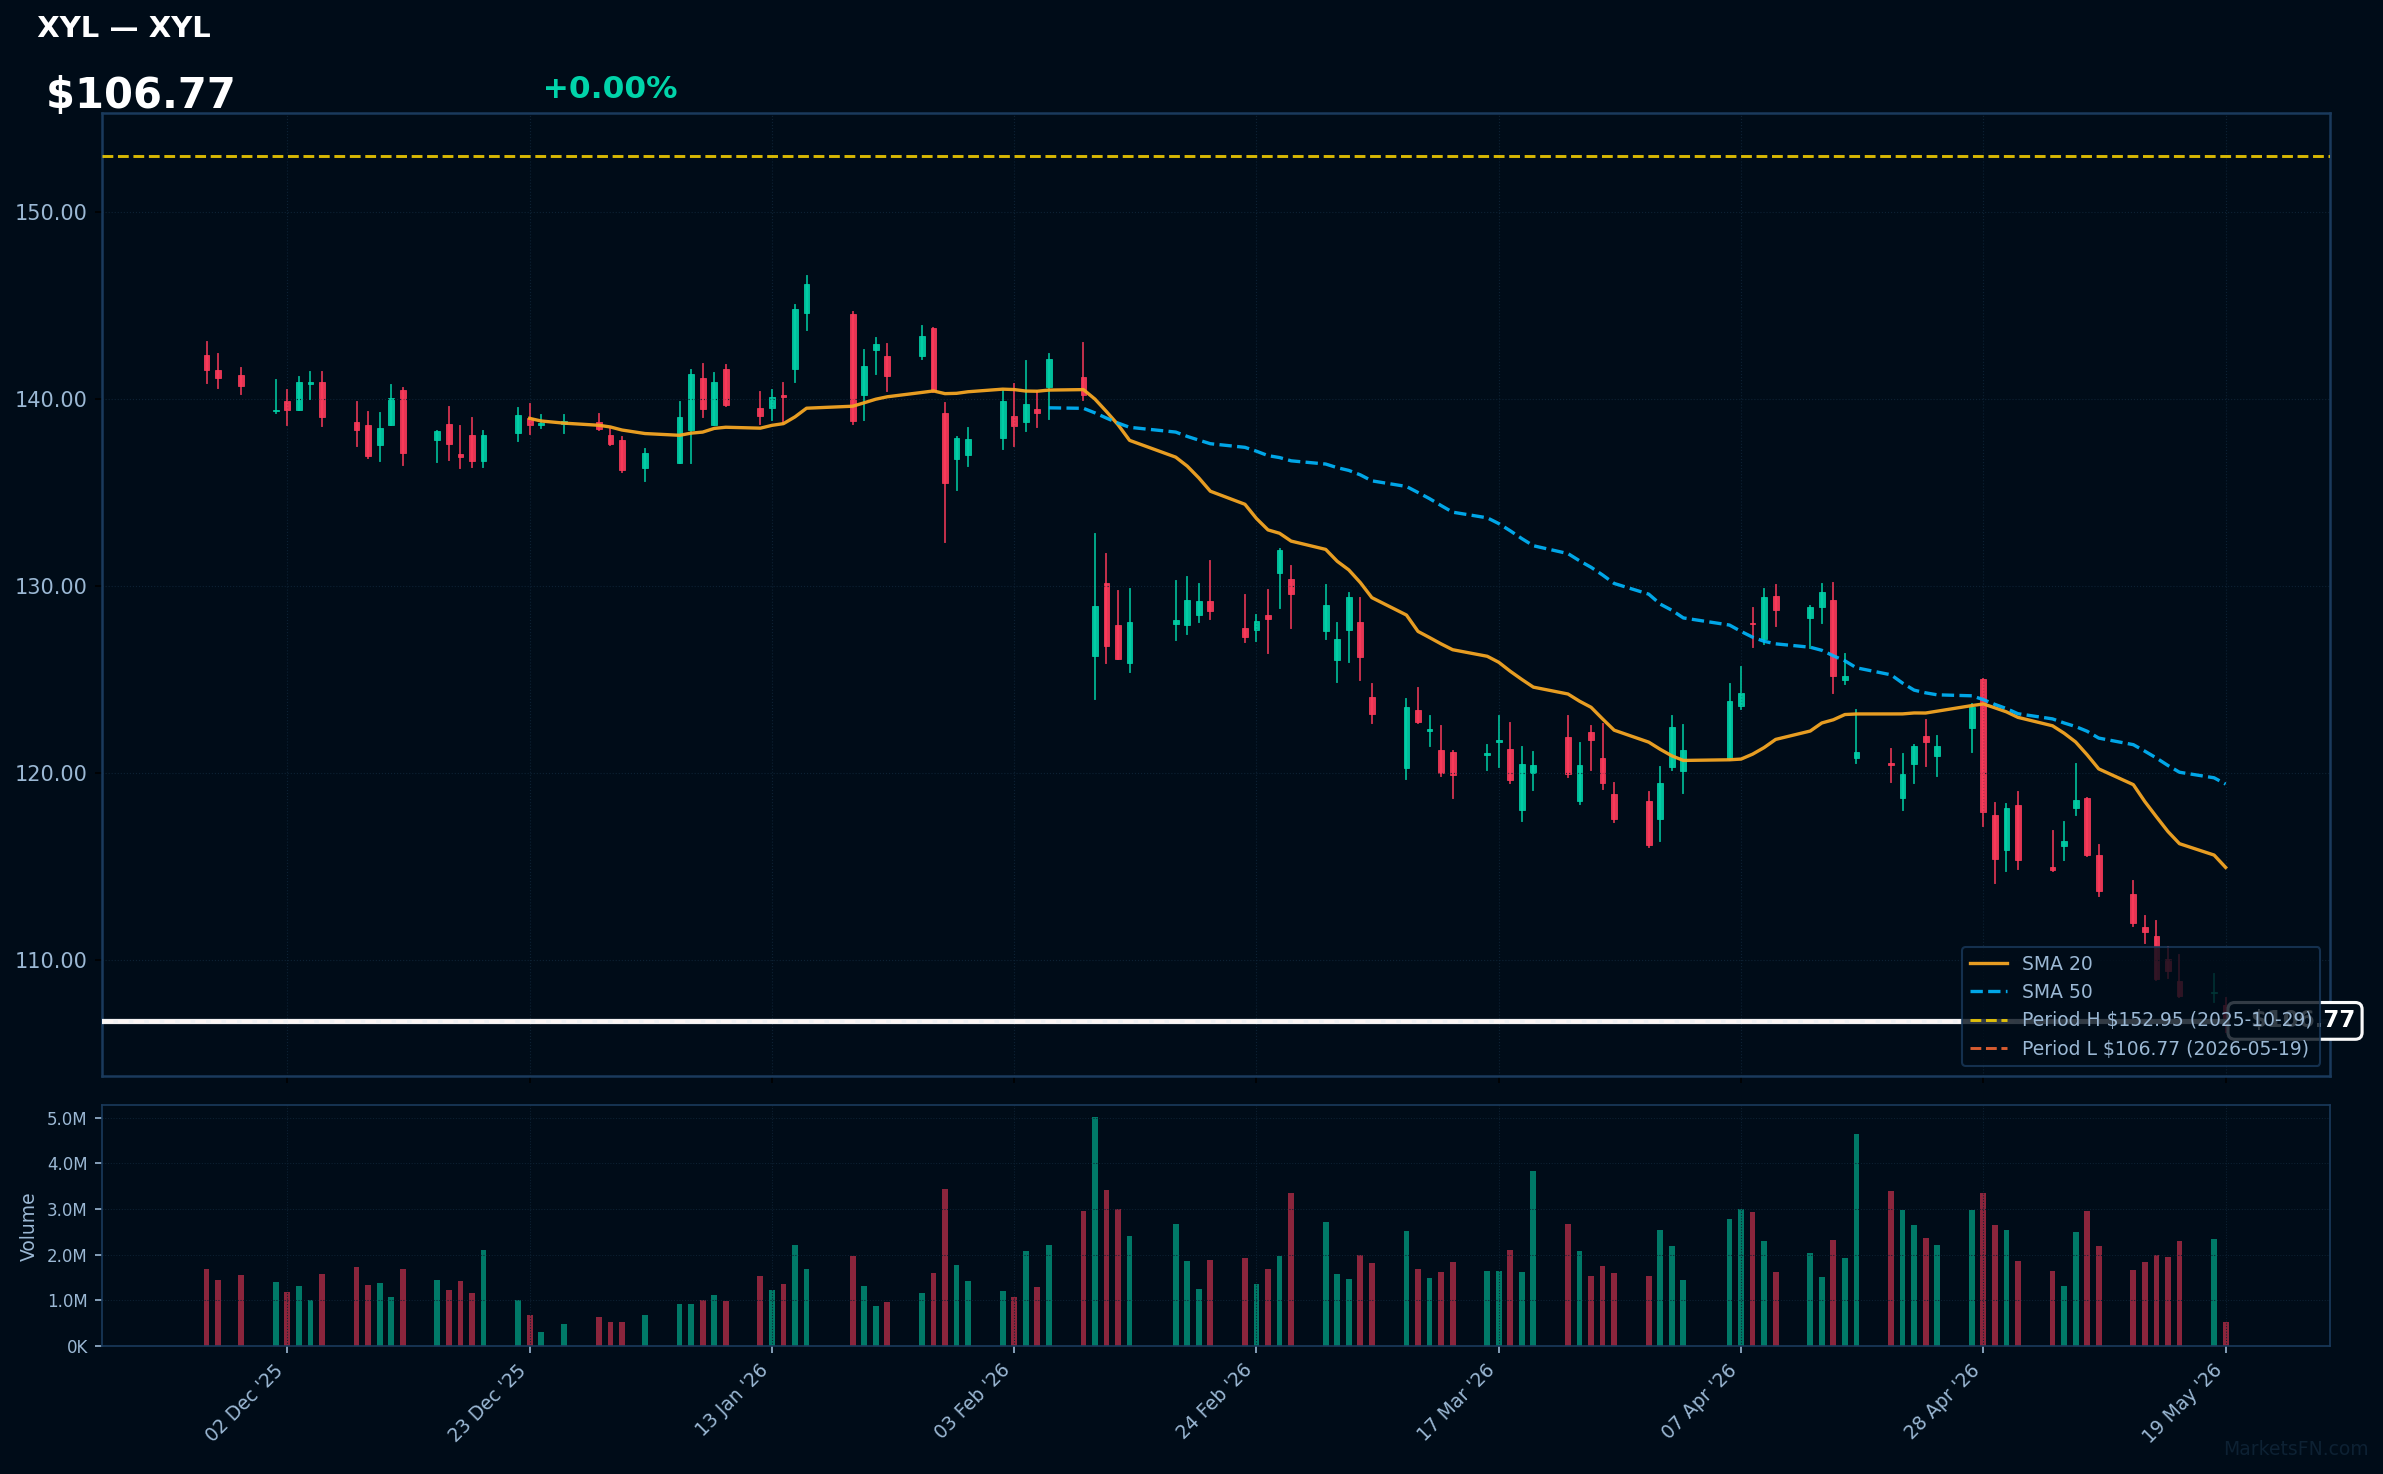
XYL | Xylem Inc | Industrials | Price Last: $106.77 | % Realized: -16.59% | RSI: 29.0 | % above MA200: -21.1% | Trend: Below MA20, MA50, MA200
Commentary unavailable.
Related headlines
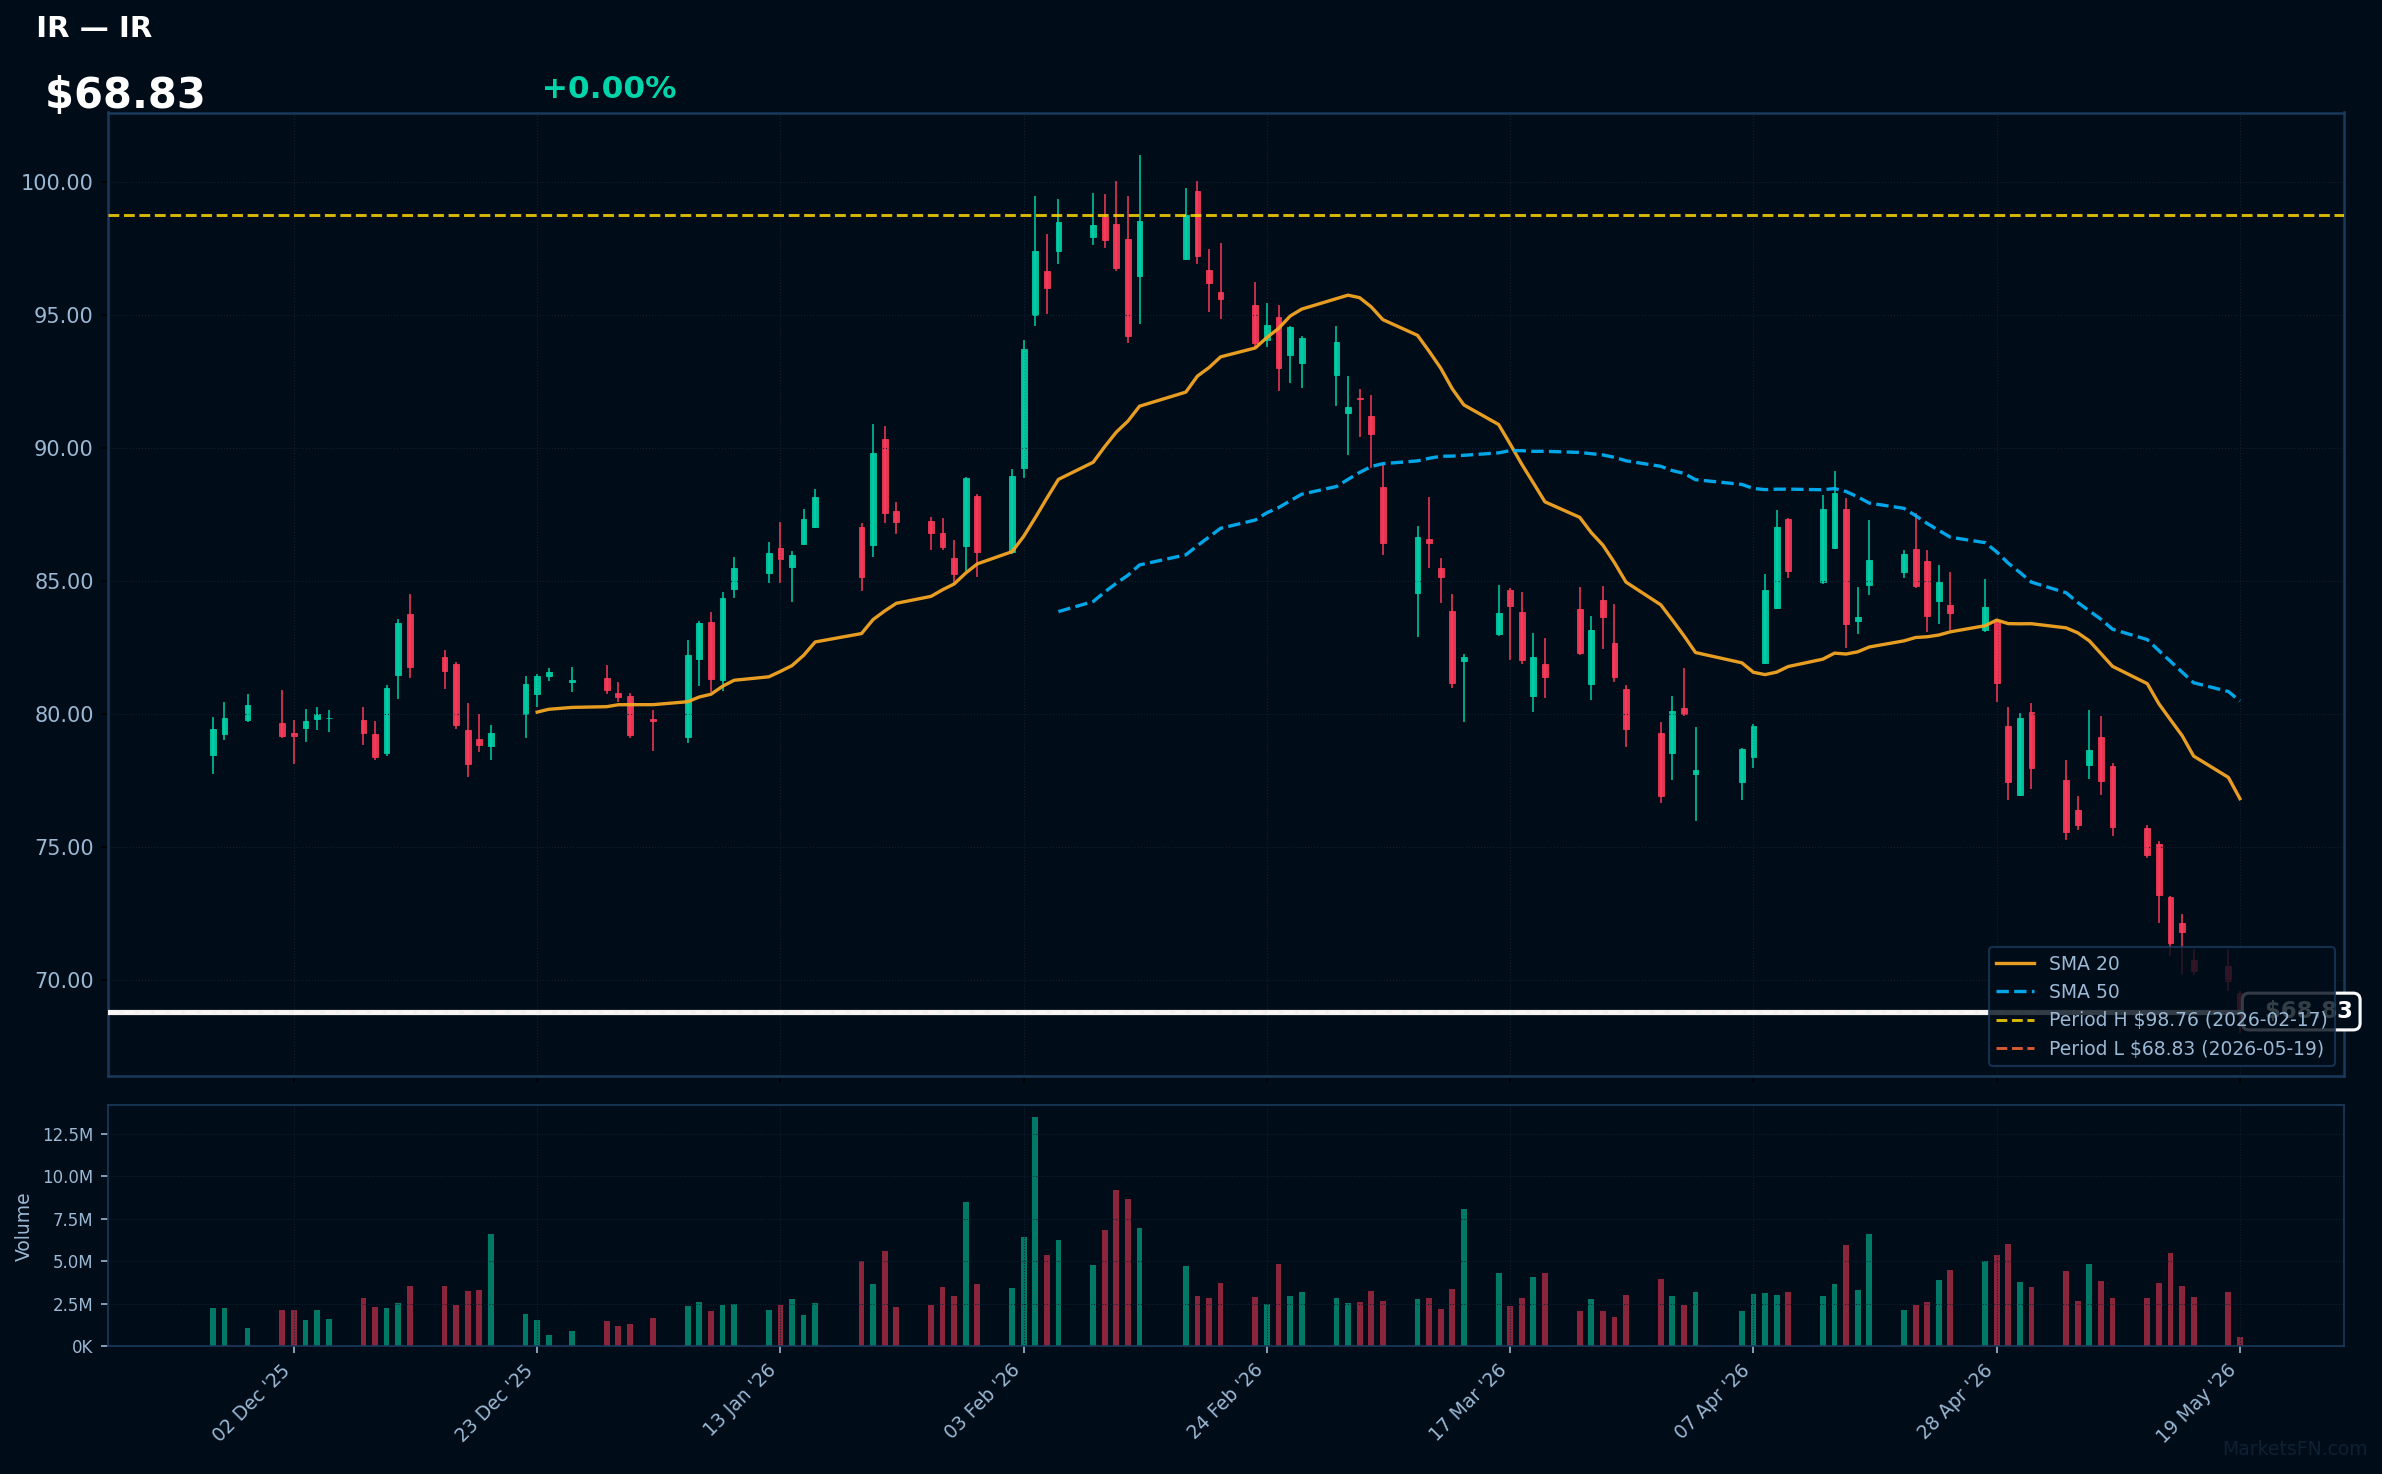
IR | Ingersoll-Rand Inc | Industrials | Price Last: $68.83 | % Realized: -17.62% | RSI: 28.6 | % above MA200: -16.1% | Trend: Below MA20, MA50, MA200
Commentary unavailable.
Related headlines
Market Commentary
Commentary unavailable.
Methodology: All 503 S&P 500 constituents screened. 52-week high = highest daily close over the past 252 trading days (approx. 1 year). 52-week low = lowest daily close over the same period. Distance = (current price / extreme − 1) × 100. Technical indicators computed on up to 1 year of daily OHLCV data.
Disclaimer: For informational purposes only. Not investment advice. Past performance is not indicative of future results.