Solana Holds at $72 as RSI Nears Midpoint, Eyes Rebound
· Crypto · QuoteReporter
Solana Holds at $72 as RSI Nears Midpoint, Eyes Rebound
Solana (SOL/USD) | June 17, 2026 $72.0200 -1.90%
🔍 Technical Analysis
### **Technical Analysis: Solana (SOL)**
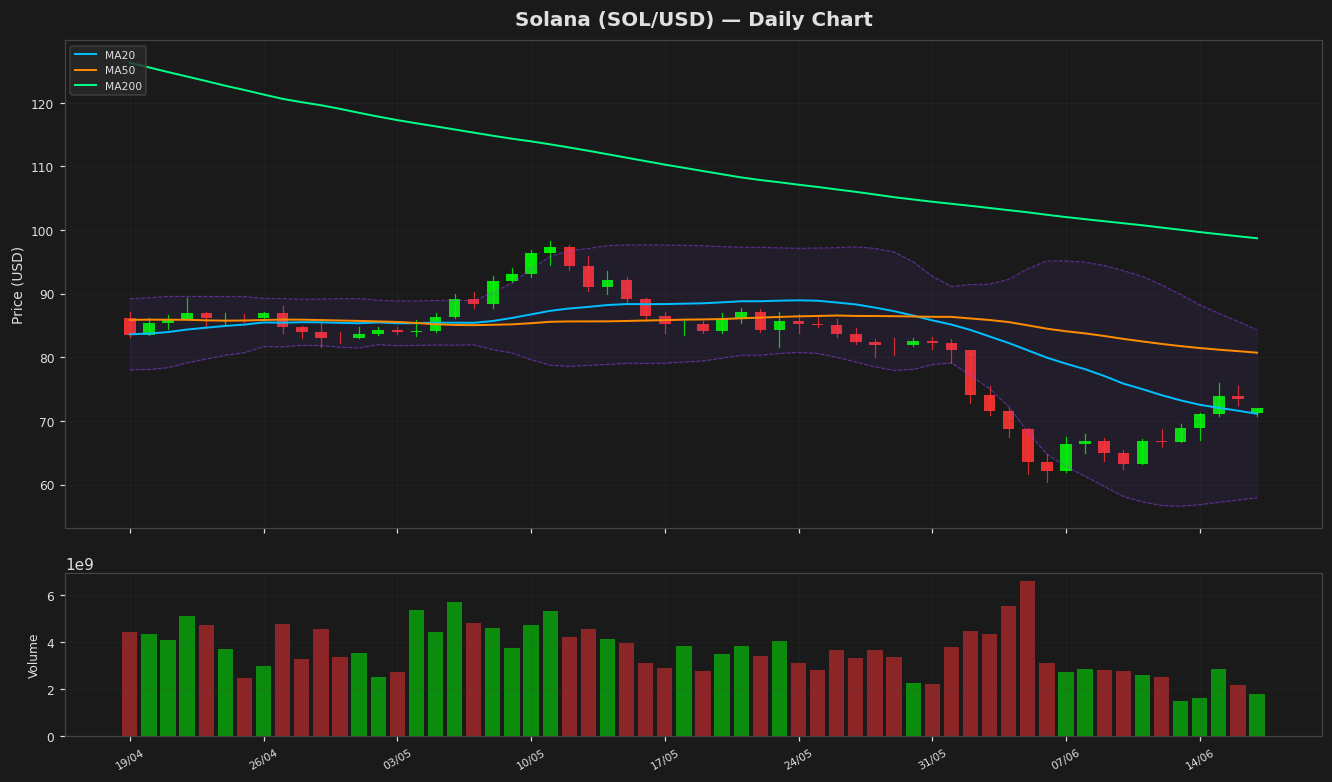
Solana (SOL) is currently trading at **$72.02**, down **1.90%** on the day, reflecting short-term bearish pressure. The price remains above the **20-day moving average (MA20) at $71.11**, suggesting near-term support, but below the **50-day MA ($80.73)** and **200-day MA ($98.70)**, indicating a broader downtrend.
Bollinger Bands show volatility contraction, with the upper band at **$84.29** and the lower band at **$57.94**. Price hovering near the middle band suggests consolidation, with a potential breakout needed for directional bias.
The **RSI (14) at 50.67** is neutral, neither overbought nor oversold, lacking strong momentum. The **MACD (-2.91)** remains below its signal line (-4.12), reinforcing bearish sentiment, though the histogram shows slight convergence, hinting at weakening downward momentum.
Key support levels are **$71.11 (MA20)** and **$57.94 (BB lower band)**, while resistance lies at **$80.73 (MA50)** and **$84.29 (BB upper band)**. A break above $80.73 could signal recovery, whereas failure to hold $71.11 may lead to a retest of the yearly low near **$60.41**.
Given the mixed signals, traders should watch for a decisive move above MA50 or a breakdown below MA20 for confirmation of the next trend.
Technical Metrics
| Metric | Value |
|---|---|
| Current Price | $72.0200 |
| Daily Change | -1.90% |
| MA 20 | $71.1134 |
| % from MA20 | +1.27% |
| MA 50 | $80.7269 |
| % from MA50 | -10.79% |
| MA 200 | $98.7027 |
| % from MA200 | -27.03% |
| BB Upper | $84.2917 |
| % from BB Upper | -14.56% |
| BB Lower | $57.9351 |
| % from BB Lower | +24.31% |
| RSI (14) | 50.67 |
| MACD | -2.909150 |
| MACD Signal | -4.121478 |
| ATR (14) | 3.993481 |
| 3-Day High | $75.9388 |
| 3-Day Low | $70.7682 |
| 52-Week High | $229.3158 |
| % from 52W High | -68.59% |
| 52-Week Low | $60.4147 |
| % from 52W Low | +19.21% |
| YTD High | $148.2160 |
| % from YTD High | -51.41% |
| YTD Low | $60.4147 |
| % from YTD Low | +19.21% |
📊 Market Commentary
Solana (SOL) is currently trading at $72.02, down 1.90% today, as the broader crypto market shows mixed sentiment. The Relative Strength Index (RSI) at 50.7 indicates neutral momentum, neither overbought nor oversold, suggesting a balanced tug-of-war between buyers and sellers. SOL’s 52-week range of $60.41 to $229.31 highlights its volatility, with the current price sitting closer to the lower bound, reflecting the cautious stance of traders amid recent market uncertainty.
Market sentiment around Solana remains divided. On one hand, its strong ecosystem, high-speed transactions, and growing decentralized application (dApp) activity continue to attract long-term holders. On the other hand, macroeconomic concerns and fluctuating Bitcoin prices have weighed on short-term trader confidence. Key support levels to watch include $70, a psychological threshold, and the yearly low near $60.41. A break below $60 could signal further downside, while holding above $70 may reinforce stability. Resistance is seen near $80, a level that has previously acted as both support and resistance.
Traders are closely monitoring network activity, particularly transaction volumes and developer engagement, as indicators of Solana’s health. Additionally, broader market trends, including Bitcoin’s performance and macroeconomic factors like interest rate decisions, remain critical drivers for SOL’s near-term price action. For now, the neutral RSI suggests a wait-and-see approach among market participants.
Disclaimer
The content on MarketsFN.com is provided for educational and informational purposes only. It does not constitute financial advice or investment recommendations. All investments involve risk. Cryptocurrency markets are highly volatile. Past performance does not guarantee future results.