"Solana Plunges Below $66 as RSI Hits Extreme Oversold at 8.9"
· Crypto · QuoteReporter
"Solana Plunges Below $66 as RSI Hits Extreme Oversold at 8.9"
Solana (SOL/USD) | June 05, 2026 $66.0600 -3.87%
🔍 Technical Analysis
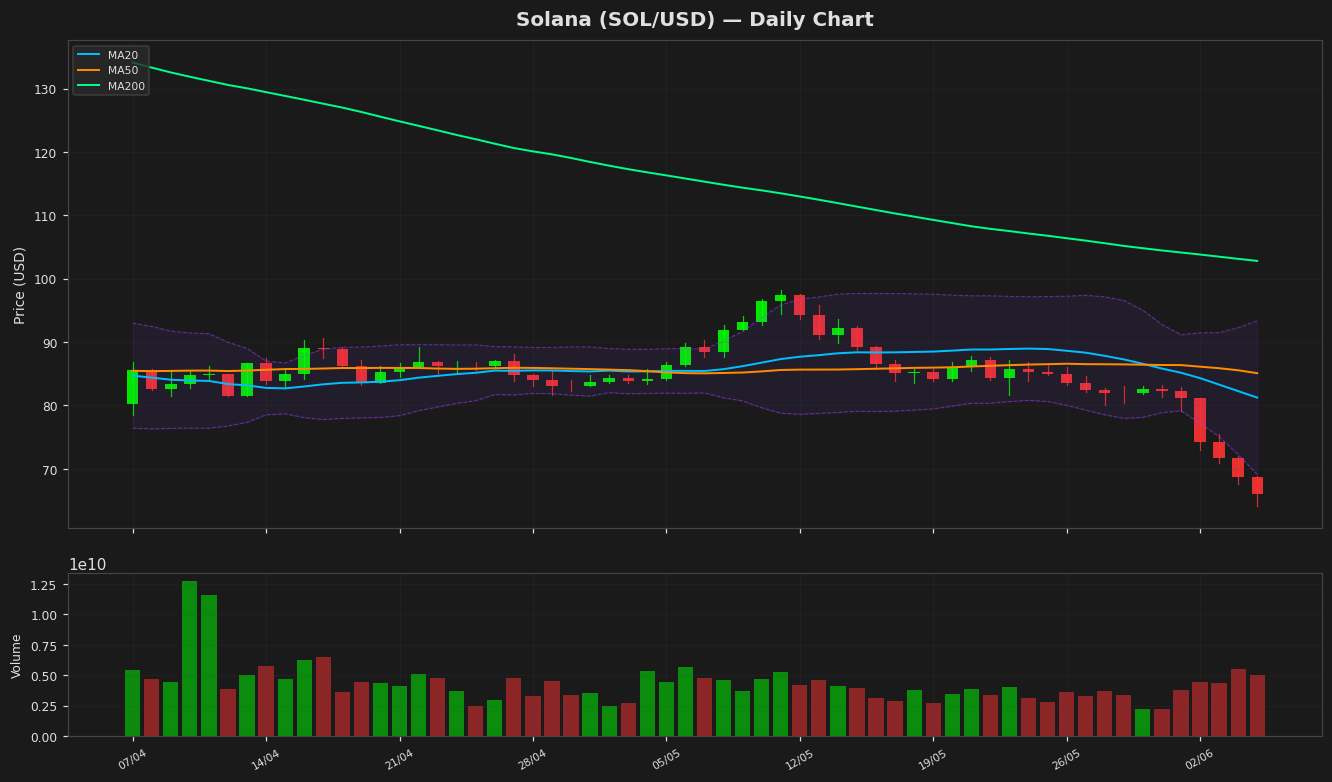
Solana (SOL) is currently trading at $66.06, reflecting a 3.87% decline on the daily chart. The price remains significantly below all major moving averages, with the 20-day MA at $81.22, the 50-day MA at $85.08, and the 200-day MA at $102.80, indicating strong bearish momentum. The Bollinger Bands show a wide spread, with the upper band at $93.35 and the lower band at $69.09, suggesting heightened volatility. The price is hovering near the lower band, which may indicate an oversold condition, though further downside cannot be ruled out. The RSI(14) is extremely oversold at 8.86, a rare reading that often precedes a short-term bounce or consolidation. The MACD histogram is deeply negative at -4.32, with the signal line at -2.48, reinforcing bearish momentum. Key support lies at the yearly low of $64.07, while resistance is found near the 20-day MA at $81.22. The 52-week high of $237.32 contrasts sharply with current levels, highlighting the extent of the downtrend. Given the extreme RSI and proximity to critical support, a relief rally may emerge, but sustained recovery would require reclaiming the 20-day MA. The ATR(14) of 3.55 confirms ongoing volatility.
Technical Metrics
| Metric | Value |
|---|---|
| Current Price | $66.0600 |
| Daily Change | -3.87% |
| MA 20 | $81.2221 |
| % from MA20 | -18.67% |
| MA 50 | $85.0753 |
| % from MA50 | -22.35% |
| MA 200 | $102.7951 |
| % from MA200 | -35.74% |
| BB Upper | $93.3526 |
| % from BB Upper | -29.24% |
| BB Lower | $69.0916 |
| % from BB Lower | -4.39% |
| RSI (14) | 8.86 |
| MACD | -4.323686 |
| MACD Signal | -2.476241 |
| ATR (14) | 3.551567 |
| 3-Day High | $75.5434 |
| 3-Day Low | $64.0750 |
| 52-Week High | $237.3225 |
| % from 52W High | -72.16% |
| 52-Week Low | $64.0750 |
| % from 52W Low | +3.10% |
| YTD High | $148.2160 |
| % from YTD High | -55.43% |
| YTD Low | $64.0750 |
| % from YTD Low | +3.10% |
📊 Market Commentary
Solana (SOL) is currently trading at $66.06, down 3.87% today, as bearish momentum continues to dominate the market. The Relative Strength Index (RSI) sits at an extremely oversold 8.9, signaling intense selling pressure and potential exhaustion among sellers. SOL is now testing the lower bounds of its 52-week range ($64.08 – $237.32), with the $64 support level being closely watched. A breach below this could trigger further downside, while a rebound may attract bargain hunters.
Market sentiment remains cautious, with SOL underperforming amid broader crypto weakness. Traders are monitoring Bitcoin’s price action, as SOL often correlates with BTC’s movements. Additionally, network activity and developer engagement—key drivers of Solana’s long-term value—are being scrutinized. Despite recent declines, Solana’s high-speed blockchain and strong ecosystem continue to draw attention, though short-term sentiment is weighed down by macroeconomic uncertainty and risk-off behavior.
Key resistance levels to watch include $70 and $75, which could act as hurdles for any recovery. On-chain metrics, such as exchange inflows and whale activity, are also being tracked for signs of accumulation or distribution. Given the extreme RSI, a short-term bounce is possible, but traders remain wary until broader market conditions stabilize. For now, SOL’s price action hinges on whether $64 holds as support or if further downside unfolds.
Disclaimer
The content on MarketsFN.com is provided for educational and informational purposes only. It does not constitute financial advice or investment recommendations. All investments involve risk. Cryptocurrency markets are highly volatile. Past performance does not guarantee future results.