Solana Price Analysis: $71.57, RSI 55.1, Slight Dip at -0.50%
· Crypto · QuoteReporter
Solana Price Analysis: $71.57, RSI 55.1, Slight Dip at -0.50%
Solana (SOL/USD) | June 18, 2026 $71.5700 -0.50%
🔍 Technical Analysis
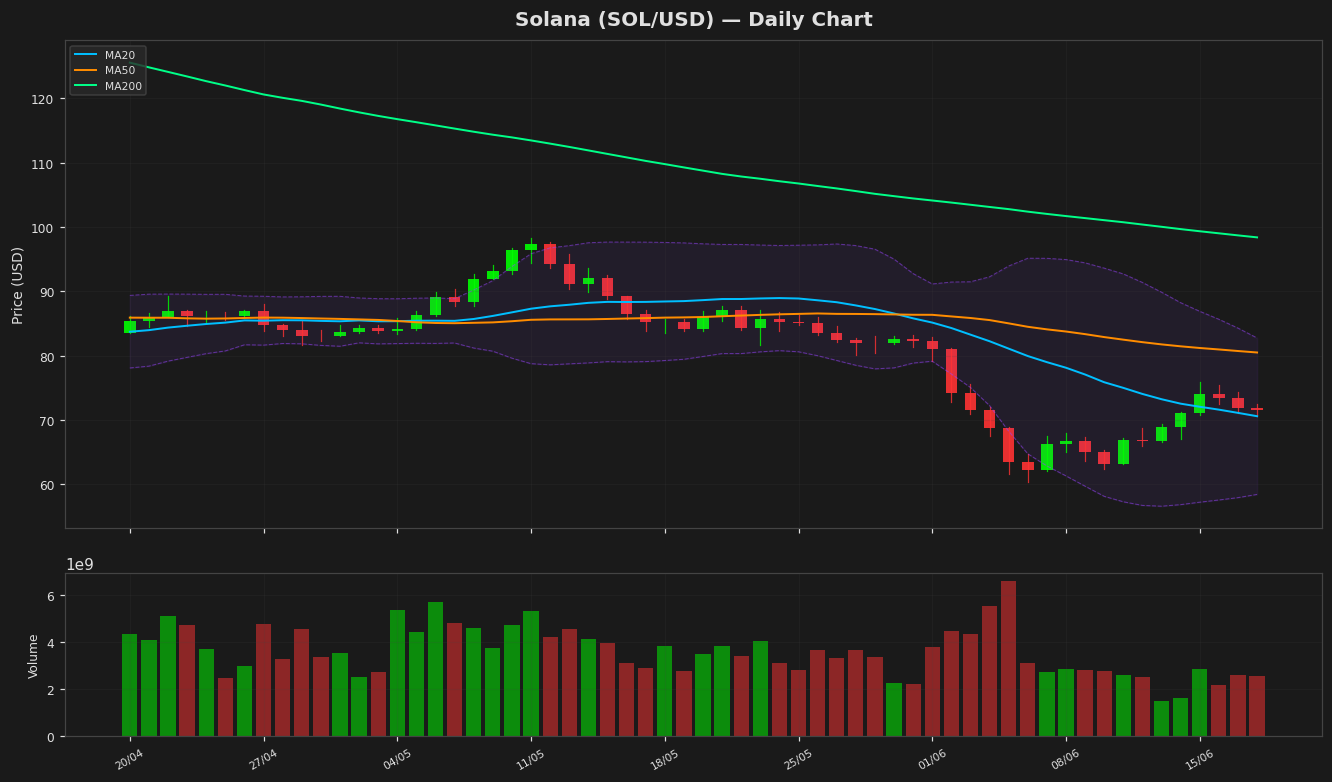
### Technical Analysis: Solana (SOL)
Solana is currently trading at **$71.57**, down **0.50%** on the day, showing mild bearish pressure. The price remains above the **20-day moving average (MA20) at $70.59**, suggesting short-term support, but below the **50-day MA ($80.50)** and **200-day MA ($98.39)**, indicating medium and long-term bearish trends.
Bollinger Bands show a narrowing range, with the upper band at **$82.75** and the lower band at **$58.43**, signaling reduced volatility. The price hovering near the middle band suggests consolidation.
The **RSI (14) at 55.07** is neutral, neither overbought nor oversold, reflecting balanced momentum. The **MACD (-2.63)** remains below its signal line (-3.82), confirming bearish momentum, though the histogram shows a slight convergence, hinting at potential weakening downside pressure.
Key resistance levels are **$80.50 (MA50)** and **$98.39 (MA200)**, while support lies at **$70.59 (MA20)** and **$58.43 (Bollinger Lower Band)**. A break below $70.59 could test the yearly low of **$60.41**, whereas reclaiming $80.50 may signal a bullish reversal.
Given the mixed signals—neutral RSI, bearish MACD, and consolidation within Bollinger Bands—Solana appears to be in a **wait-and-watch phase**, with a decisive move needed for directional clarity.
Technical Metrics
| Metric | Value |
|---|---|
| Current Price | $71.5700 |
| Daily Change | -0.50% |
| MA 20 | $70.5908 |
| % from MA20 | +1.39% |
| MA 50 | $80.4960 |
| % from MA50 | -11.09% |
| MA 200 | $98.3923 |
| % from MA200 | -27.26% |
| BB Upper | $82.7517 |
| % from BB Upper | -13.51% |
| BB Lower | $58.4299 |
| % from BB Lower | +22.49% |
| RSI (14) | 55.07 |
| MACD | -2.631740 |
| MACD Signal | -3.824666 |
| ATR (14) | 3.859920 |
| 3-Day High | $75.4468 |
| 3-Day Low | $70.6570 |
| 52-Week High | $224.2544 |
| % from 52W High | -68.09% |
| 52-Week Low | $60.4147 |
| % from 52W Low | +18.46% |
| YTD High | $148.2160 |
| % from YTD High | -51.71% |
| YTD Low | $60.4147 |
| % from YTD Low | +18.46% |
📊 Market Commentary
Solana (SOL) is currently trading at $71.57, down 0.50% today, as the broader crypto market shows mixed sentiment. The Relative Strength Index (RSI) at 55.1 indicates neutral momentum, neither overbought nor oversold, suggesting a balanced market with no immediate directional bias. SOL remains within its 52-week range of $60.41 to $224.25, reflecting significant volatility over the past year, though recent price action has been relatively subdued compared to earlier highs.
Market sentiment for Solana appears cautiously optimistic, supported by steady network activity and developer engagement. Traders are closely watching the $70 level as near-term support, with a break below potentially testing the lower bound of the 52-week range near $60. On the upside, resistance around $75–$80 could cap gains unless buying pressure intensifies. The $80 level, in particular, has acted as a psychological barrier in recent weeks.
Key factors influencing SOL’s price include broader crypto market trends, Bitcoin’s performance, and network-specific developments such as adoption in decentralized applications (dApps) and NFT activity. Solana’s relatively low transaction fees and high throughput continue to attract users, but competition from other Layer 1 chains remains a consideration. Traders are also monitoring trading volumes, which have been modest, indicating a lack of strong conviction in either direction. For now, SOL appears to be consolidating, with market participants awaiting clearer signals before committing to larger positions.
Disclaimer
The content on MarketsFN.com is provided for educational and informational purposes only. It does not constitute financial advice or investment recommendations. All investments involve risk. Cryptocurrency markets are highly volatile. Past performance does not guarantee future results.