S&P 500 Bull & Bear Radar — June 08, 2026
· Stocks · QuoteReporter
S&P 500 Bull & Bear Radar — June 08, 2026
A daily technical sweep of 496 S&P 500 constituents ranked by session performance, enriched with RSI, MA20/MA50/MA200 trend signals, Bloomberg-style charts, and recent news.
Index-Wide Breadth
| Constituents tracked | 496 |
| Advancing | 173 (34.9%) |
| Declining | 322 (64.9%) |
| Average daily change | 0.30% |
| Above MA200 | 12 (2.4%) |
Top 10 Gainers
Today's strongest S&P 500 performers. Sector leadership: Technology (9), Financial (1).
| Ticker | Company | Sector | Price | Day % | 1W % | 1M % | RSI | vs MA200 | Trend |
|---|---|---|---|---|---|---|---|---|---|
| INTC | Intel Corp | Technology | $110.27 | +11.19% | +0.86% | +0.59% | 53.0 | +113.2% | Above MA50, MA200 · Below MA20 |
| MU | Micron Technology Inc | Technology | $949.28 | +9.87% | -8.33% | +46.80% | 60.8 | +160.1% | Above MA20, MA50, MA200 |
| KLAC | KLA Corp | Technology | $2108.06 | +9.27% | +8.66% | +19.56% | 61.5 | +52.4% | Above MA20, MA50, MA200 |
| AMAT | Applied Materials Inc | Technology | $492.17 | +8.64% | +7.42% | +19.85% | 62.7 | +63.0% | Above MA20, MA50, MA200 |
| LRCX | Lam Research Corp | Technology | $324.45 | +6.98% | +2.31% | +13.24% | 58.5 | +62.5% | Above MA20, MA50, MA200 |
| COIN | Coinbase Global Inc | Financial | $162.11 | +6.37% | -11.23% | -15.99% | 39.4 | -33.5% | Below MA20, MA50, MA200 |
| FICO | Fair Isaac Corp | Technology | $1207.34 | +6.16% | -6.03% | +7.00% | 54.3 | -16.2% | Above MA20, MA50 · Below MA200 |
| SMCI | Super Micro Computer Inc | Technology | $43.99 | +5.64% | -6.16% | +30.84% | 61.9 | +22.1% | Above MA20, MA50, MA200 |
| GLW | Corning, Inc | Technology | $187.54 | +5.61% | +6.13% | +2.82% | 51.8 | +61.5% | Above MA50, MA200 · Below MA20 |
| MPWR | Monolithic Power System Inc | Technology | $1559.18 | +5.28% | +1.09% | -1.06% | 50.0 | +39.6% | Above MA50, MA200 · Below MA20 |
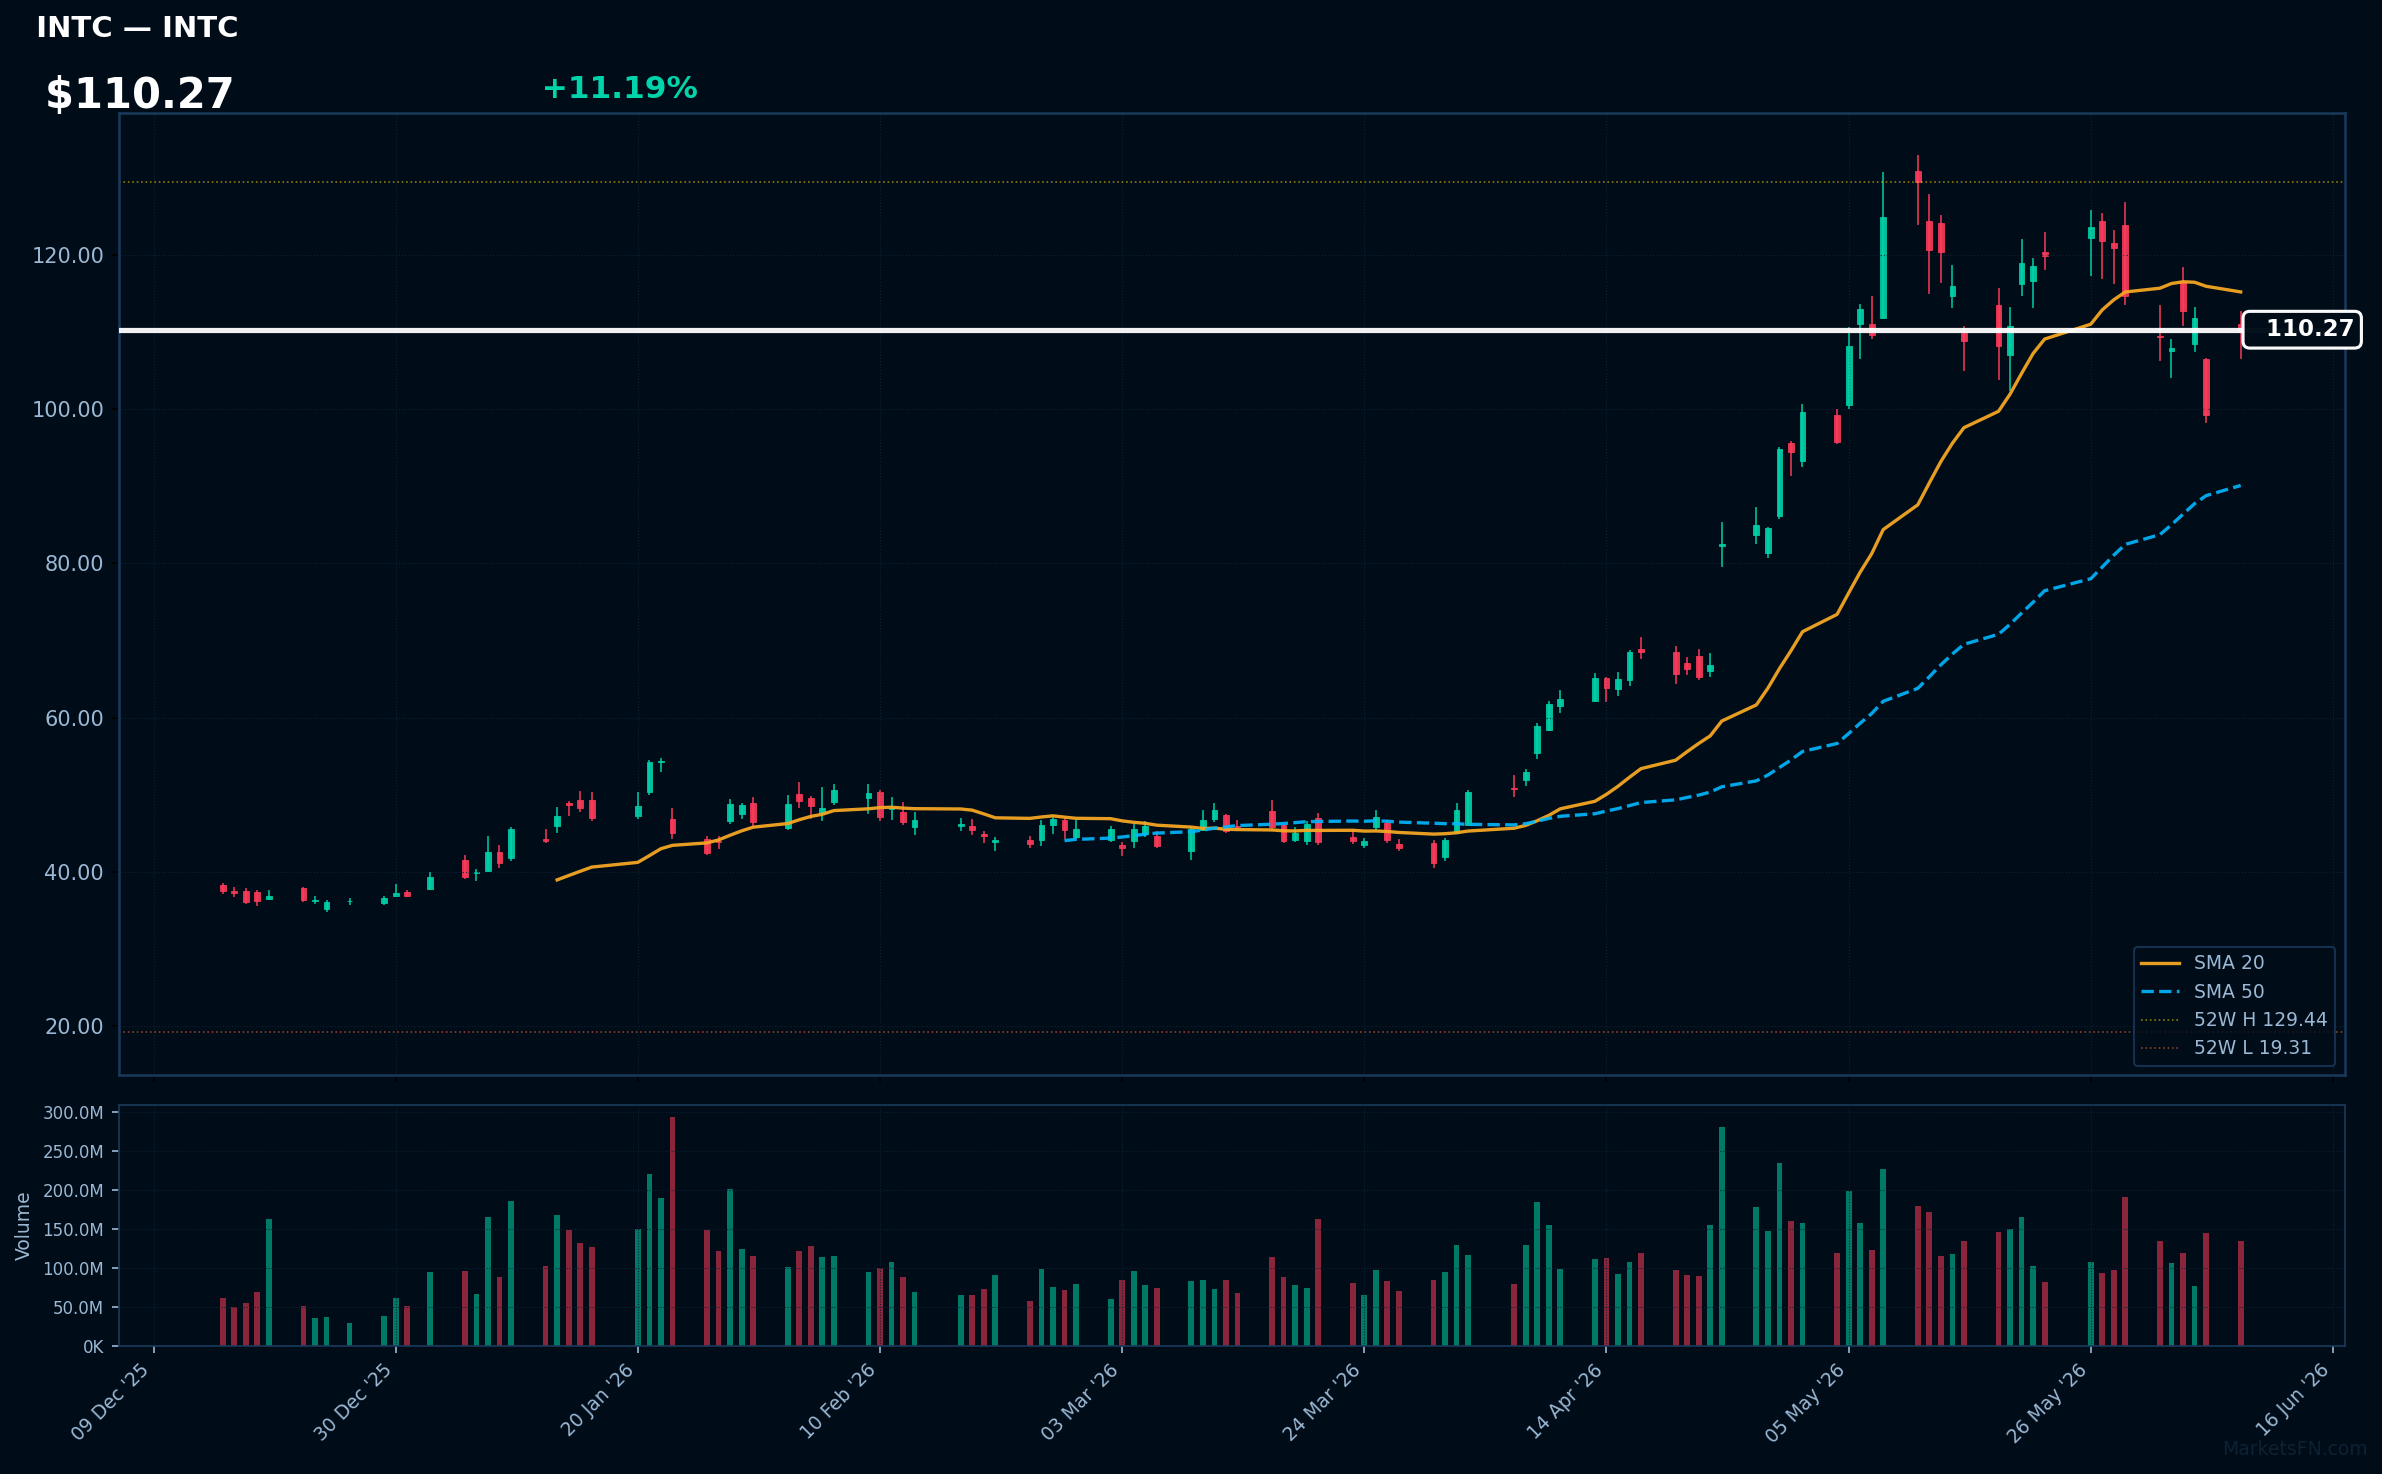
INTC | Intel Corp | Technology | Price: $110.27 | Day: +11.19% | 1W: +0.86% | 1M: +0.59% | RSI: 53.0 | vs MA200: +113.2% | Trend: Above MA50, MA200 · Below MA20
Recent headlines (last 12h)
- S&P 500, Nasdaq rise as tech, chipmakers rebound
- Google Orders 3 Million TPUs From Intel
- Intel Leads Chip Rally on AI Foundry Hopes
- Intel Jumps After Reports of Breakthrough Foundry Deals with Google and Nvidia
MU | Micron Technology Inc | Technology | Price: $949.28 | Day: +9.87% | 1W: -8.33% | 1M: +46.80% | RSI: 60.8 | vs MA200: +160.1% | Trend: Above MA20, MA50, MA200
Recent headlines (last 12h)
- Inflation could top 4% this week. The bond market wants Fed Chair Warsh to prove he'll fight it.
- AI Demand Lifts Memory and Storage Stocks
- Why history is sounding a siren on the tech stock rout
- Your next videogame console could cost $1,000 - and it has nothing to do with better hardware
KLAC | KLA Corp | Technology | Price: $2108.06 | Day: +9.27% | 1W: +8.66% | 1M: +19.56% | RSI: 61.5 | vs MA200: +52.4% | Trend: Above MA20, MA50, MA200
Recent headlines (last 12h)
- KLA Corp. stock outperforms competitors on strong trading day
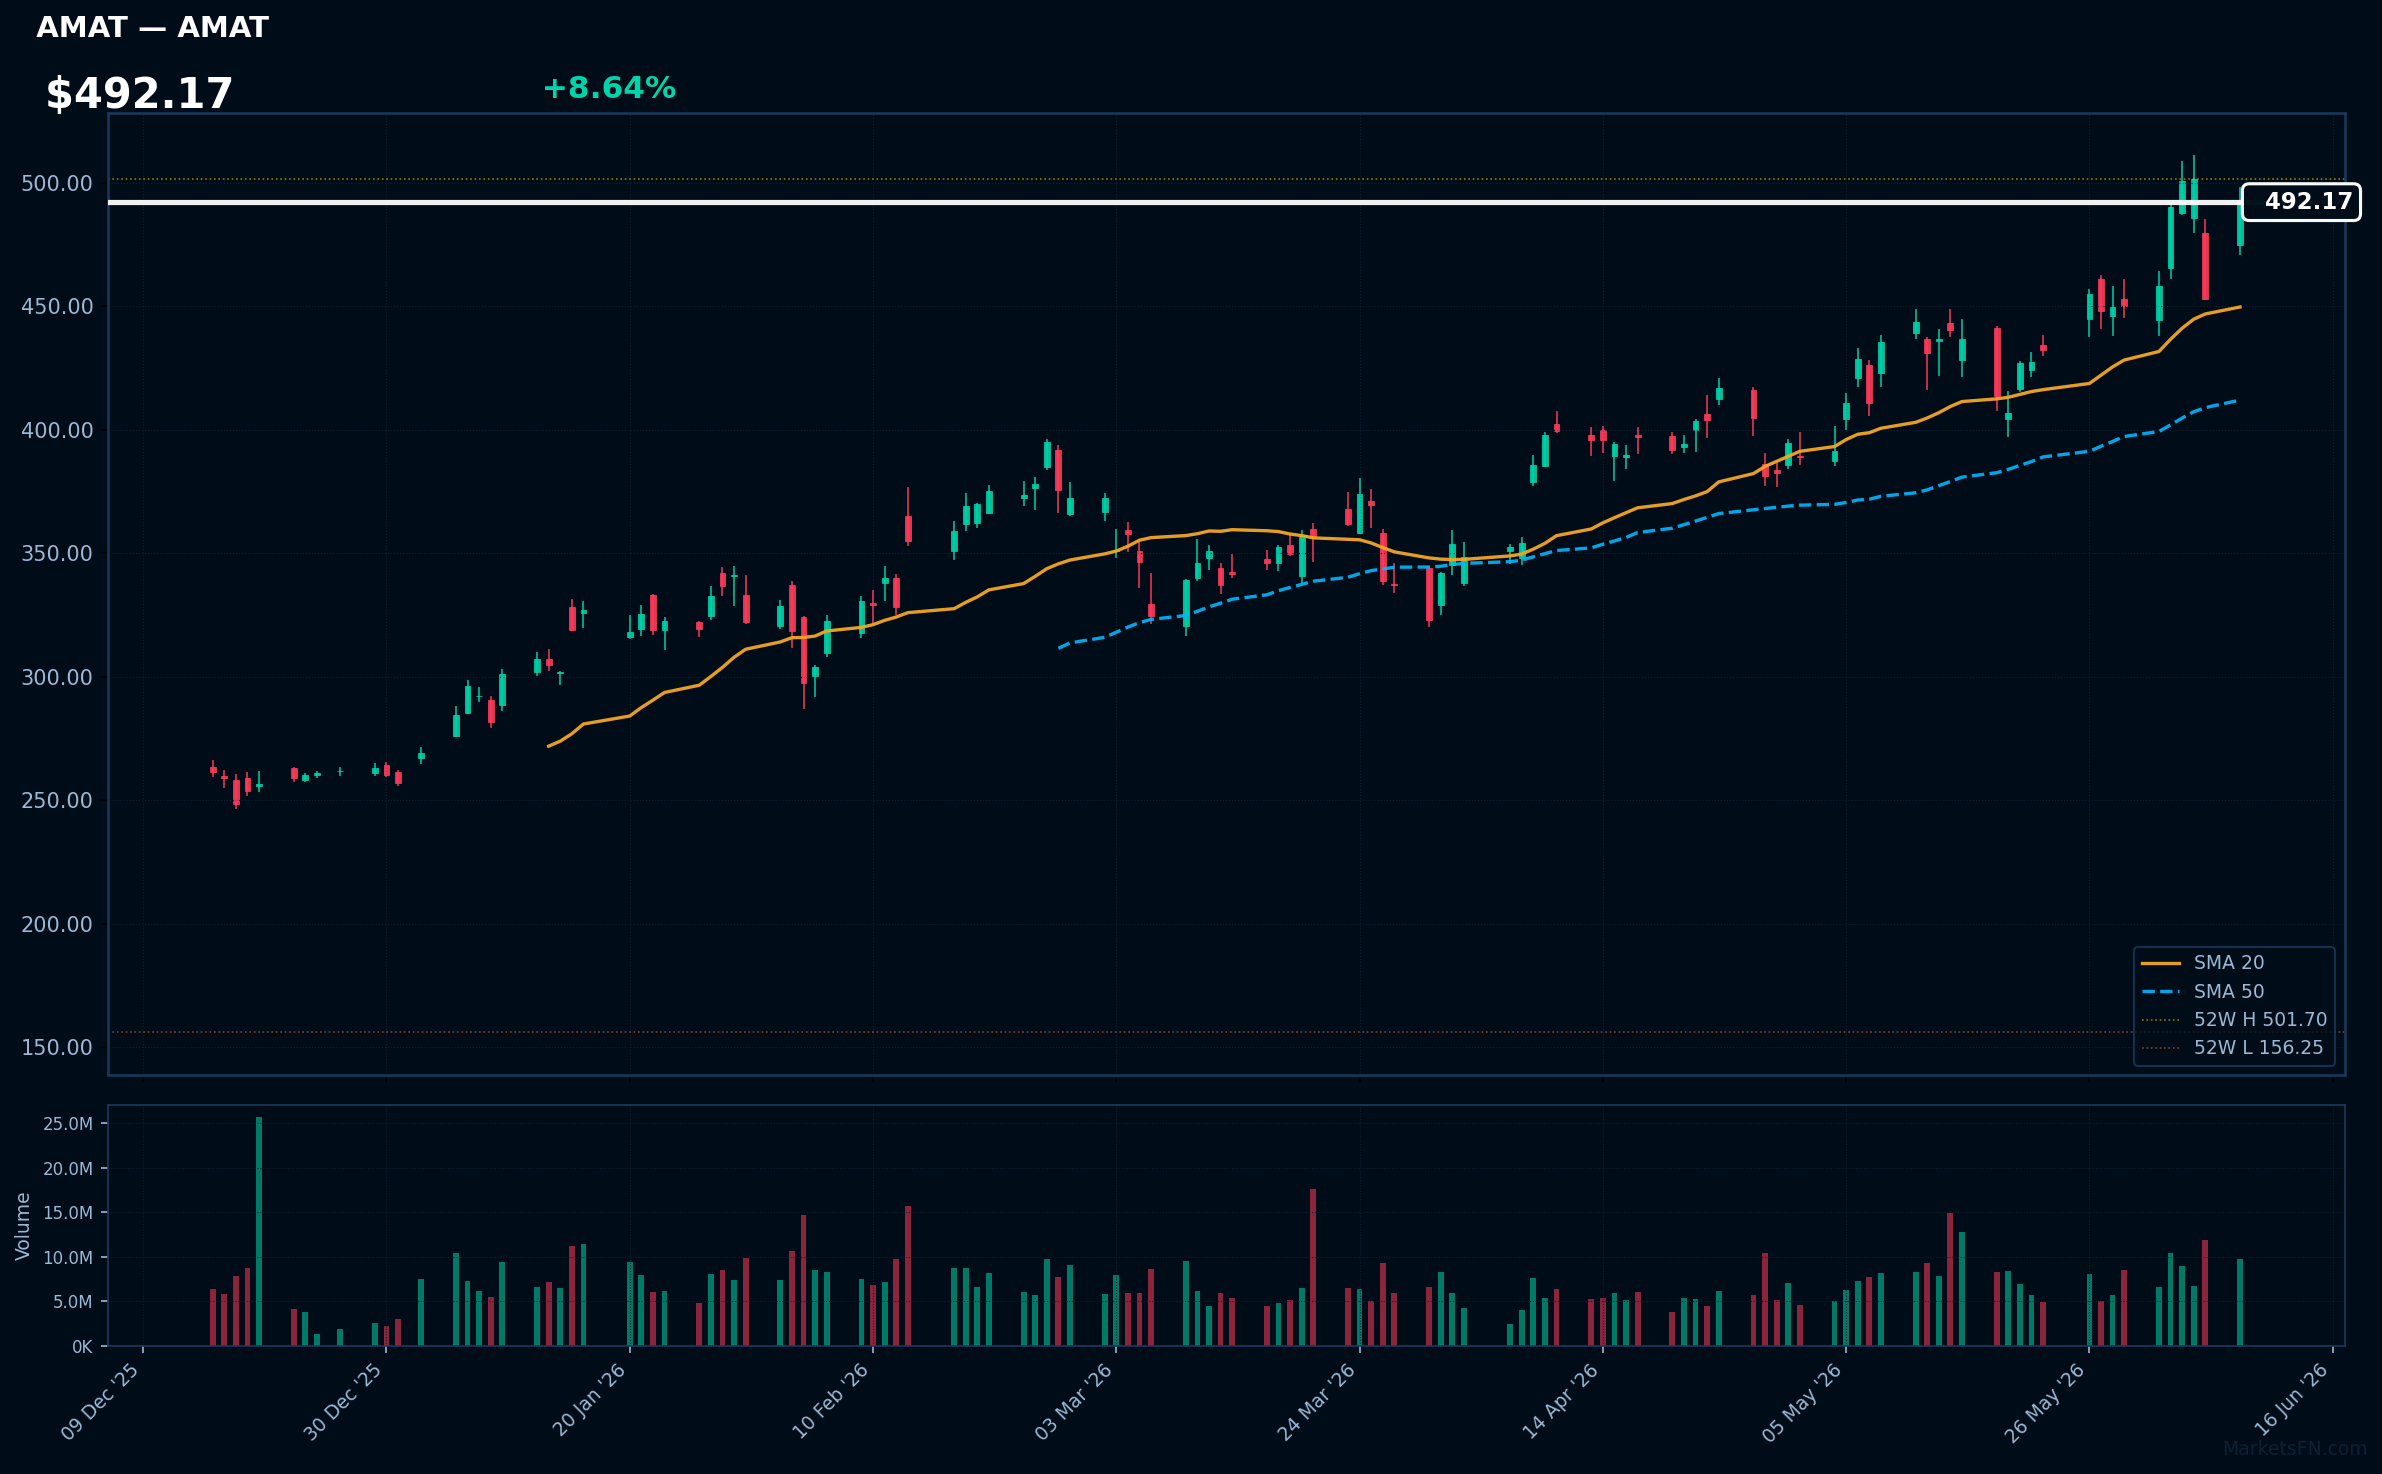
AMAT | Applied Materials Inc | Technology | Price: $492.17 | Day: +8.64% | 1W: +7.42% | 1M: +19.85% | RSI: 62.7 | vs MA200: +63.0% | Trend: Above MA20, MA50, MA200
Recent headlines (last 12h)
- Applied Materials Inc. stock outperforms competitors on strong trading day
- PhysicsX Raises $300 Million At $2.4 Billion Valuation
- 3 chip stocks to buy after recent SOX pullback: Citi
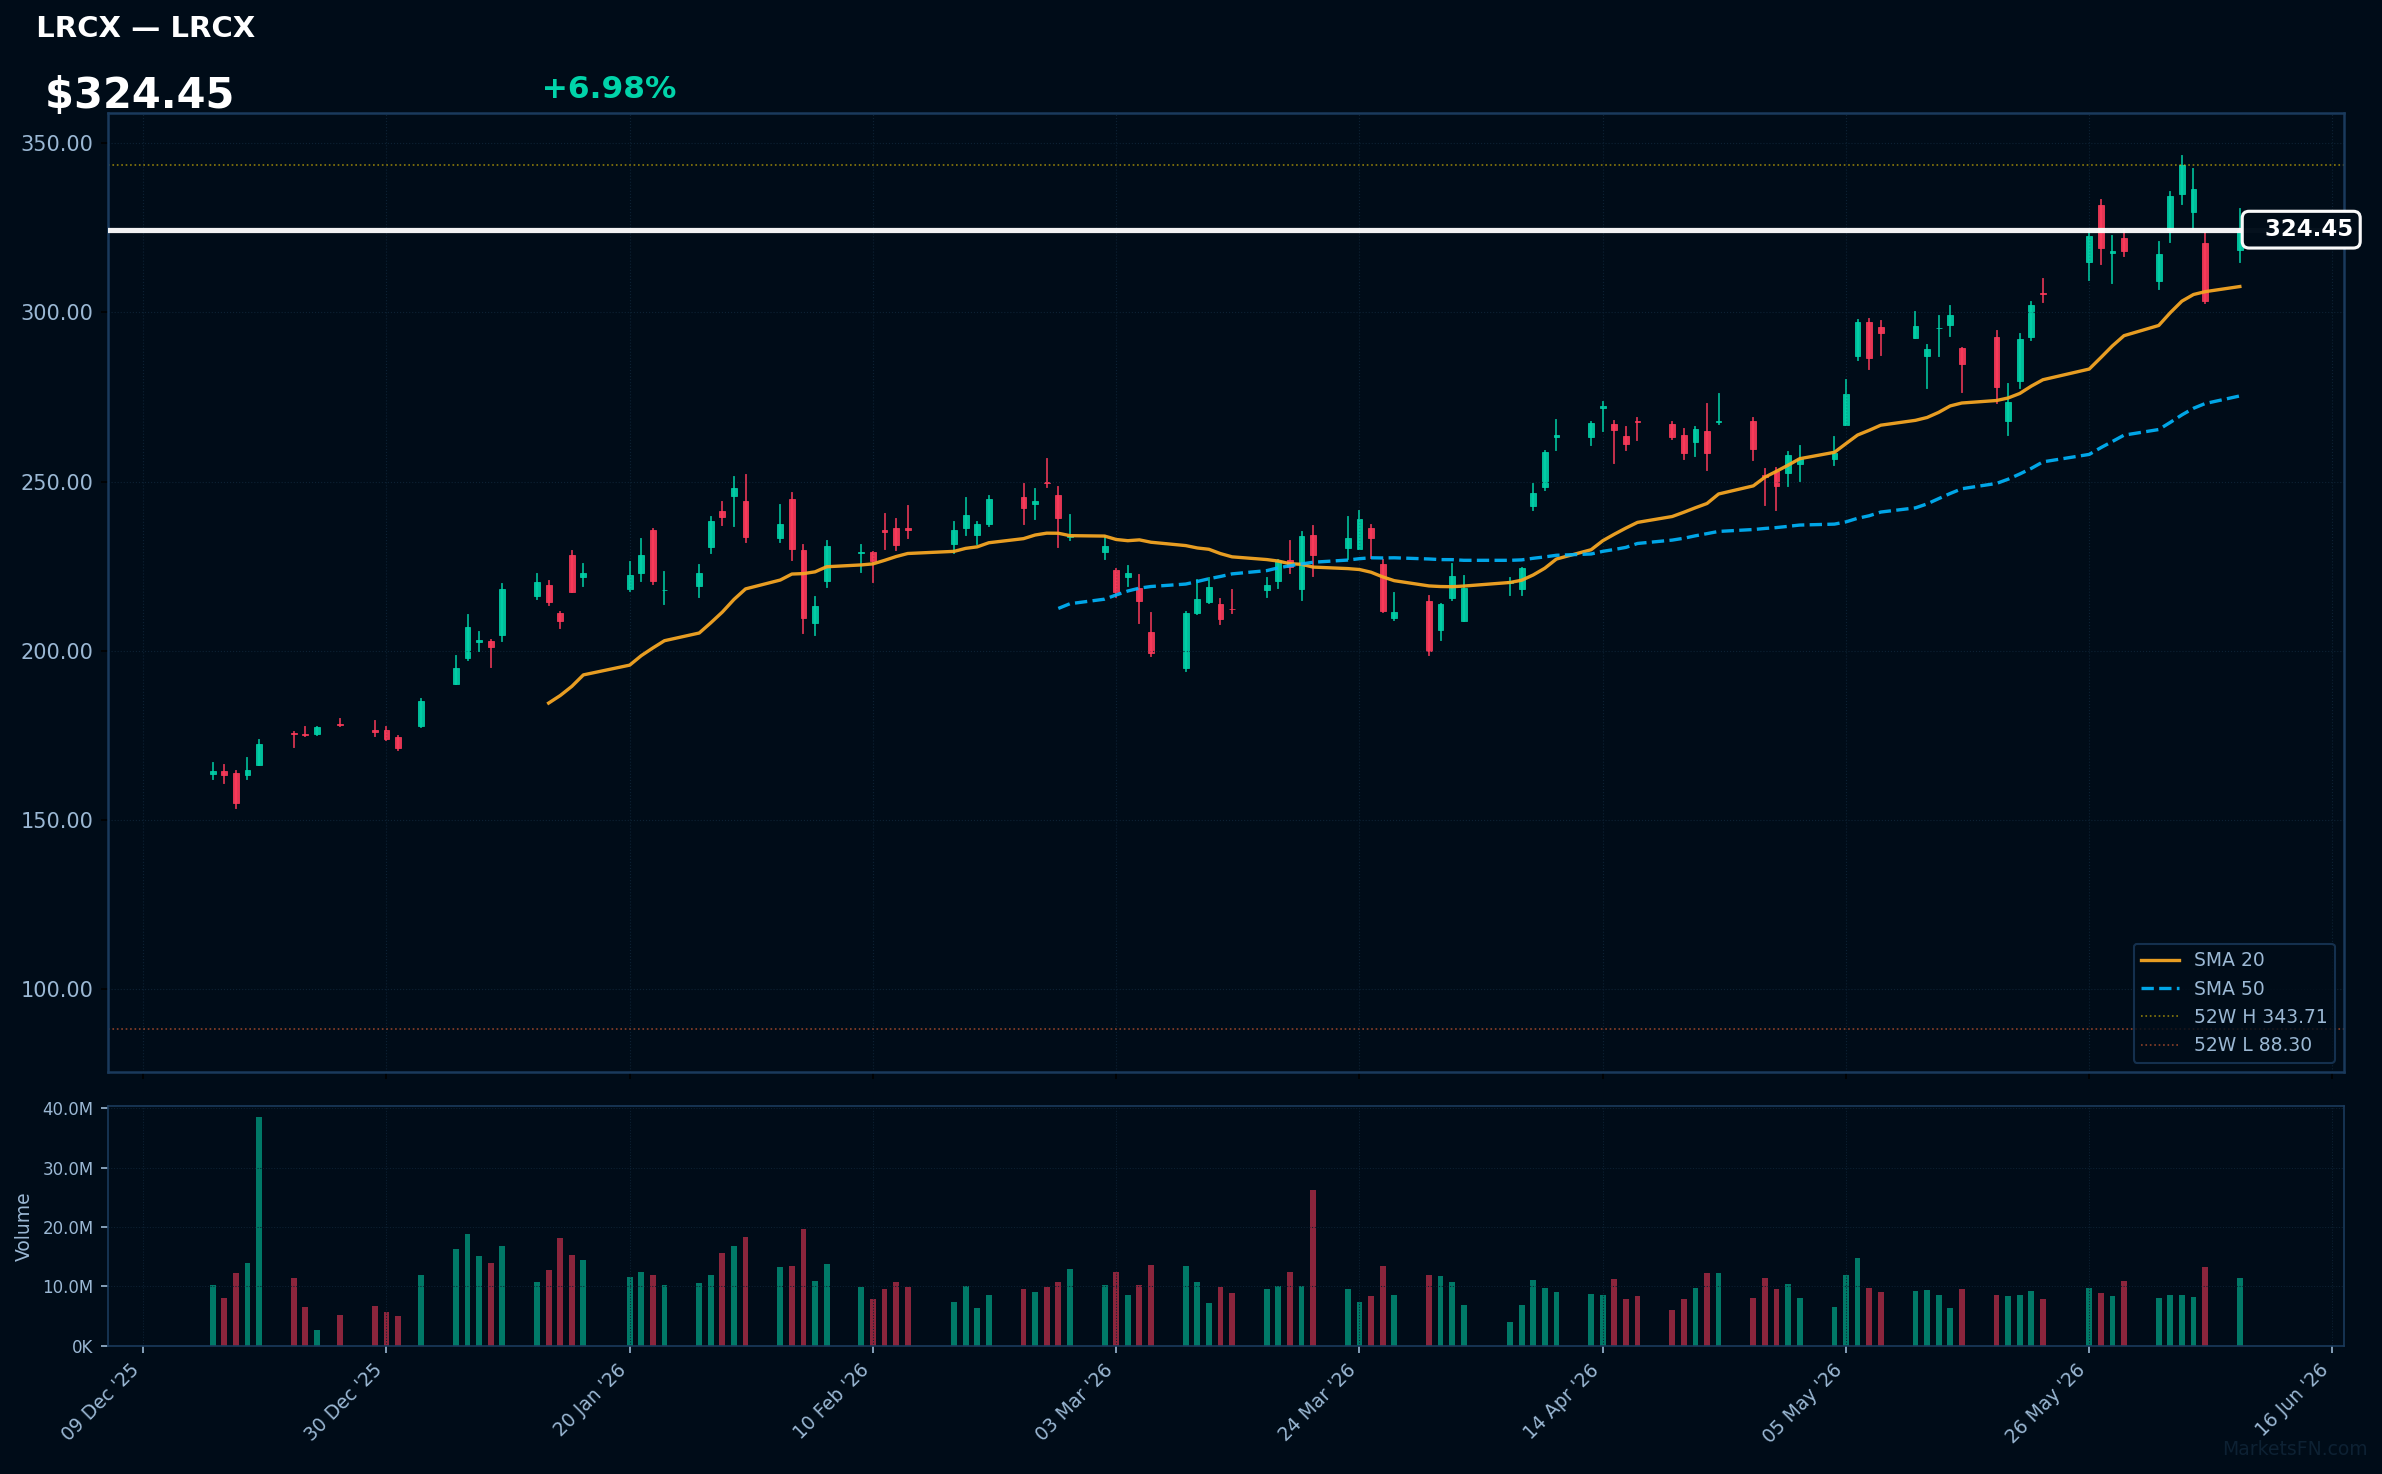
LRCX | Lam Research Corp | Technology | Price: $324.45 | Day: +6.98% | 1W: +2.31% | 1M: +13.24% | RSI: 58.5 | vs MA200: +62.5% | Trend: Above MA20, MA50, MA200
Recent headlines (last 12h)
- Lam Research Corp. stock outperforms competitors on strong trading day
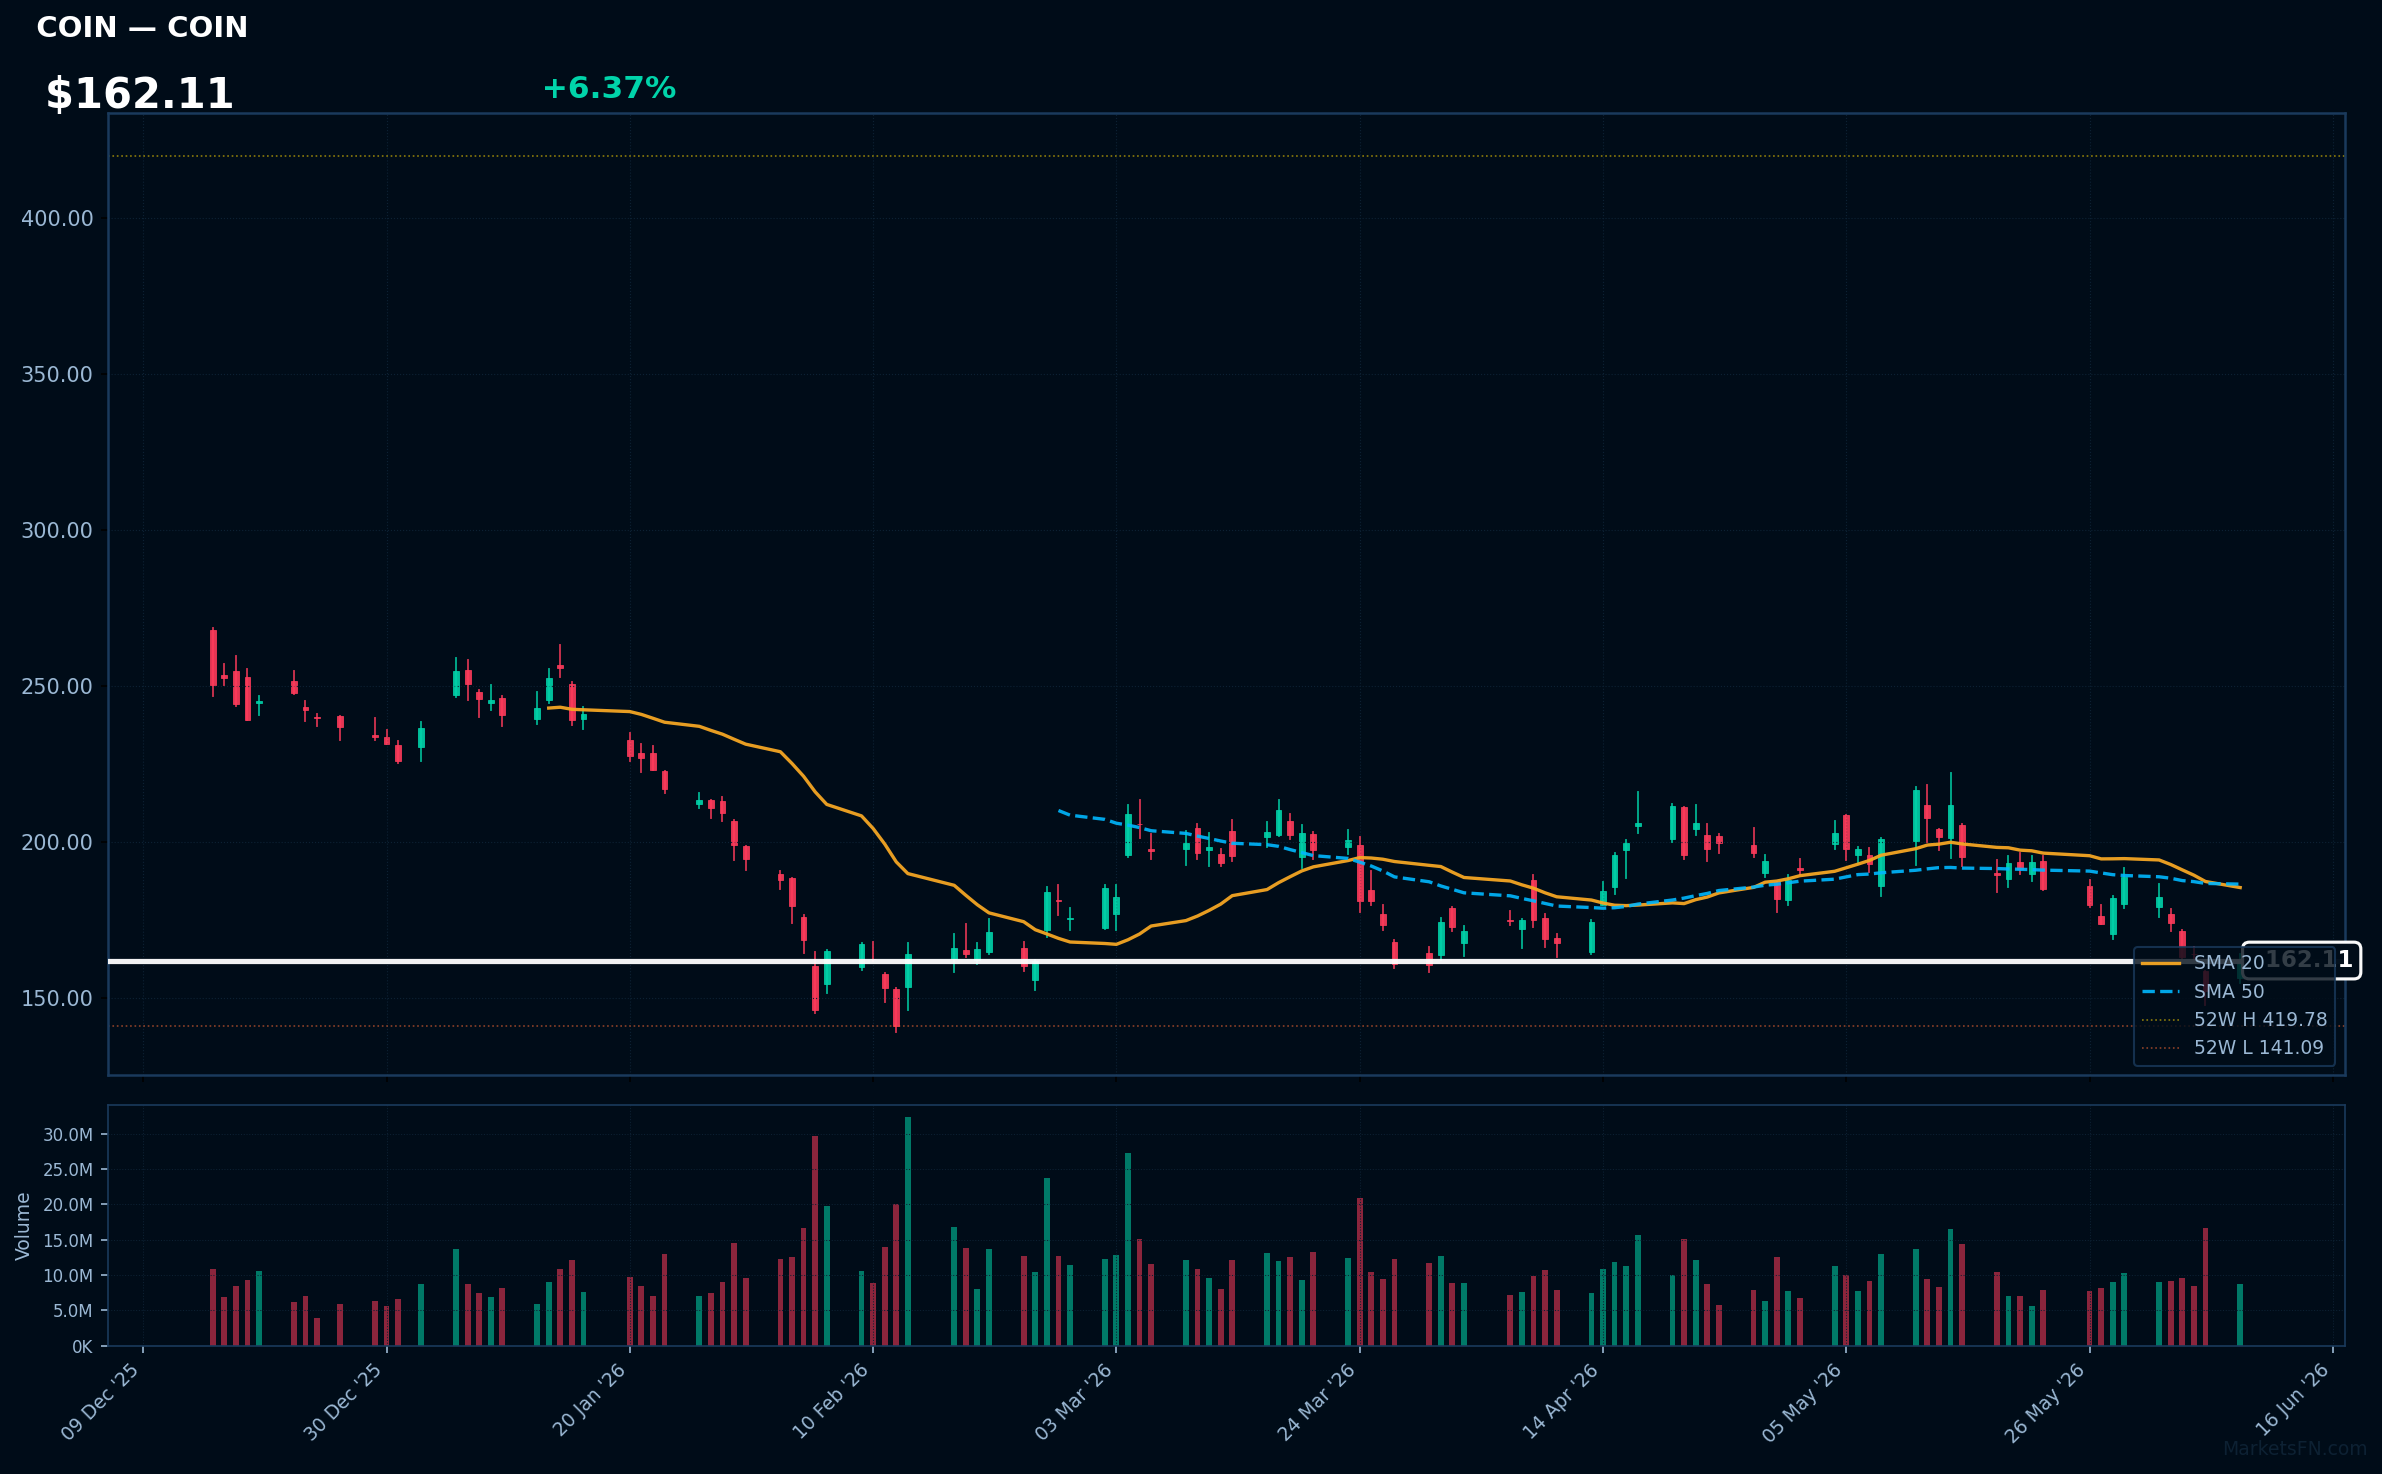
COIN | Coinbase Global Inc | Financial | Price: $162.11 | Day: +6.37% | 1W: -11.23% | 1M: -15.99% | RSI: 39.4 | vs MA200: -33.5% | Trend: Below MA20, MA50, MA200
Recent headlines (last 12h)
- Winning Government Business: HighGround Market Founder & CEO John Price, Live at NYSE
- Strategy Buys $101 Million Worth of Bitcoin. It's a Good Sign for Crypto.
FICO | Fair Isaac Corp | Technology | Price: $1207.34 | Day: +6.16% | 1W: -6.03% | 1M: +7.00% | RSI: 54.3 | vs MA200: -16.2% | Trend: Above MA20, MA50 · Below MA200
Recent headlines (last 12h)
- Fair Isaac Corp. stock outperforms competitors on strong trading day
- FICO Announces New Stock Repurchase Authorization, New Term Loan and Accelerated Share Repurchase Program
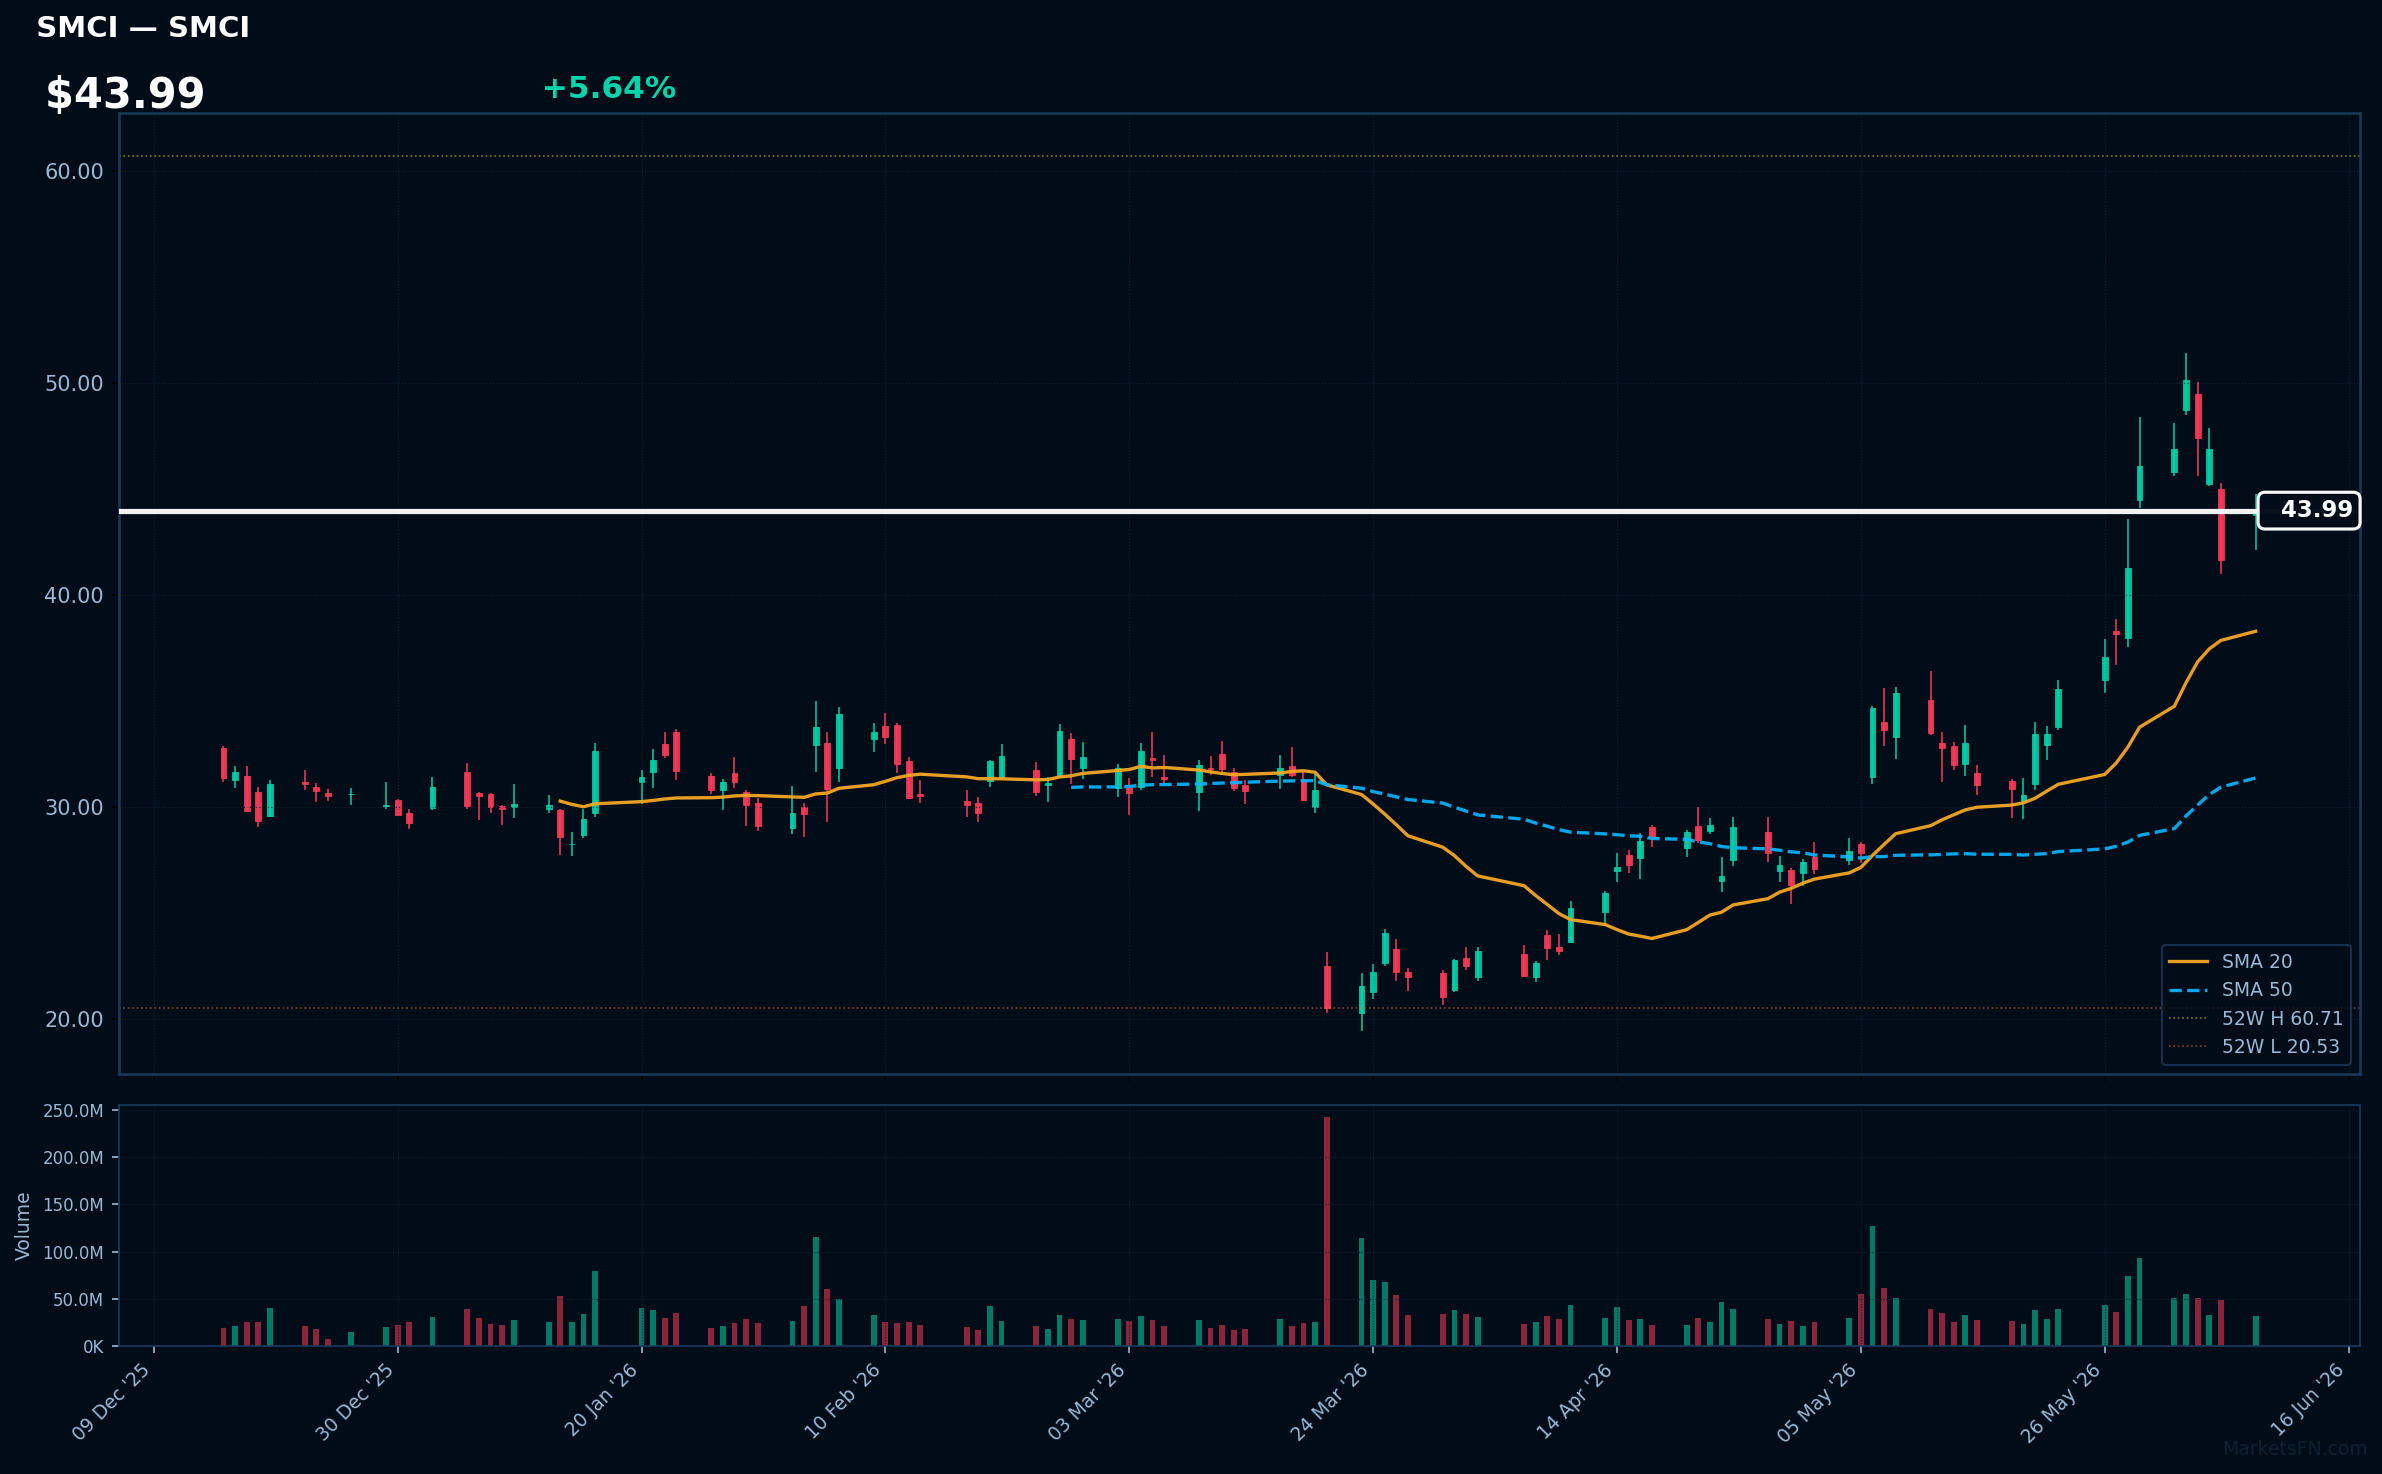
SMCI | Super Micro Computer Inc | Technology | Price: $43.99 | Day: +5.64% | 1W: -6.16% | 1M: +30.84% | RSI: 61.9 | vs MA200: +22.1% | Trend: Above MA20, MA50, MA200
Recent headlines (last 12h)
- Super Micro Computer Inc. stock outperforms competitors on strong trading day
- Broadcom, AMD, Super Micro, and More Stocks That Explain Today's Market
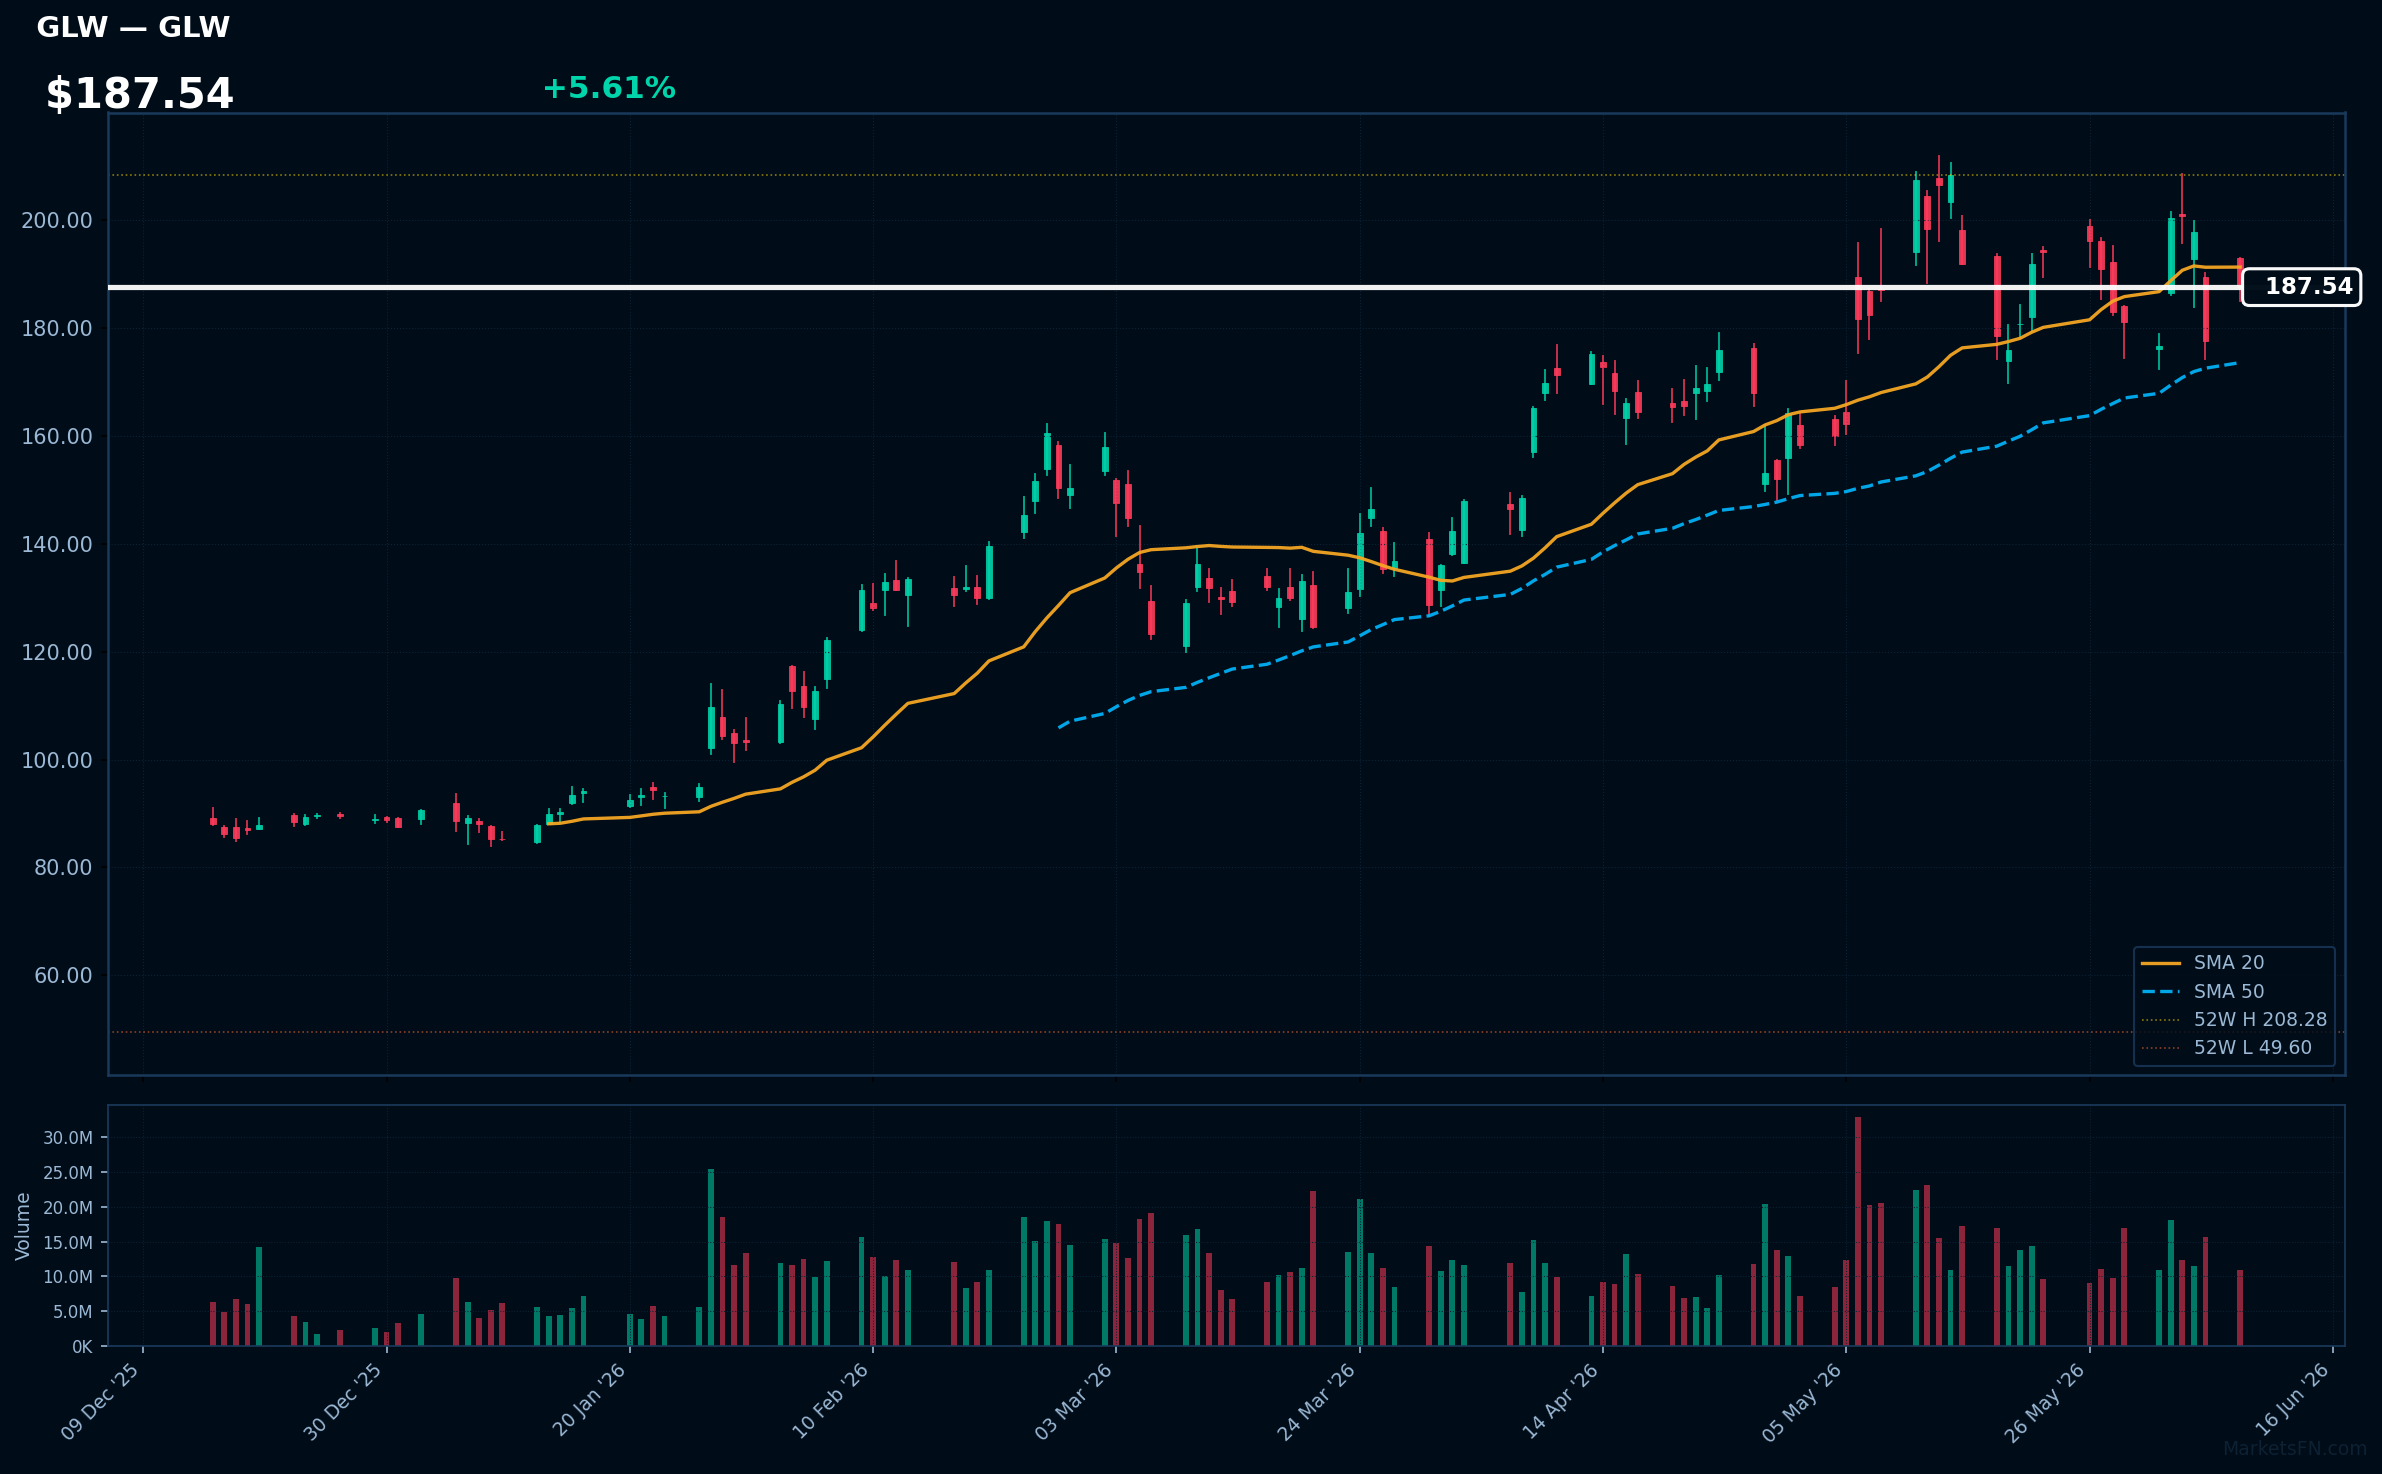
GLW | Corning, Inc | Technology | Price: $187.54 | Day: +5.61% | 1W: +6.13% | 1M: +2.82% | RSI: 51.8 | vs MA200: +61.5% | Trend: Above MA50, MA200 · Below MA20
Recent headlines (last 12h)
- Corning Inc. stock outperforms competitors on strong trading day
- Corning Lands Multibillion-Dollar Amazon Deal as Data Center Fiber Demand Surges
- Corning Jumps 9.5% As Amazon Signs Multibillion-Dollar Fiber Deal
- Corning Stock Soars After Company Signs Another Deal With a Magnificent 7 Member
MPWR | Monolithic Power System Inc | Technology | Price: $1559.18 | Day: +5.28% | 1W: +1.09% | 1M: -1.06% | RSI: 50.0 | vs MA200: +39.6% | Trend: Above MA50, MA200 · Below MA20
Recent headlines (last 12h)
- Monolithic Power Systems Inc. stock outperforms competitors on strong trading day
Top 10 Losers
Today's weakest S&P 500 performers. Sector drag: Basic Materials (3), Technology (3), Utilities (1), Healthcare (1), Real Estate (1), Consumer Defensive (1).
| Ticker | Company | Sector | Price | Day % | 1W % | 1M % | RSI | vs MA200 | Trend |
|---|---|---|---|---|---|---|---|---|---|
| PCG | PG&E Corp | Utilities | $16.48 | -3.68% | +2.04% | +1.79% | 48.1 | +0.7% | Above MA200 · Below MA20, MA50 |
| REGN | Regeneron Pharmaceuticals, Inc | Healthcare | $611.34 | -3.79% | +1.78% | -13.79% | 34.6 | -12.2% | Below MA20, MA50, MA200 |
| MLM | Martin Marietta Materials, Inc | Basic Materials | $553.98 | -3.79% | -2.97% | -7.75% | 39.8 | -10.5% | Below MA20, MA50, MA200 |
| SBAC | SBA Communications Corp | Real Estate | $200.10 | -3.81% | -1.94% | -8.47% | 44.0 | +1.7% | Above MA200 · Below MA20, MA50 |
| MOS | Mosaic Company | Basic Materials | $21.38 | -3.87% | -8.36% | -6.68% | 35.5 | -21.5% | Below MA20, MA50, MA200 |
| VRSN | Verisign Inc | Technology | $283.41 | -3.90% | -4.44% | +1.77% | 44.5 | +9.6% | Above MA50, MA200 · Below MA20 |
| VMC | Vulcan Materials Co | Basic Materials | $269.98 | -4.05% | -4.11% | -6.56% | 41.8 | -7.4% | Below MA20, MA50, MA200 |
| GDDY | Godaddy Inc | Technology | $80.70 | -4.36% | -13.22% | -10.08% | 39.2 | -27.2% | Below MA20, MA50, MA200 |
| HSY | Hershey Company | Consumer Defensive | $175.90 | -4.70% | -5.63% | -5.97% | 33.6 | -9.3% | Below MA20, MA50, MA200 |
| AKAM | Akamai Technologies Inc | Technology | $141.87 | -4.99% | -7.88% | +21.58% | 50.8 | +46.4% | Above MA50, MA200 · Below MA20 |
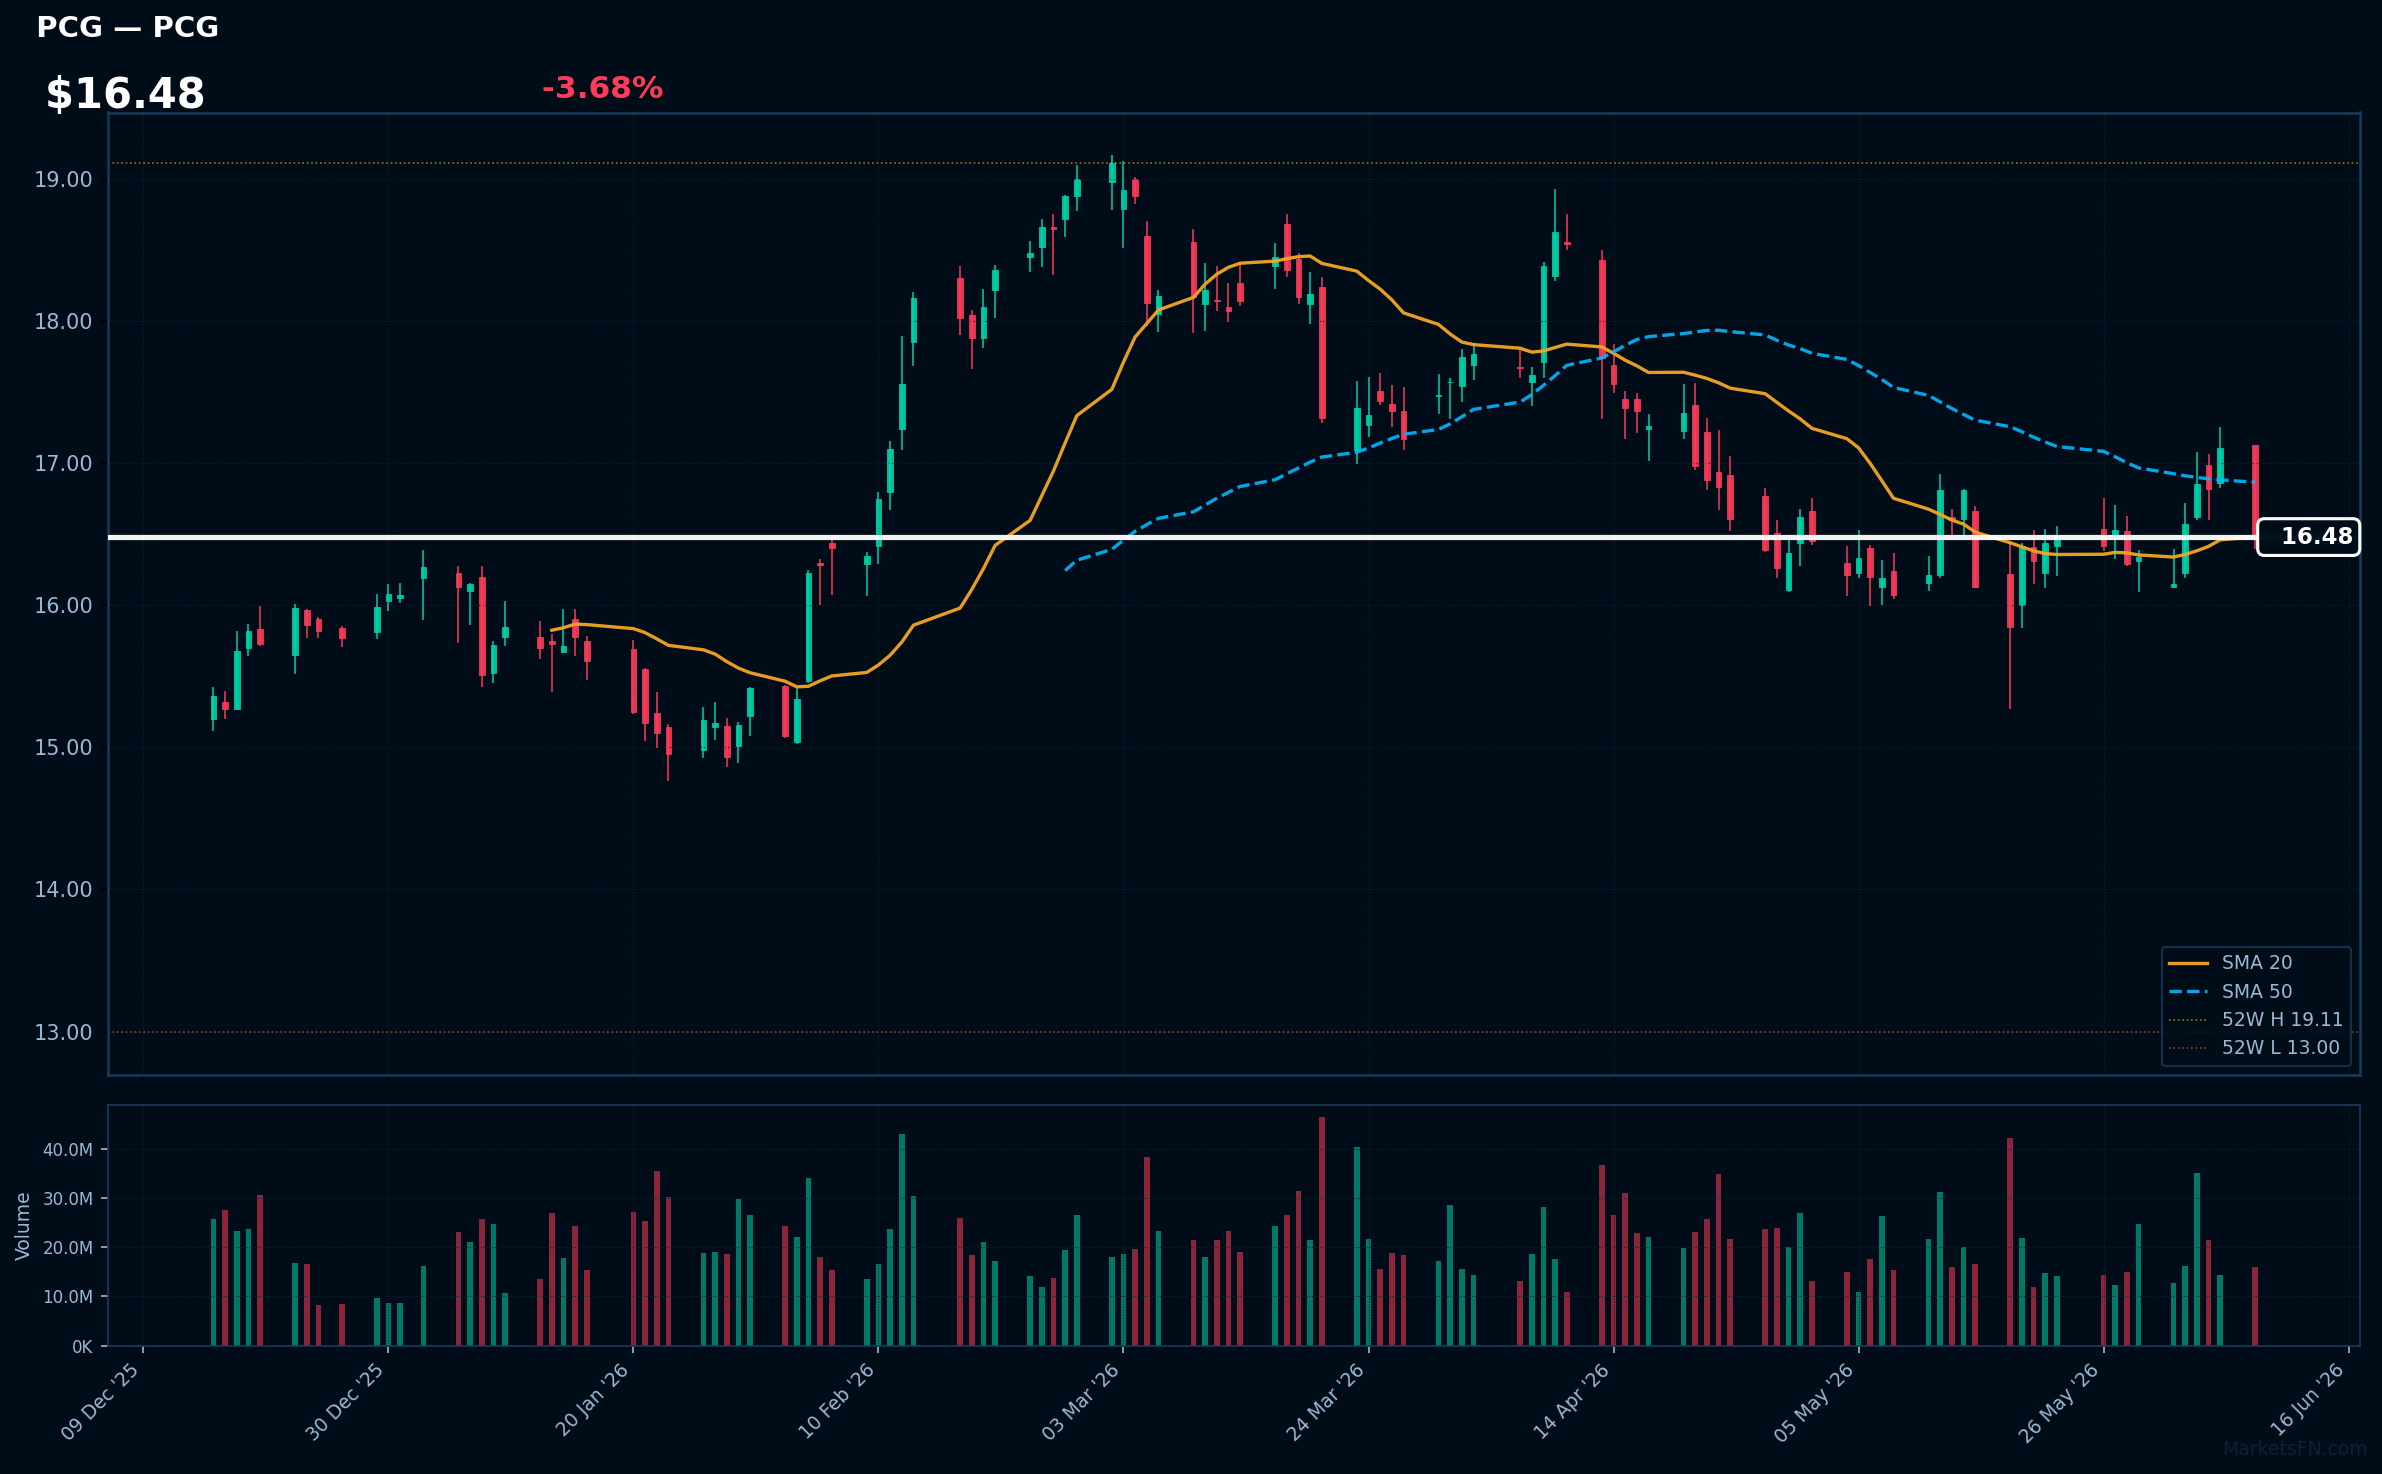
PCG | PG&E Corp | Utilities | Price: $16.48 | Day: -3.68% | 1W: +2.04% | 1M: +1.79% | RSI: 48.1 | vs MA200: +0.7% | Trend: Above MA200 · Below MA20, MA50
Recent headlines (last 12h)
- Applications Now Open for PG&E and California Fire Foundation Wildfire Preparedness Grants
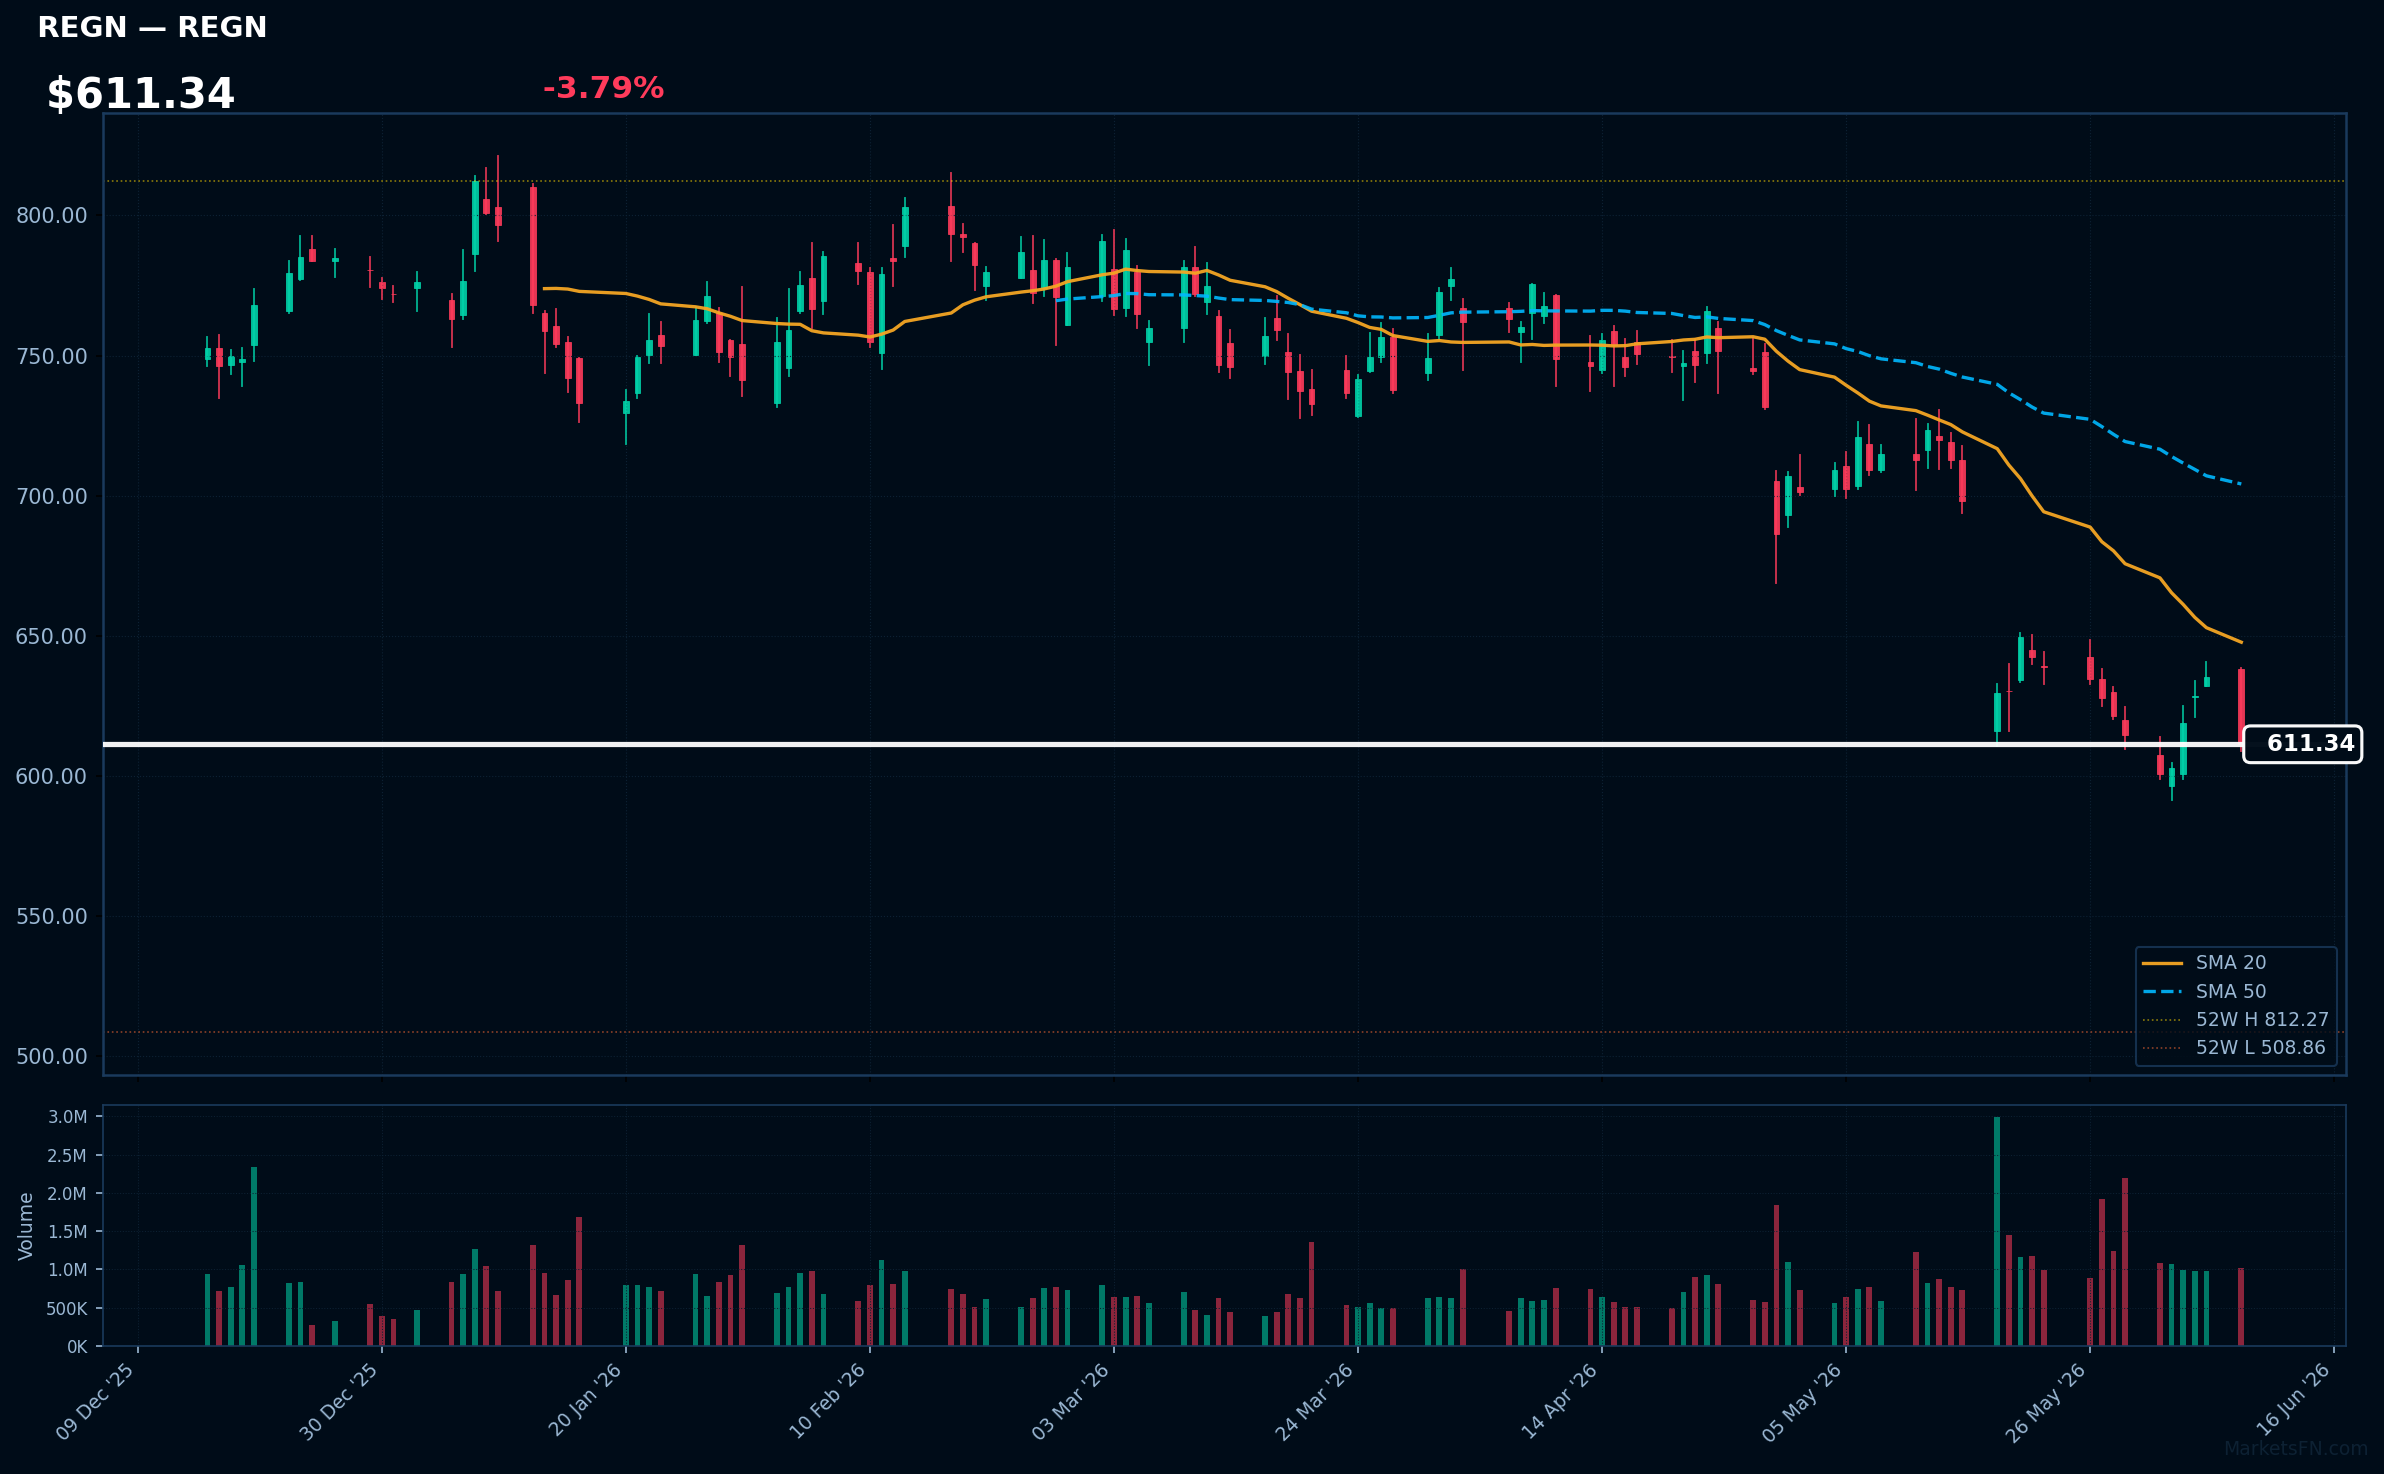
REGN | Regeneron Pharmaceuticals, Inc | Healthcare | Price: $611.34 | Day: -3.79% | 1W: +1.78% | 1M: -13.79% | RSI: 34.6 | vs MA200: -12.2% | Trend: Below MA20, MA50, MA200
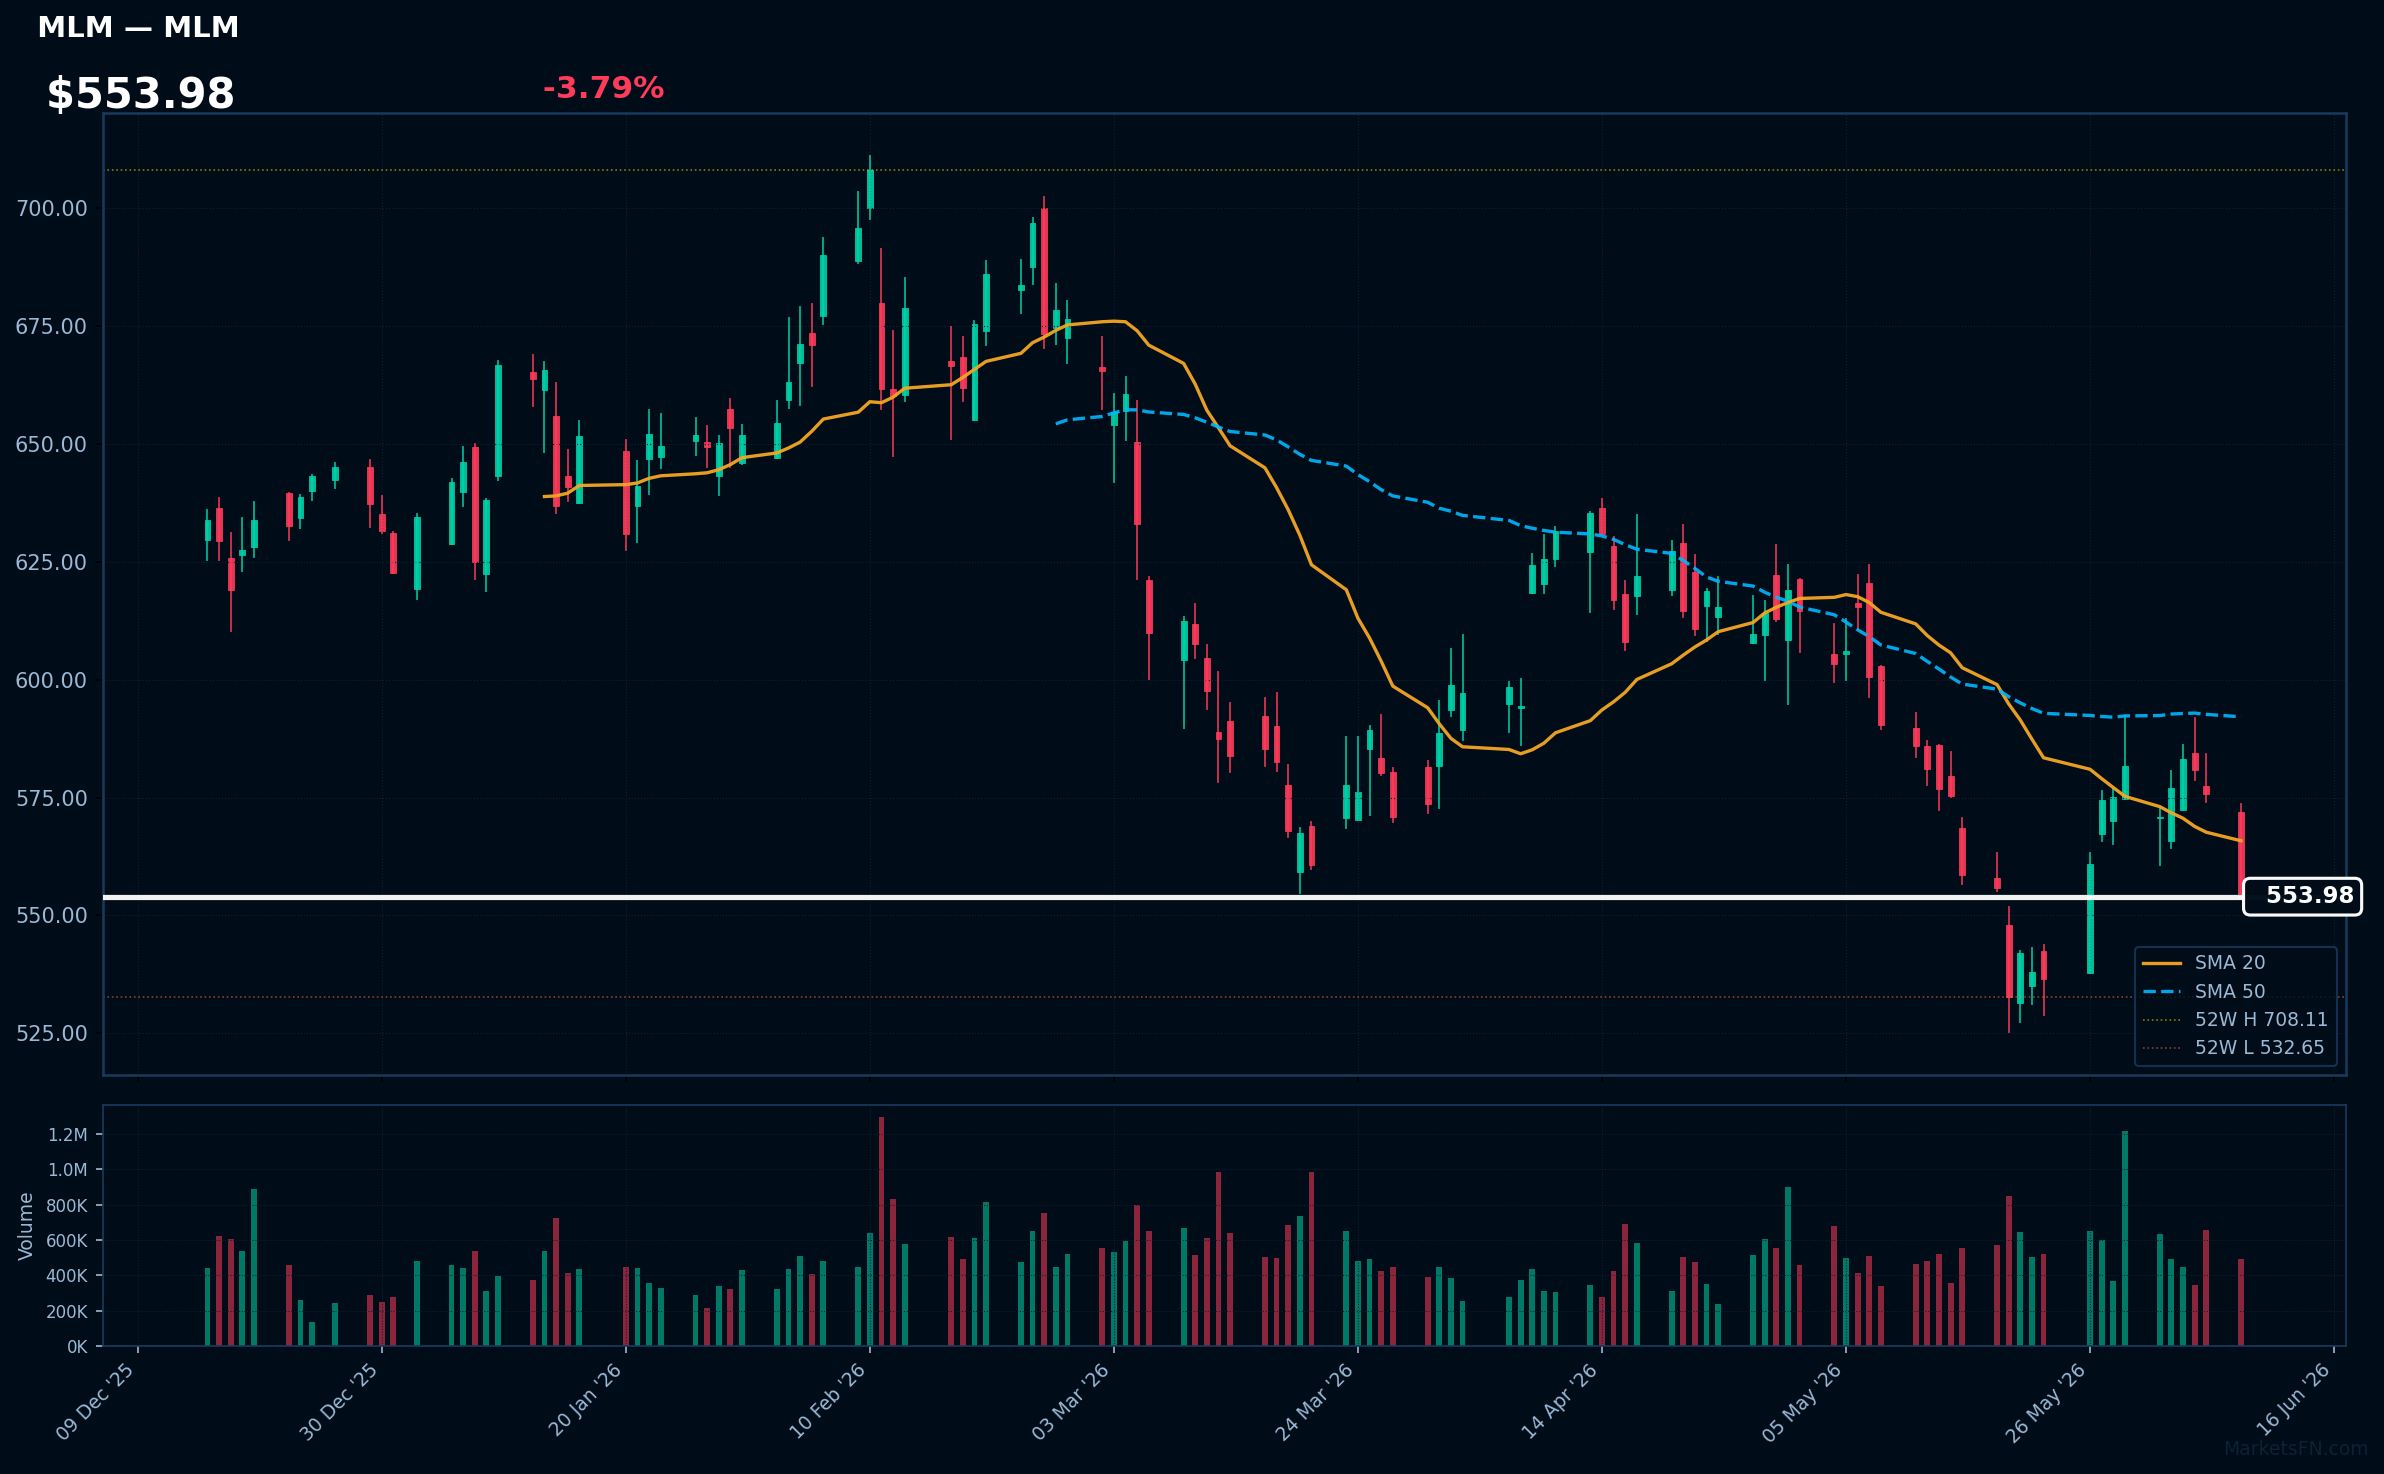
MLM | Martin Marietta Materials, Inc | Basic Materials | Price: $553.98 | Day: -3.79% | 1W: -2.97% | 1M: -7.75% | RSI: 39.8 | vs MA200: -10.5% | Trend: Below MA20, MA50, MA200
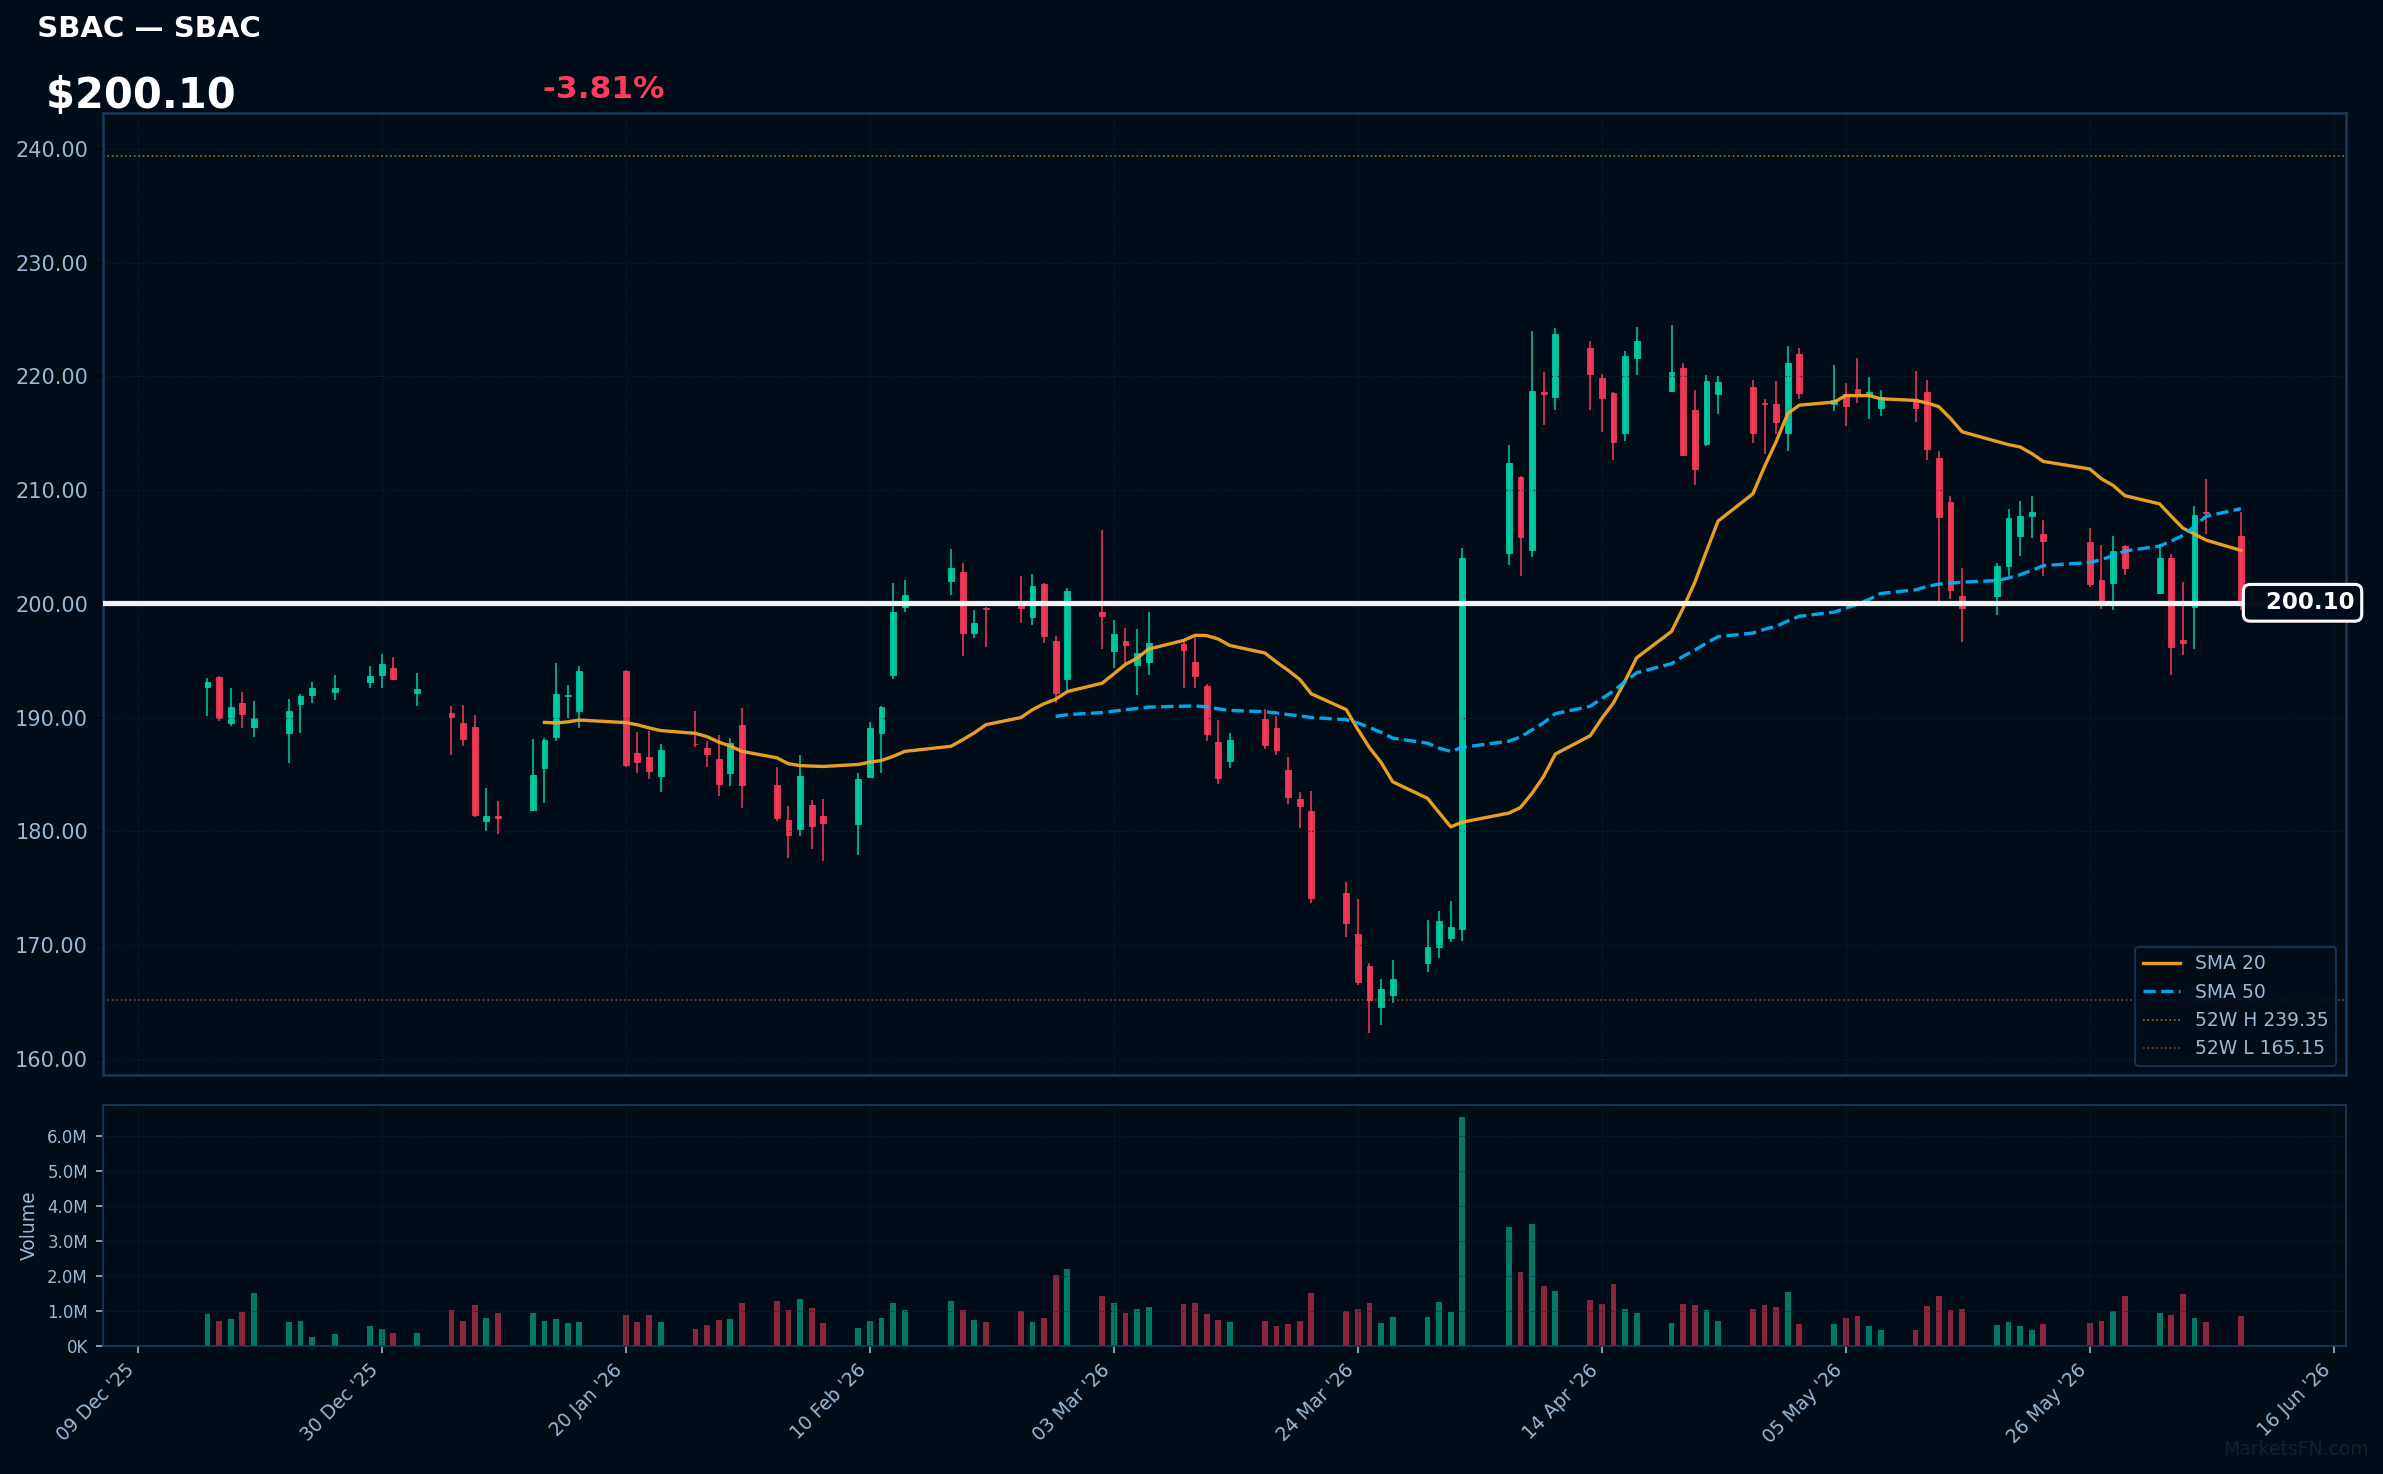
SBAC | SBA Communications Corp | Real Estate | Price: $200.10 | Day: -3.81% | 1W: -1.94% | 1M: -8.47% | RSI: 44.0 | vs MA200: +1.7% | Trend: Above MA200 · Below MA20, MA50
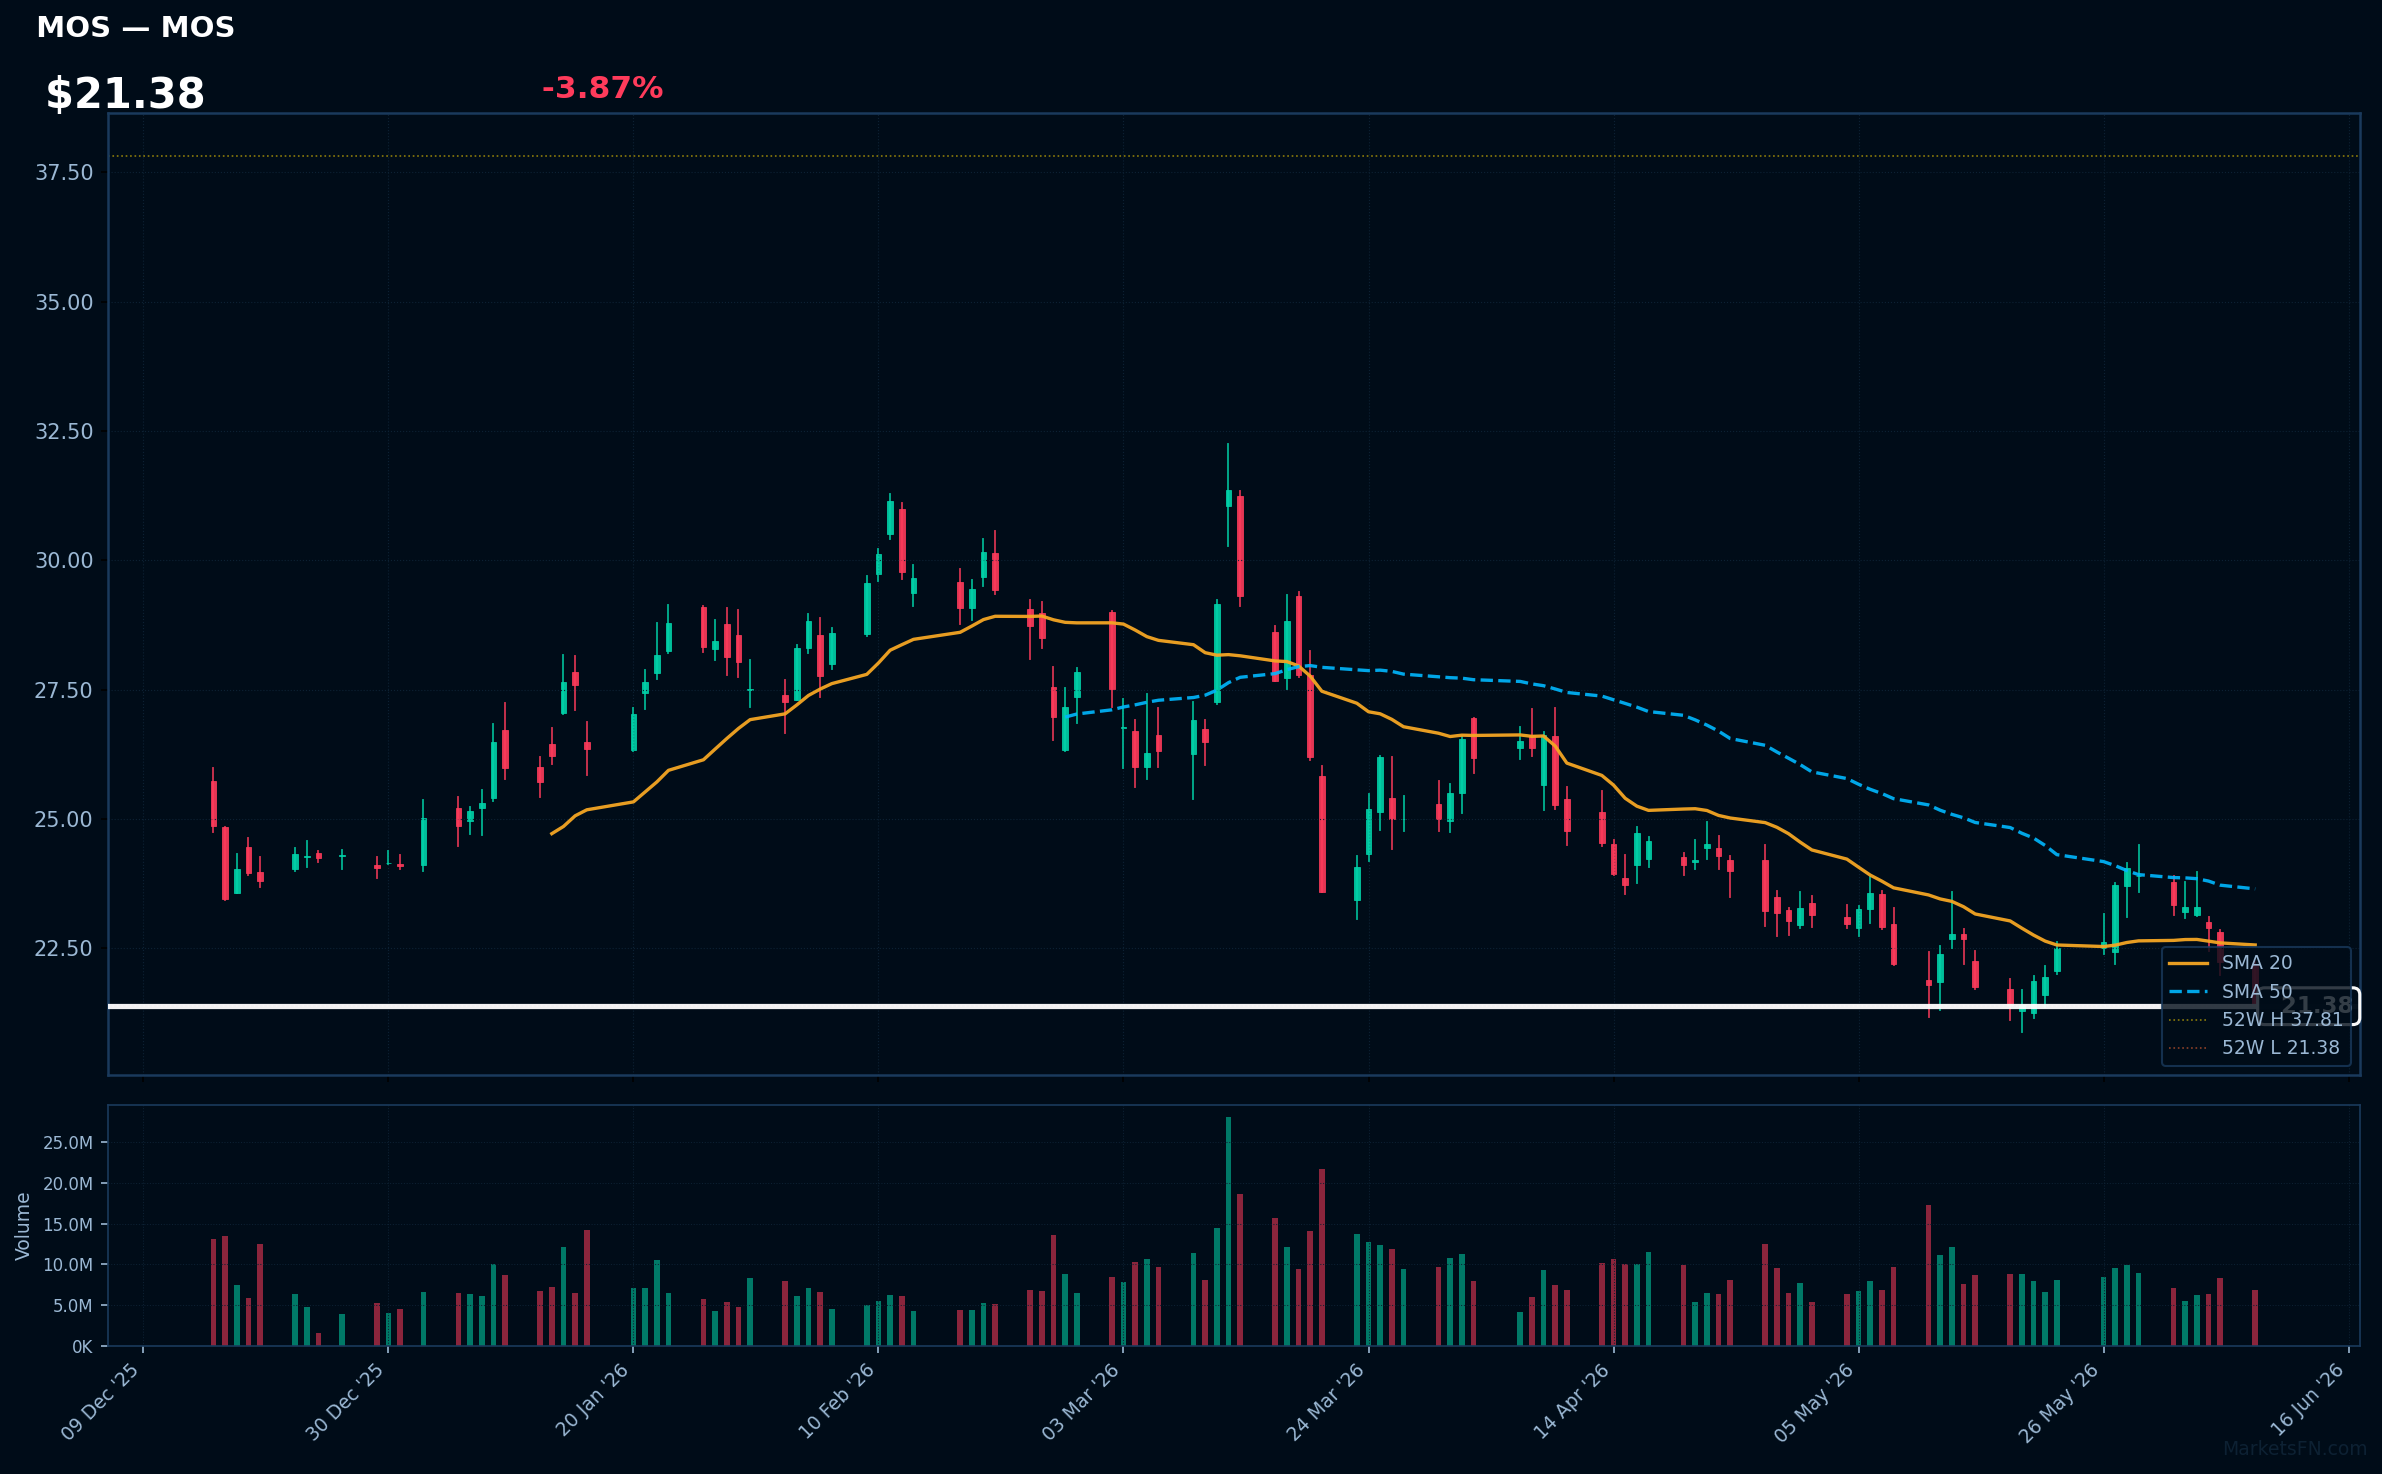
MOS | Mosaic Company | Basic Materials | Price: $21.38 | Day: -3.87% | 1W: -8.36% | 1M: -6.68% | RSI: 35.5 | vs MA200: -21.5% | Trend: Below MA20, MA50, MA200
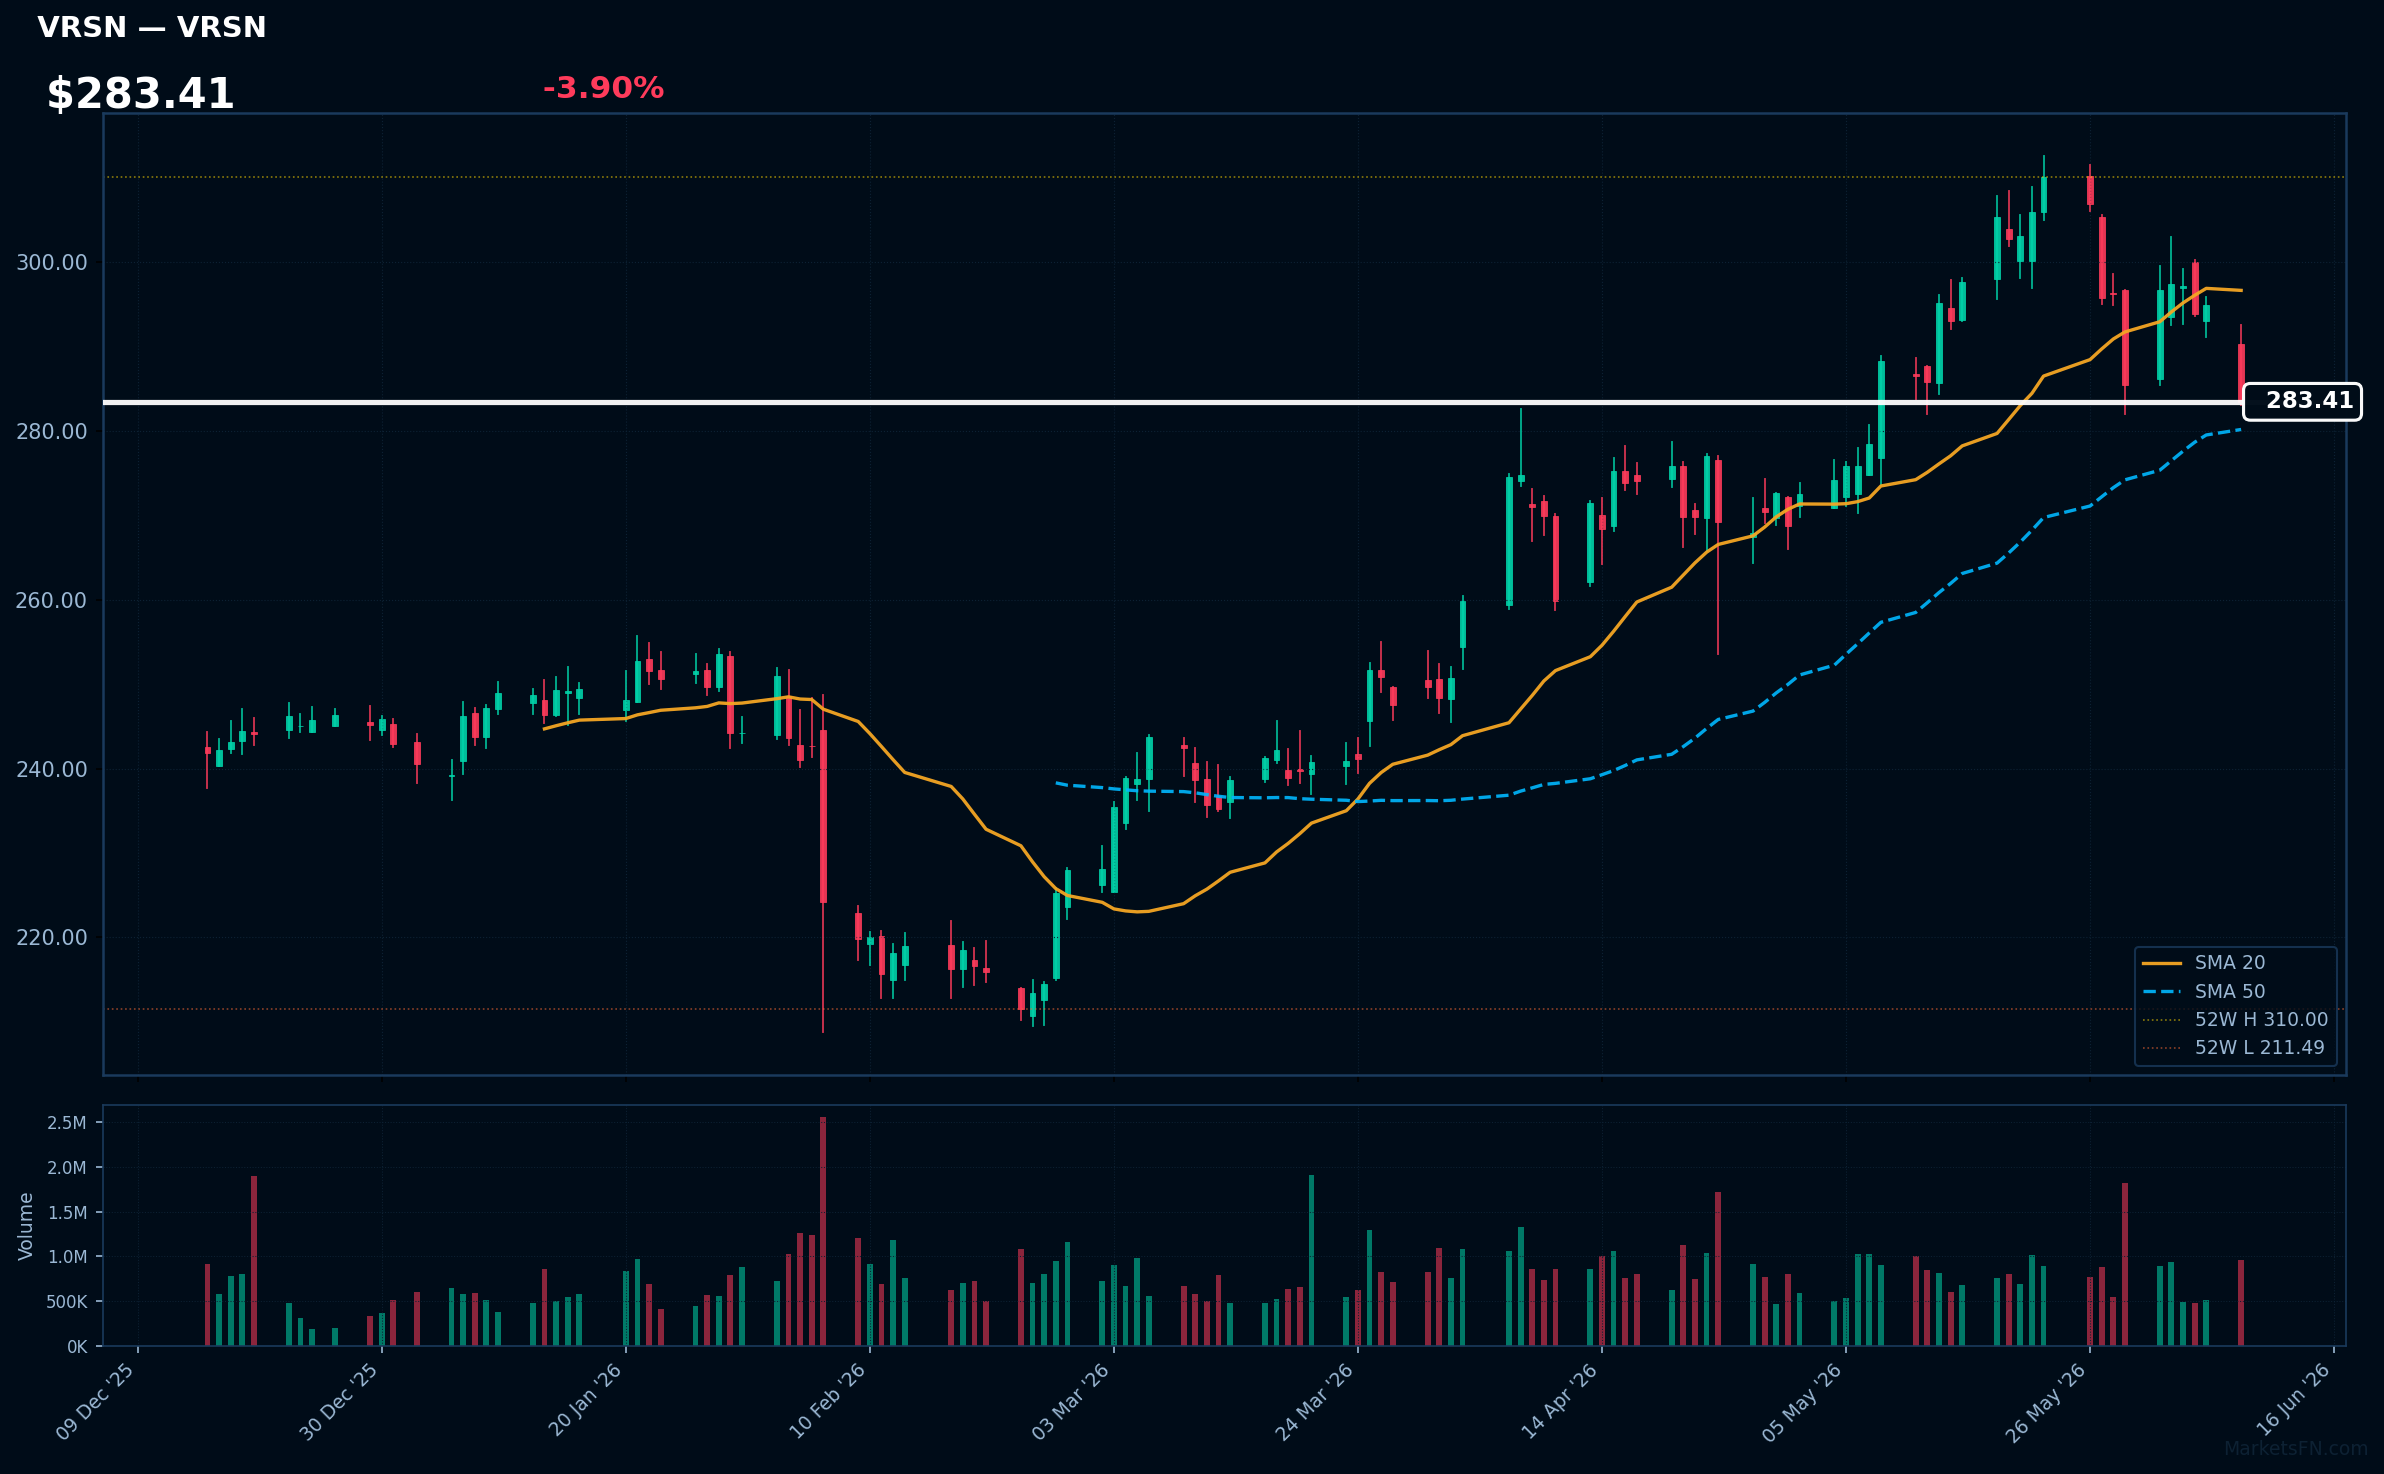
VRSN | Verisign Inc | Technology | Price: $283.41 | Day: -3.90% | 1W: -4.44% | 1M: +1.77% | RSI: 44.5 | vs MA200: +9.6% | Trend: Above MA50, MA200 · Below MA20
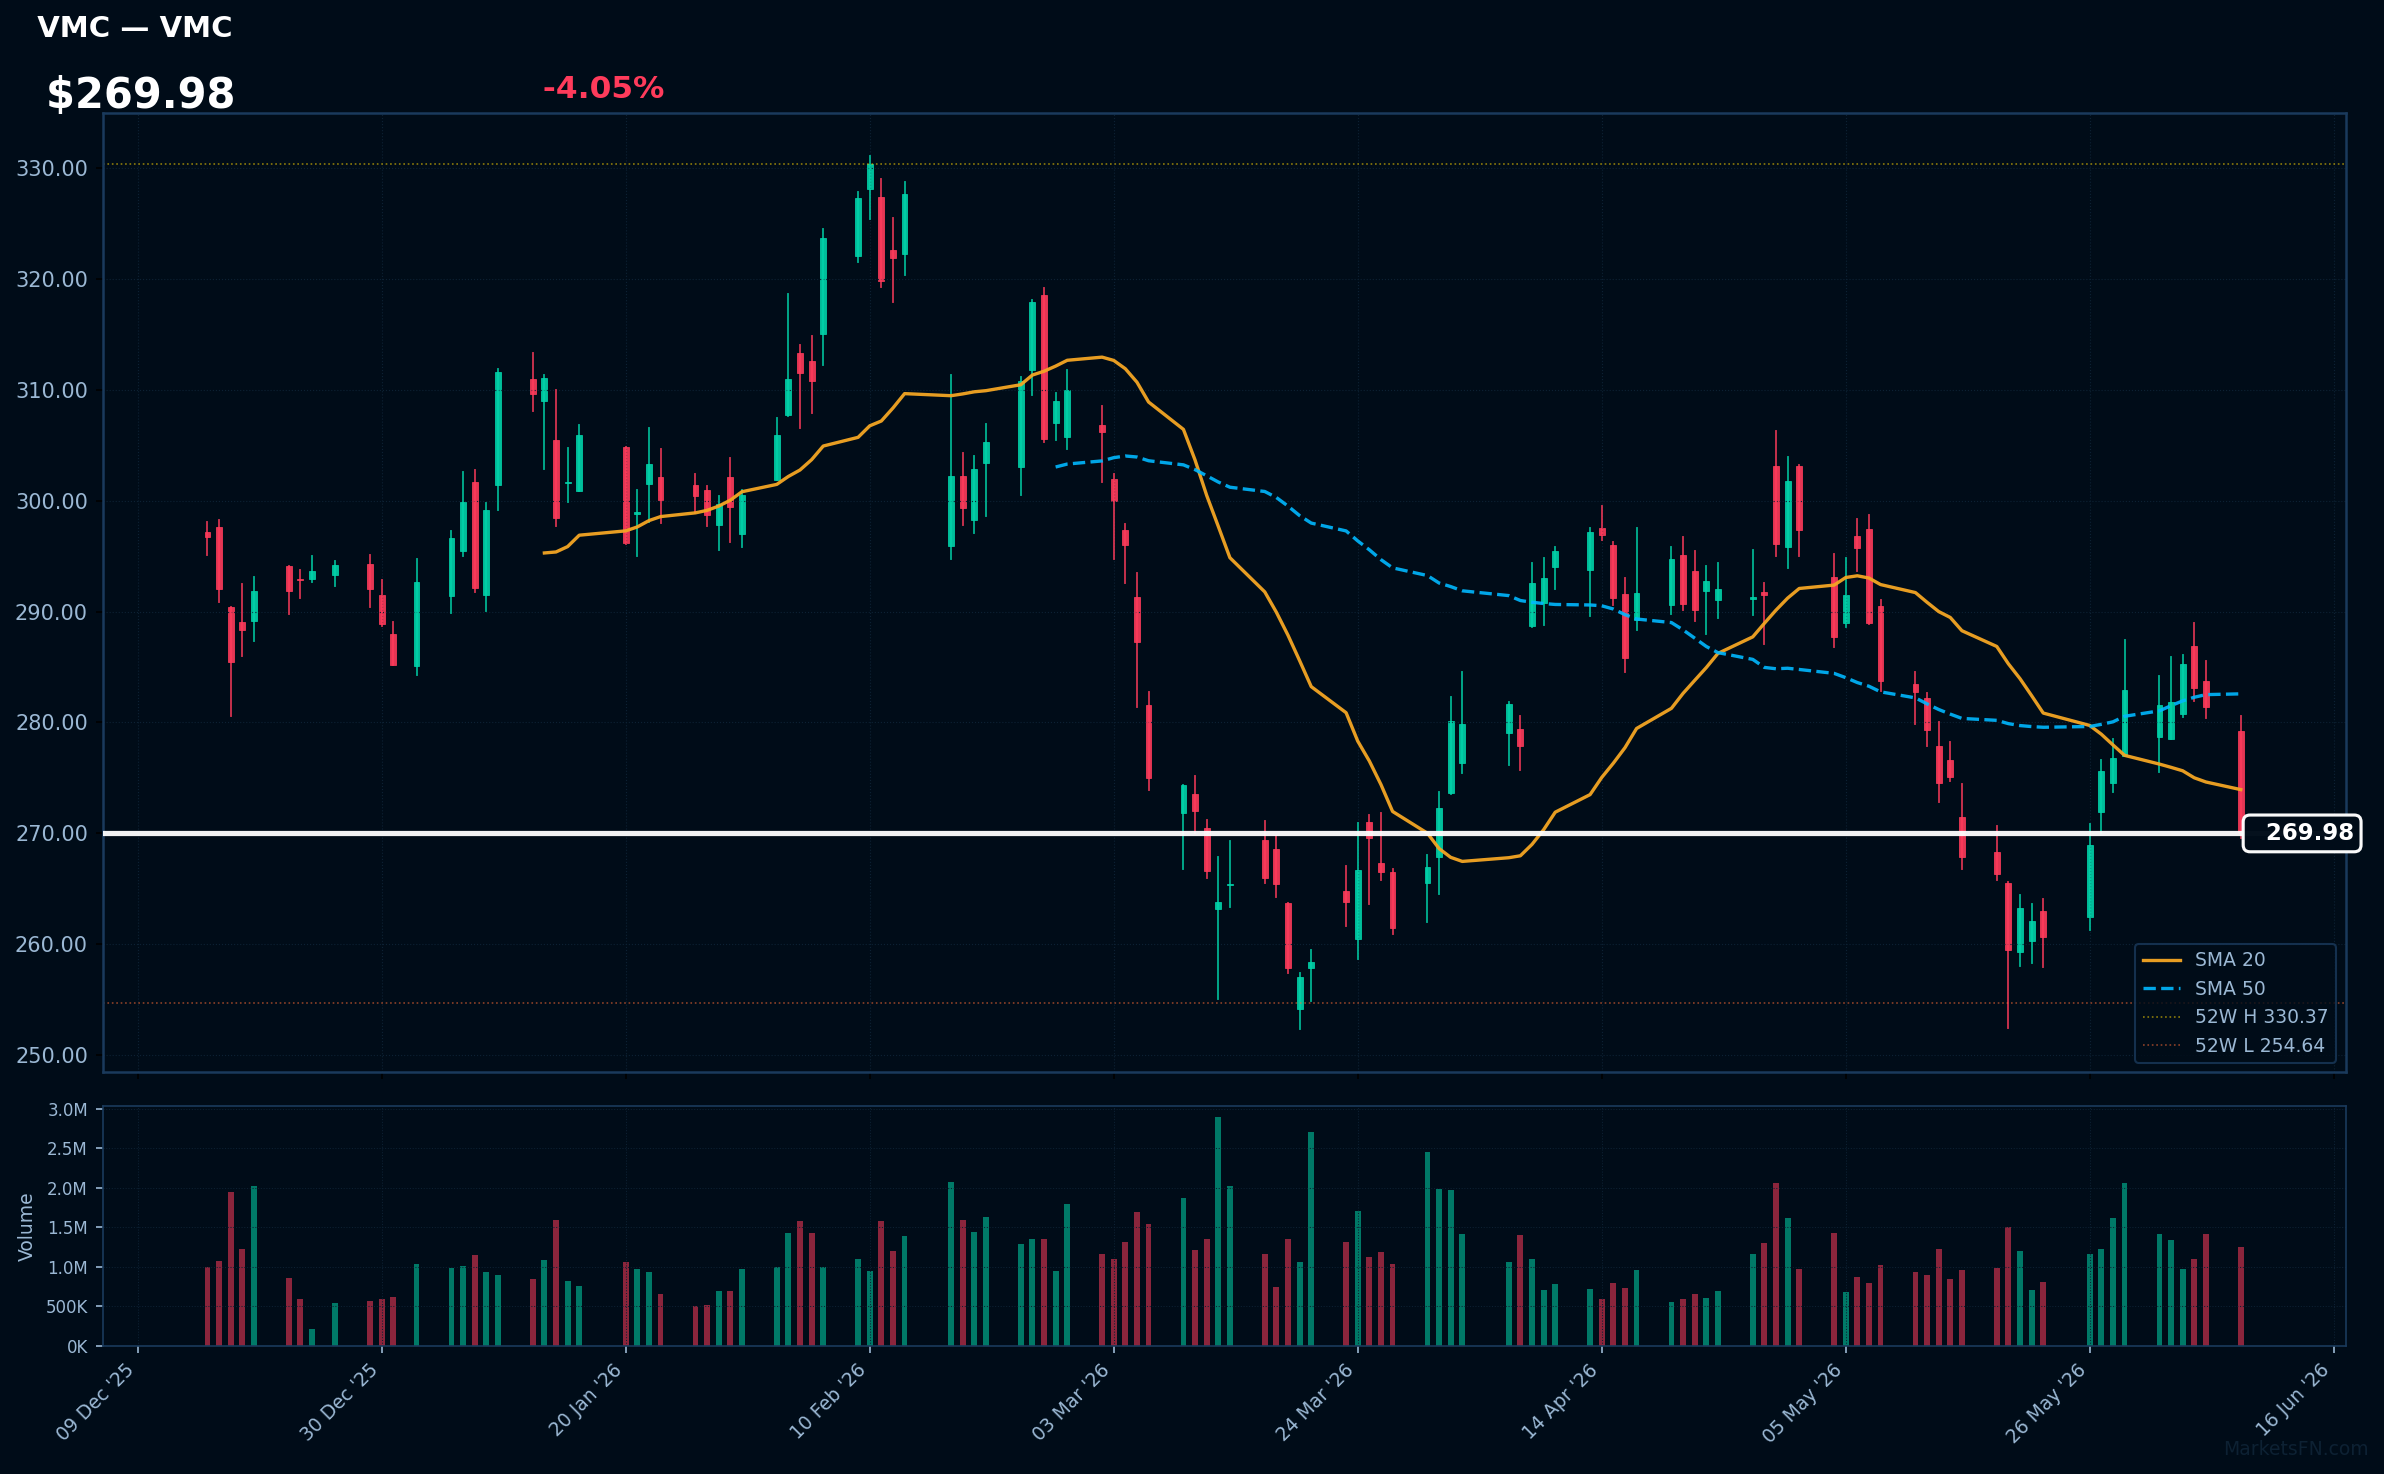
VMC | Vulcan Materials Co | Basic Materials | Price: $269.98 | Day: -4.05% | 1W: -4.11% | 1M: -6.56% | RSI: 41.8 | vs MA200: -7.4% | Trend: Below MA20, MA50, MA200
Recent headlines (last 12h)
- VULCAN SHARPENS AGGREGATES FOCUS: EXITS CALIFORNIA CONCRETE, EXPANDS AGGREGATES FOOTPRINT IN DALLAS-FORT WORTH AND INTO COLORADO
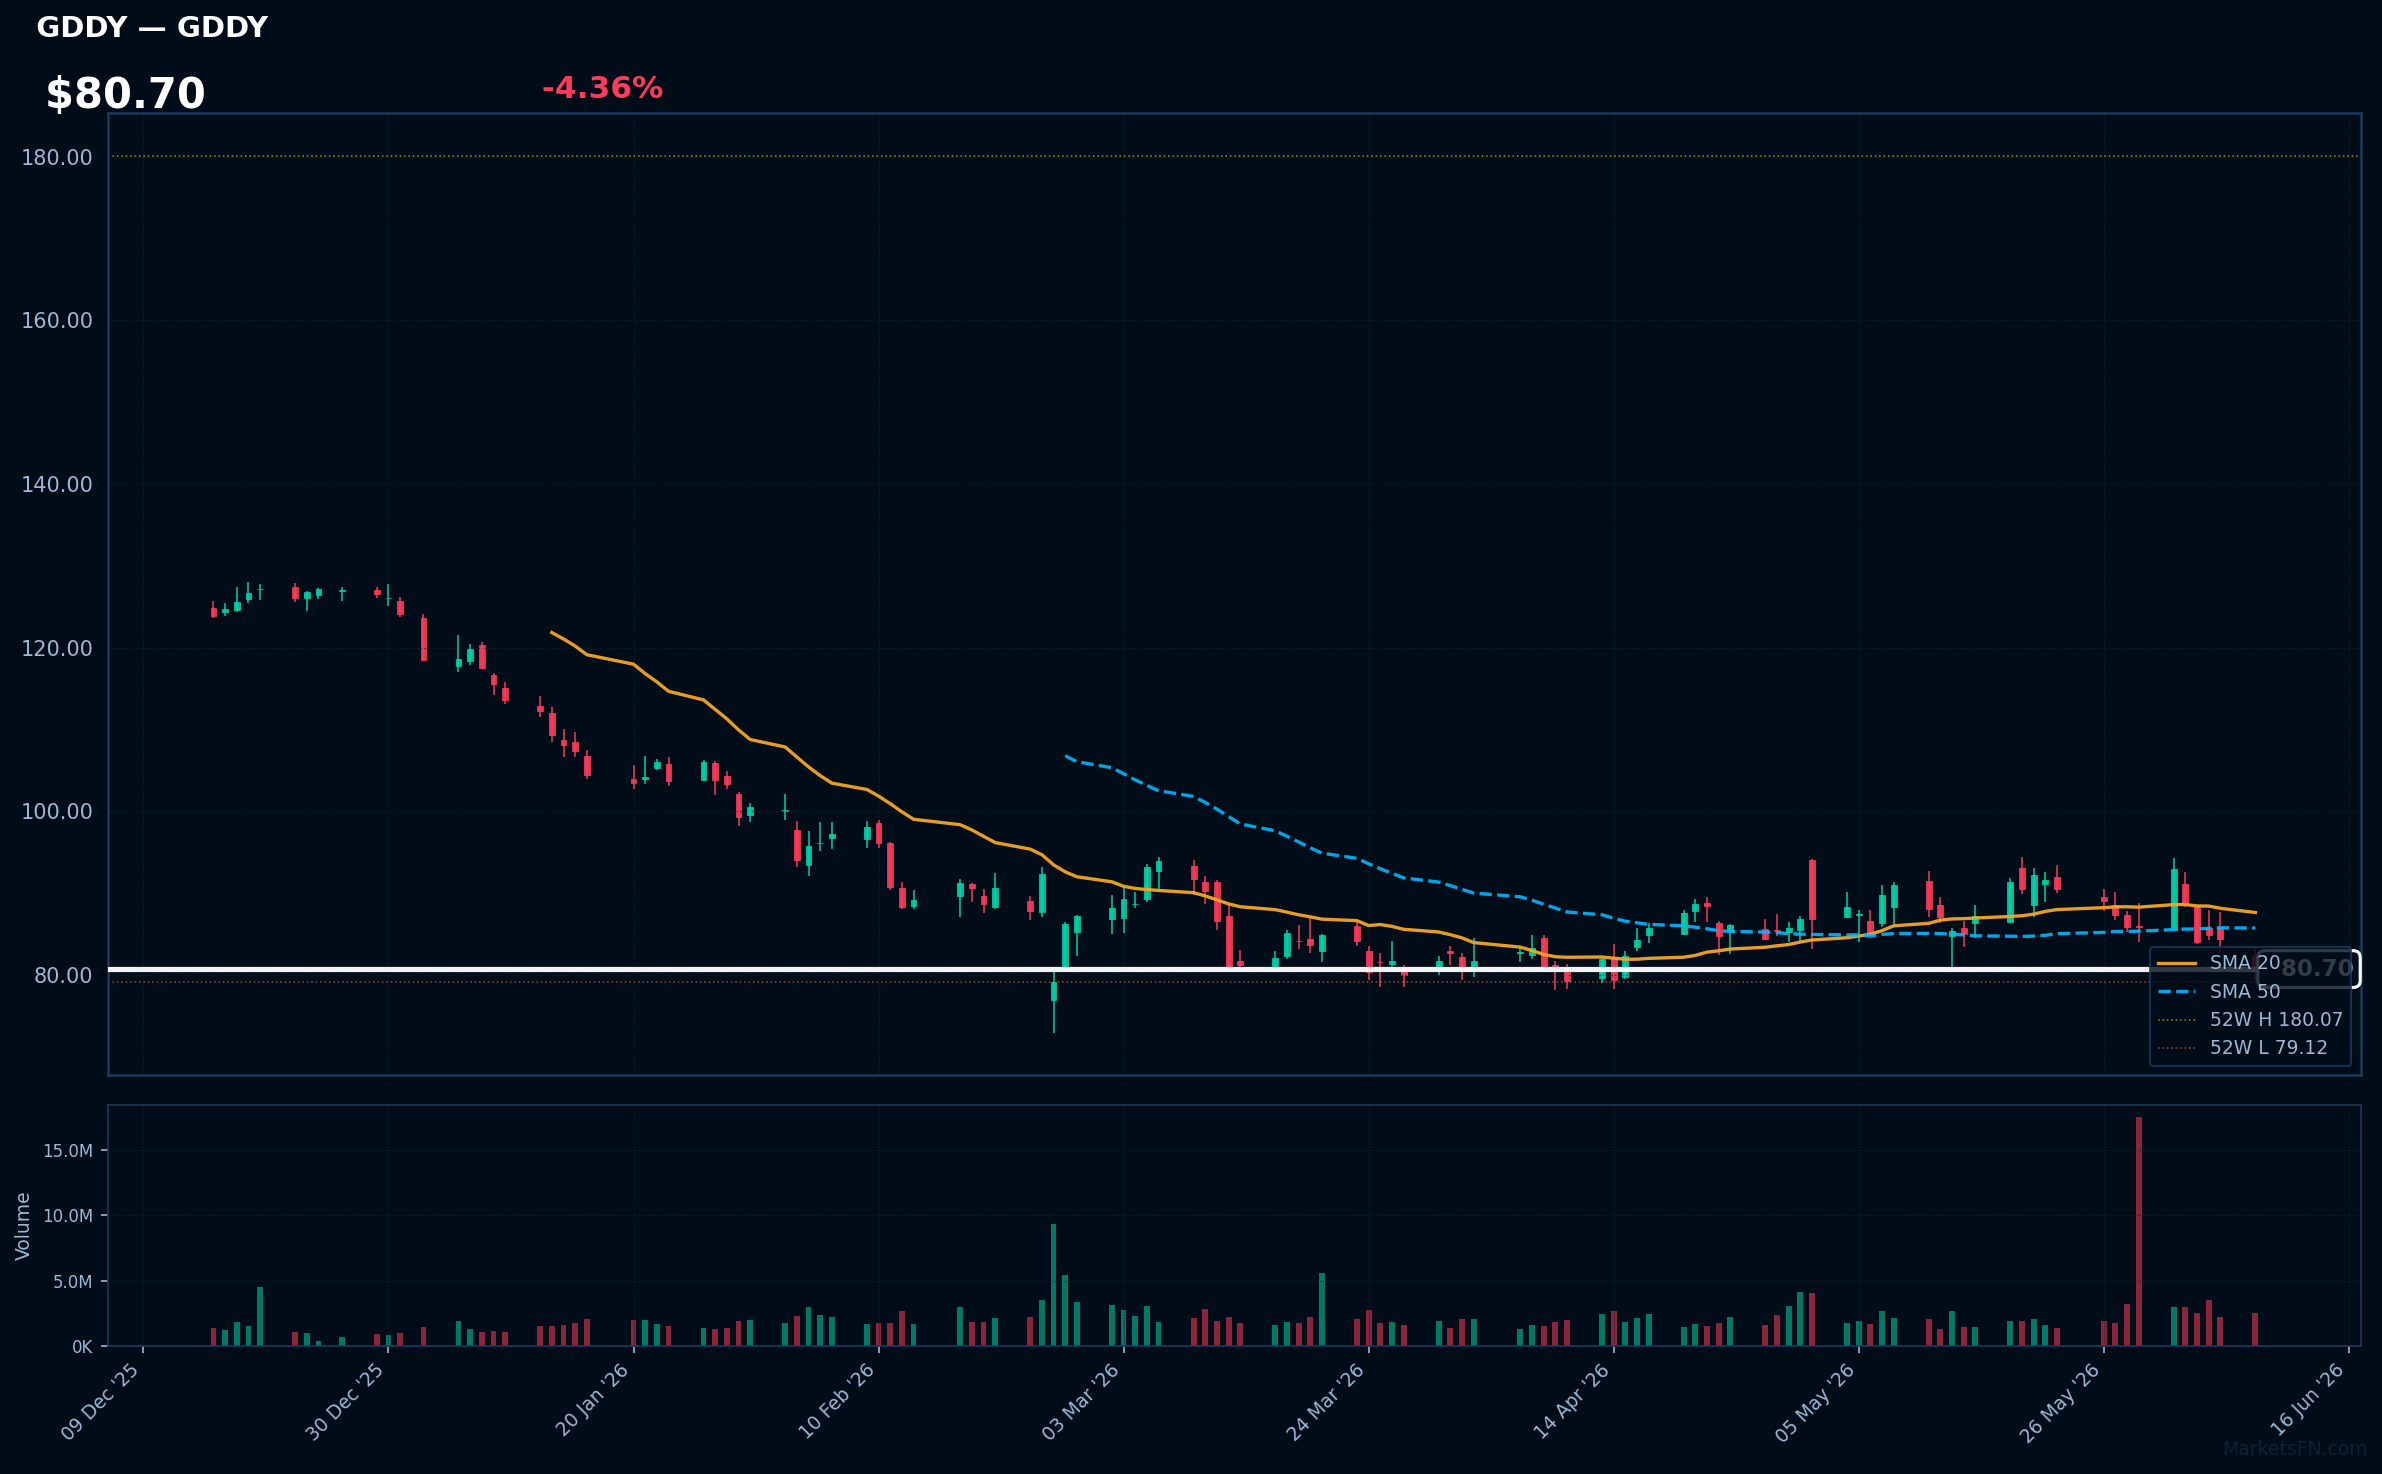
GDDY | Godaddy Inc | Technology | Price: $80.70 | Day: -4.36% | 1W: -13.22% | 1M: -10.08% | RSI: 39.2 | vs MA200: -27.2% | Trend: Below MA20, MA50, MA200
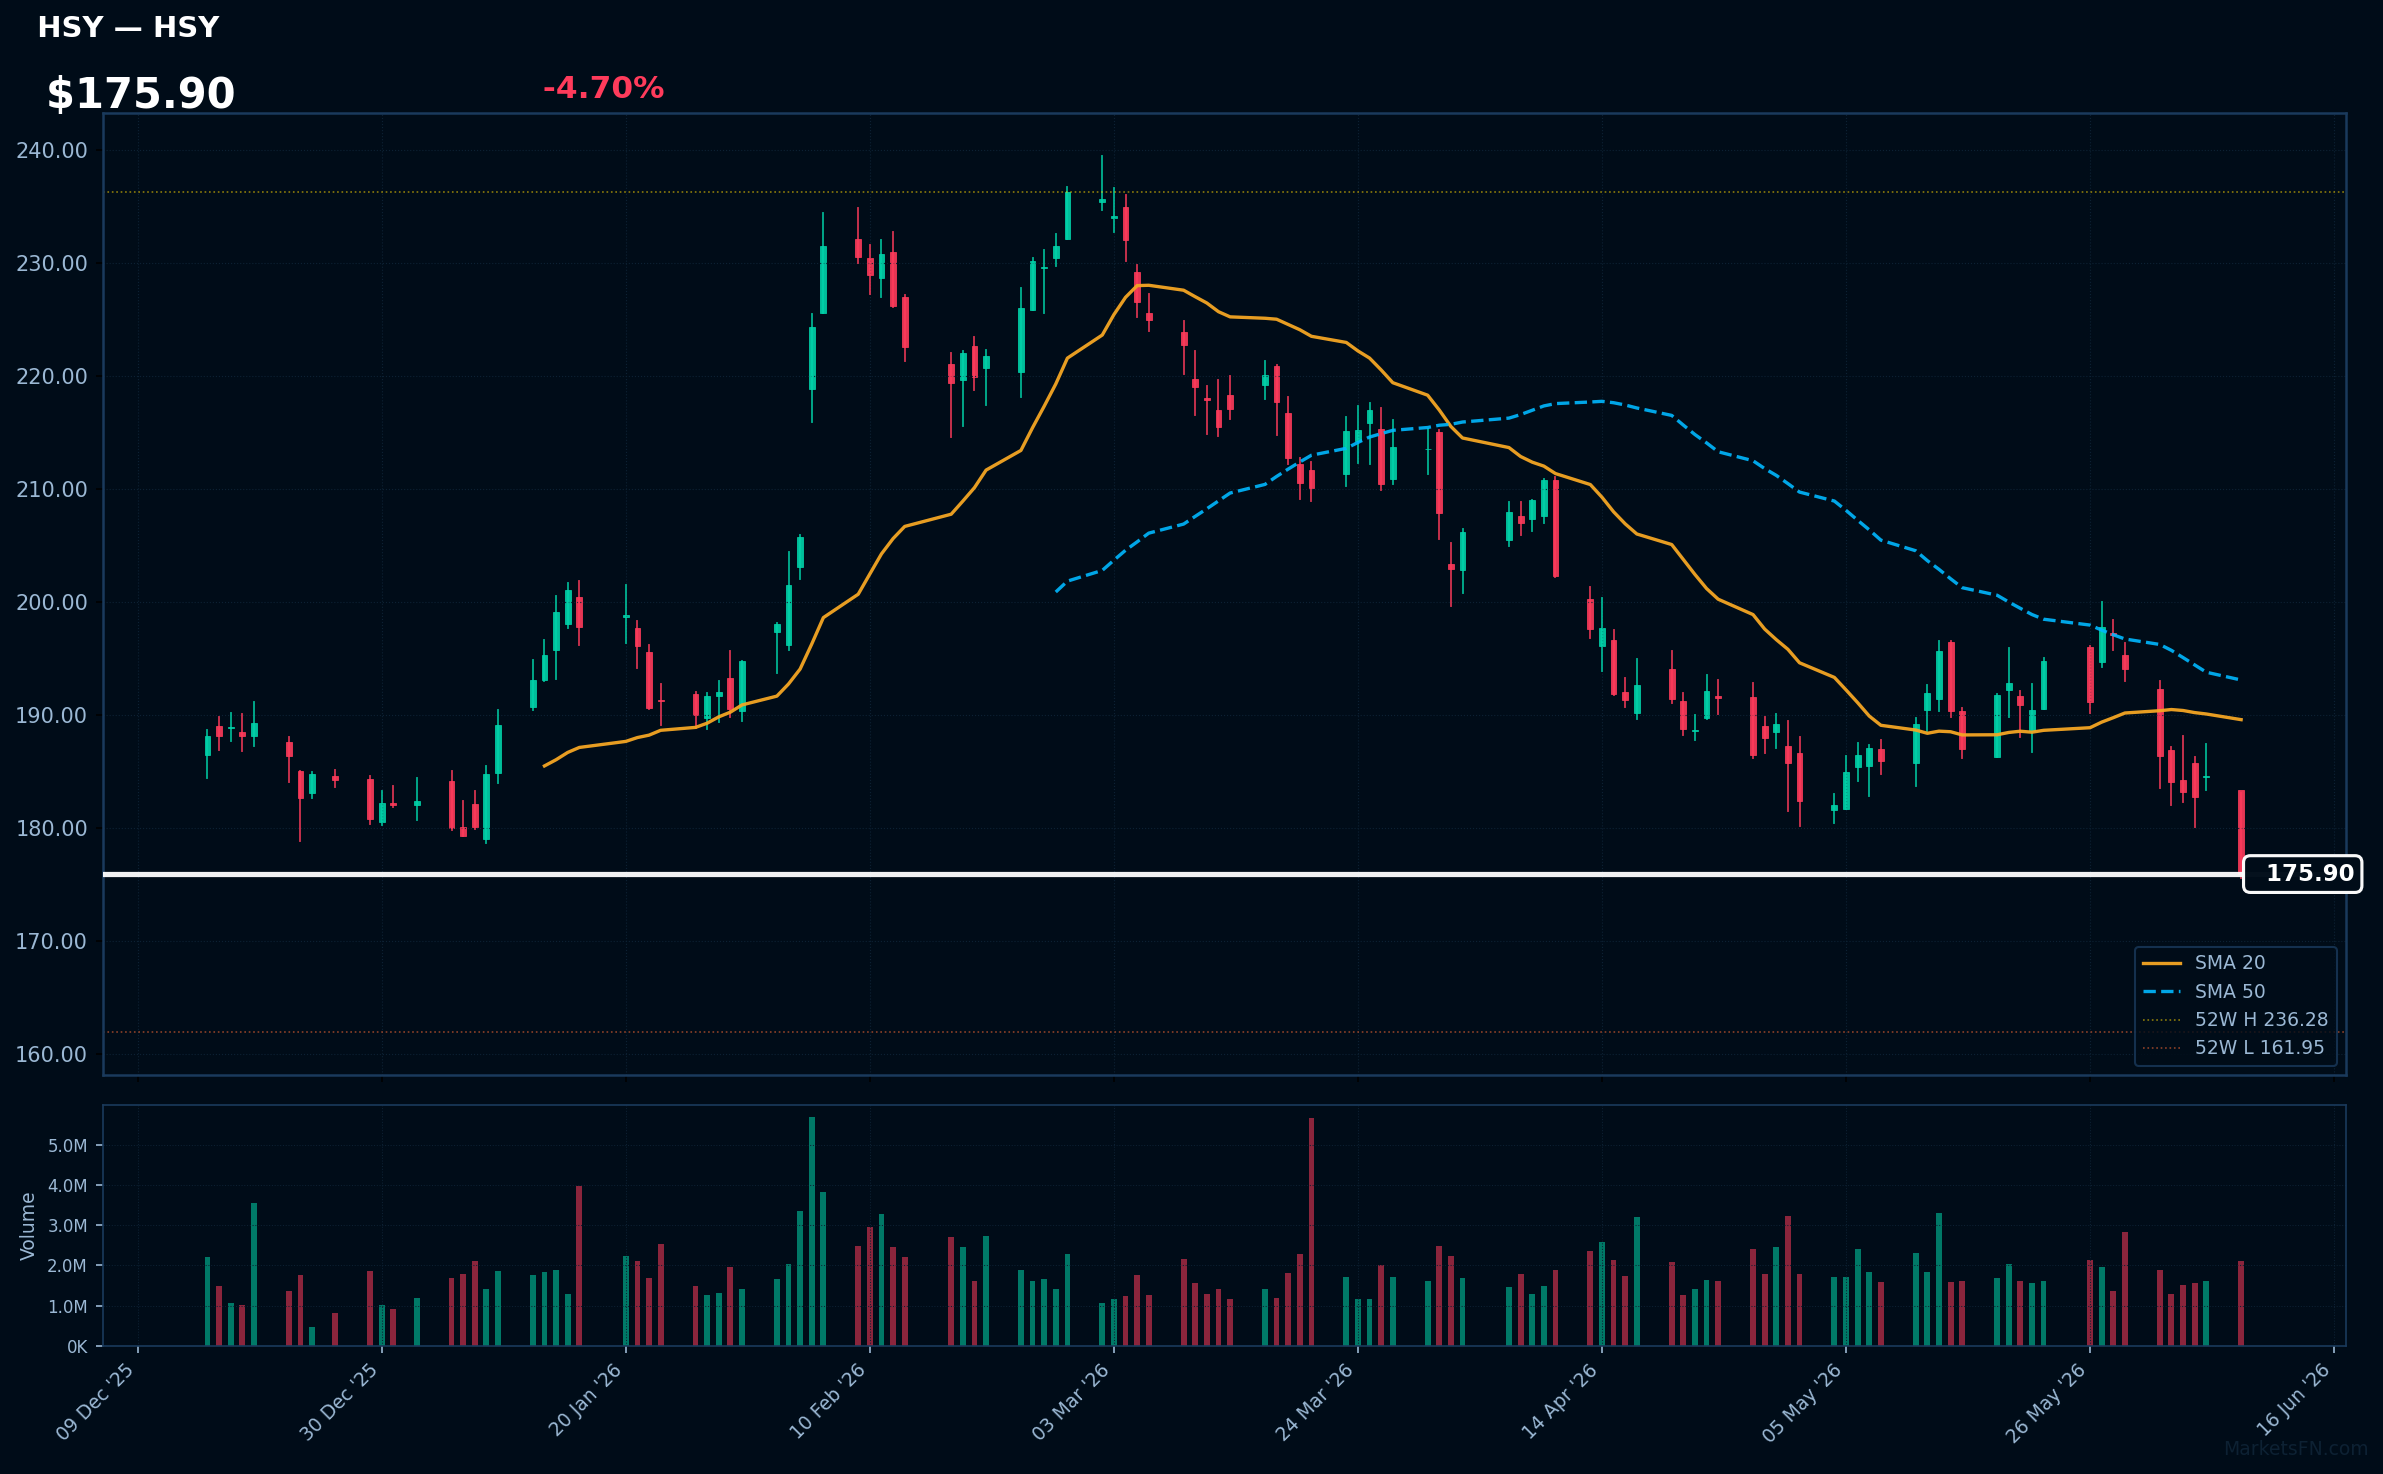
HSY | Hershey Company | Consumer Defensive | Price: $175.90 | Day: -4.70% | 1W: -5.63% | 1M: -5.97% | RSI: 33.6 | vs MA200: -9.3% | Trend: Below MA20, MA50, MA200
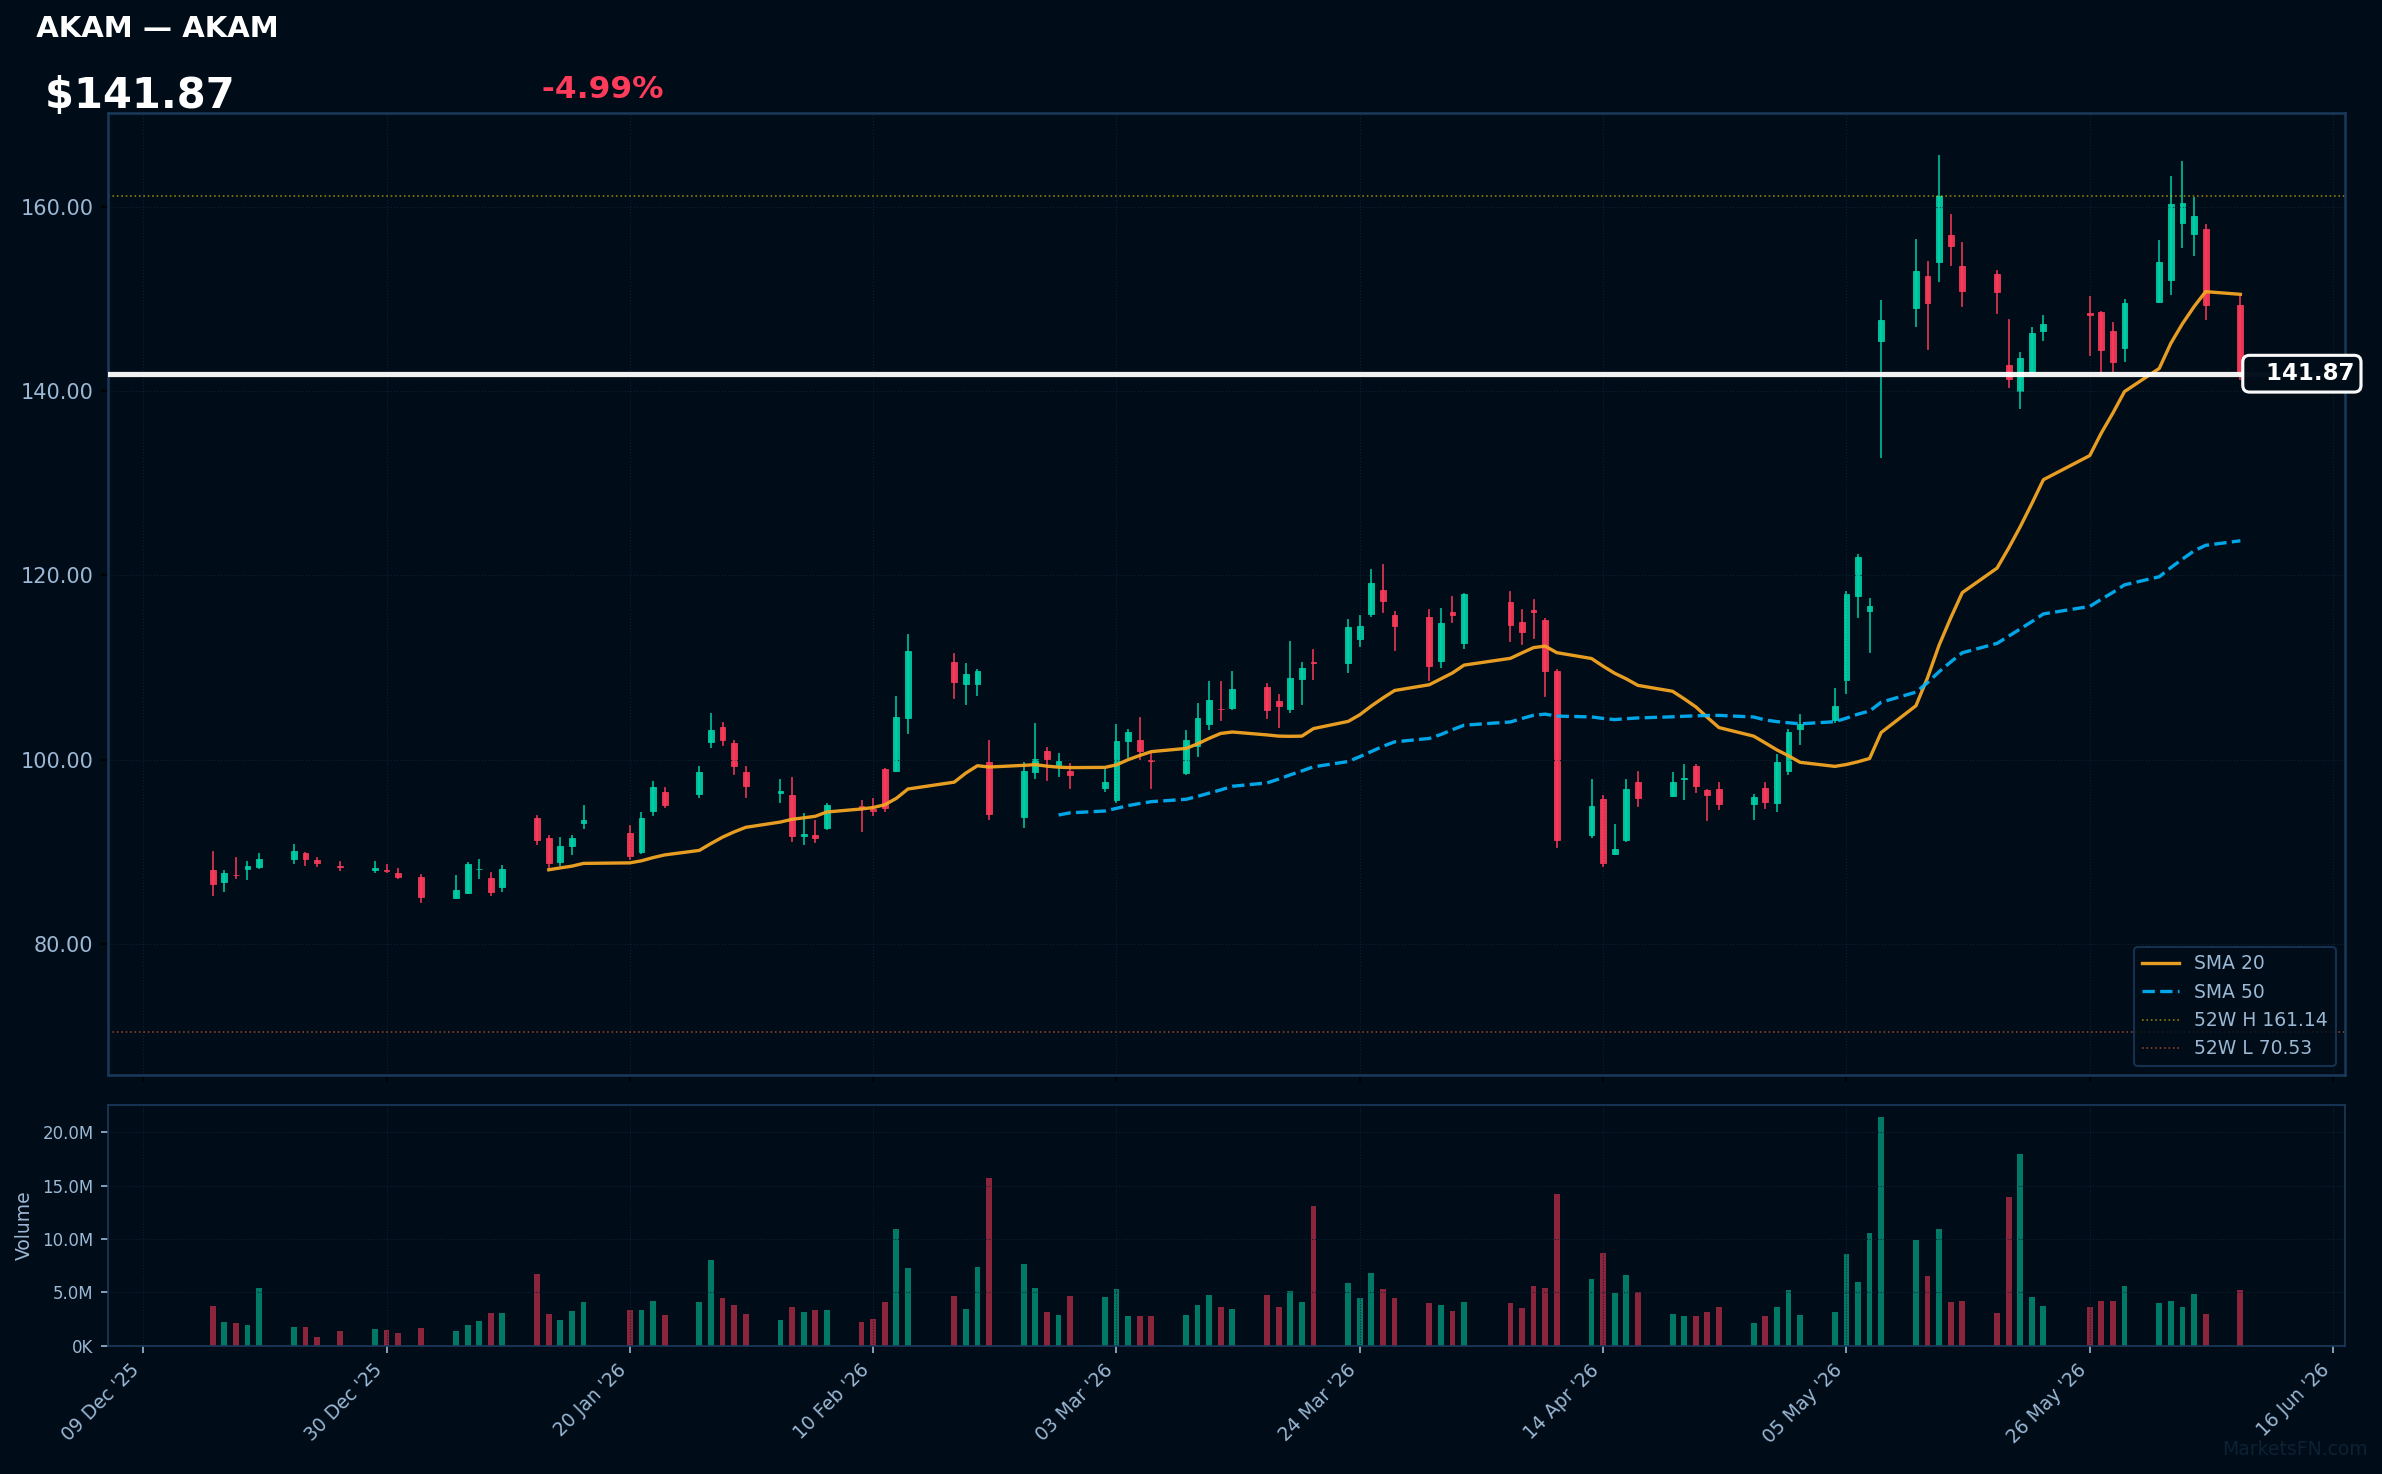
AKAM | Akamai Technologies Inc | Technology | Price: $141.87 | Day: -4.99% | 1W: -7.88% | 1M: +21.58% | RSI: 50.8 | vs MA200: +46.4% | Trend: Above MA50, MA200 · Below MA20
Recent headlines (last 12h)
- Akamai Technologies Inc. stock underperforms Monday when compared to competitors
Market Commentary
The S&P 500's June 08, 2026 session saw a narrow advance, with 173 stocks (34.9%) rising against 322 decliners (64.9%), indicating a negative breadth. The average daily change was a modest 0.30%, suggesting a lackluster tone.
Sector rotation is evident, with Technology and Financial stocks leading gains (INTC, MU, KLAC, COIN among top 10 gainers), while Utilities, Basic Materials, and Healthcare names dominated the laggards (PCG, REGN, MLM, MOS among top 10 losers). This rotation may signal a shift in investor sentiment towards cyclical and growth-oriented sectors.
Traders should monitor the 200-day MA, as only 12 stocks (2.4%) remain above it, indicating a fragile technical setup. A break lower could exacerbate the decline. The next catalyst will be the upcoming earnings reports from key Technology and Financial sector players; a positive surprise could help stabilize the market, while a miss could further pressure the S&P 500.
Methodology
Daily ranking uses the latest session close versus the prior close. RSI (14-day EWM), MA20, MA50, and MA200 are computed from 12 months of daily OHLCV data sourced from Yahoo Finance. Charts show the last 120 trading sessions with SMA 20/50, 52-week H/L markers, and volume. Recent news (last 12 h) is sourced from FinViz. Updated every trading day.
Disclaimer
The content on MarketsFN.com is provided for educational and informational purposes only. It does not constitute financial advice, investment recommendations, or trading guidance. All investments involve risks, and past performance does not guarantee future results. You are solely responsible for your investment decisions and should conduct independent research and consult a qualified financial advisor before acting. MarketsFN.com and its authors are not liable for any losses or damages arising from your use of this information.
Related Articles
- Nasdaq 100 Bull & Bear Radar — June 08, 2026 — Nasdaq 100 Bull & Bear Radar — June 08, 2026 A daily technical sweep of 101 Nasdaq 100 constituents ranked by session…
- Duluth Holdings Inc. (DLTH) Rallies 29.82% After Earnings — Post Earning Analysis Duluth Holdings Inc. (DLTH) Rallies 29.82% After Earnings Duluth Holdings Inc. offers a…
- Optical Cable Corporation (OCC) Rallies 54.47% After Earnings — Post Earning Analysis Optical Cable Corporation (OCC) Rallies 54.47% After Earnings Optical Cable Corporation's (OCC)…
- The Infrastructure of a Spacefaring Civilization: A Financial Analysis of the SpaceX IPO — The Infrastructure of a Spacefaring Civilization: A Deep-Dive Financial Analysis of the SpaceX IPO Published: June 08,…
- company_name (OCC) quarter year OCC Holdings Corp Financial Results Summary — Optical Cable Corporation (OCC) Q2 2023: New Loan Agreement Secured — Cautiously Optimistic In a significant…