S&P 500 Market Update – April 10, 2026
· Market News · MarketsFN Team
S&P 500 Market Update – April 10, 2026
Published: April 10, 2026 · MarketsFN Team
| Index | Price | Change | RSI(14) | SMA-20 | 52W High | 52W Low |
|---|---|---|---|---|---|---|
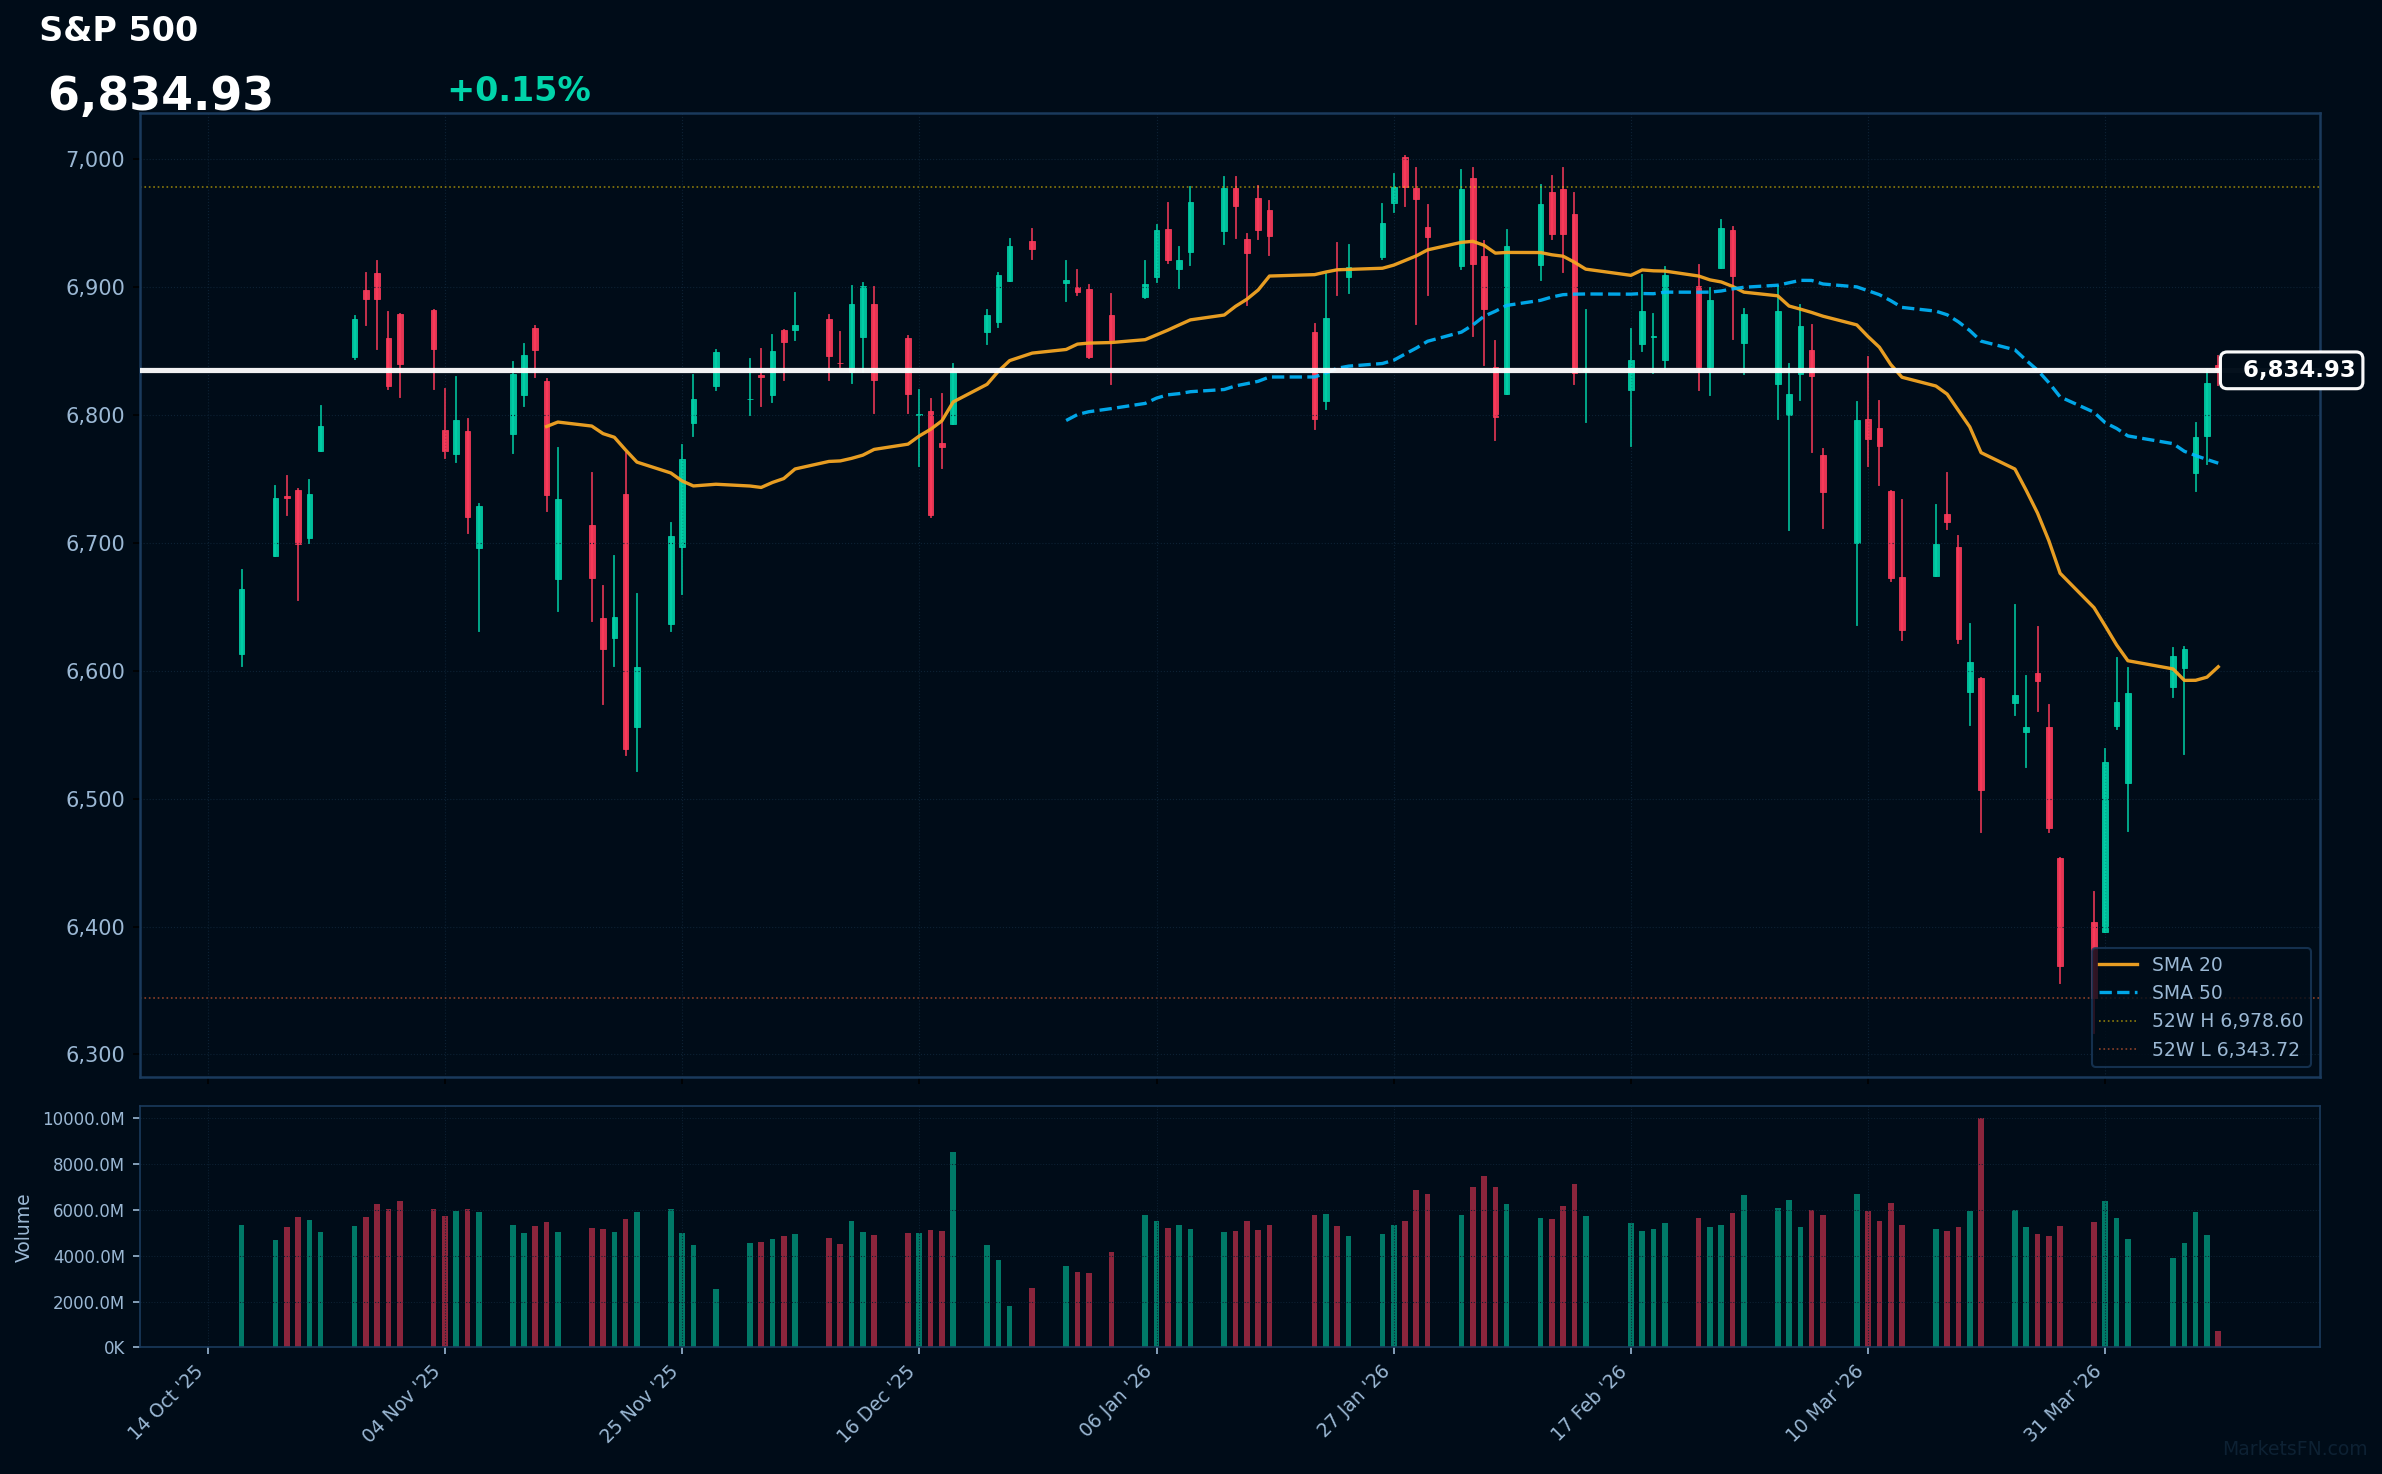
| S&P 500 | 6,834.93 | +0.15% | 68.8 | 6,603.10 | 6,978.60 | 6,343.72 |
The S&P 500 is actively quoting at 6,834.93 (+0.15%) as market participants continue to assess economic data and corporate earnings. This modest gain reflects ongoing investor confidence, maintaining the index’s position above key moving averages despite recent volatility. The day's trading range has been between 6,823.46 and 6,845.77, indicating a relatively stable session.
Technically, the index remains above both the 20-day simple moving average (SMA) of 6,603.10 and the 50-day SMA of 6,762.33, suggesting a bullish trend in the near term. The Relative Strength Index (RSI) is currently at 68.8, indicating that the index is approaching overbought territory but still remains within neutral bounds, allowing for further upward movement before a potential correction.
Looking ahead, key levels to watch include the resistance at 6,845.77 and the psychological barrier of 6,900. A sustained move above these levels could signal continued bullish momentum, while a fall below 6,762.33 may indicate a shift in sentiment.
Disclaimer
The content on MarketsFN.com is provided for educational and informational purposes only. It does not constitute financial advice or investment recommendations. All investments involve risks and past performance does not guarantee future results. You are solely responsible for your investment decisions.