Tech Rout Drags Nasdaq Down 4.8% as AI Fears Spark Broad Selloff
· Market News · MarketsFN Team
Nasdaq Suffers Worst Day in Over a Year Amid AI Spending Concerns
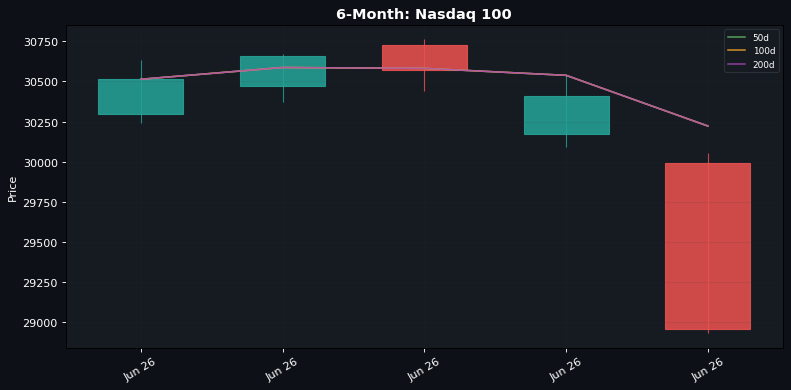
US equities plunged Friday as tech stocks led a broad market retreat, with the Nasdaq 100 plummeting 4.77% - its worst single-day drop since April 2025. The selloff accelerated after reports surfaced that Meta may raise billions to fund AI infrastructure, sparking fears of ballooning capital expenditures across the sector.
🇺🇸 US Session Overview
The S&P 500 closed down 2.64% at 7,383.74 as technology stocks accounted for nearly half the index's decline. The Dow Jones showed relative resilience with a 1.35% drop to 50,866.78, while small caps suffered with the Russell 2000 falling 3.47%. Semiconductor stocks were particularly hard hit following news that Google will pay SpaceX $920 million monthly for AI compute capacity, raising concerns about escalating infrastructure costs.
📅 Economic Calendar Highlights
The May jobs report showed mixed signals: while nonfarm payrolls nearly doubled expectations at 172K (vs. 85K forecast), wage growth slowed to 3.4% YoY from 3.6% previously. Canada's labor market surprised positively with 87.8K jobs added versus 10.6K expected. The Eurozone Q1 GDP disappointed at -0.2% QoQ, while India's Q4 GDP beat at 7.8% YoY.
📋 Earnings Spotlight
Today's earnings calendar was light, with small-cap companies including ABM Industries, StealthGas, and G-III Apparel Group reporting before market open. None of these releases appeared to significantly impact broader market sentiment.
💱 FX & Commodities
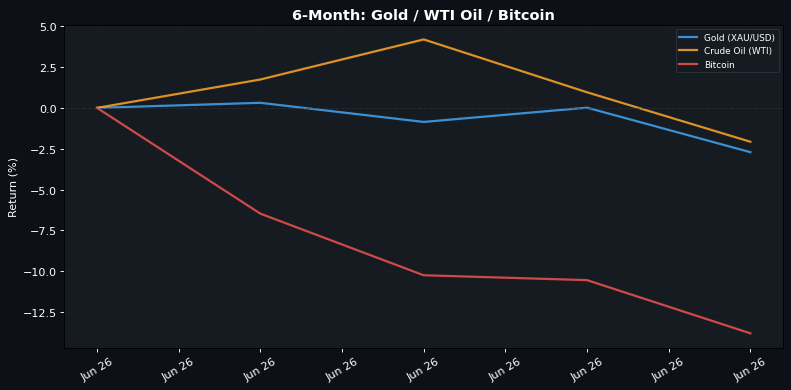
The DXY gained ground as risk-off flows dominated, with EUR/USD falling 0.71% to 1.1527 and AUD/USD dropping 1.19%. Commodities suffered steep losses: gold plunged 2.72% to $4,353.90, while silver cratered 7.84%. Crypto markets mirrored the risk-off mood with Bitcoin falling 3.64% to $61,481 and Ethereum collapsing 9.12%.
Markets will look to stabilize in Asian trading following today's rout, with focus shifting to upcoming SpaceX's market debut next week and whether tech stocks can find support after the brutal selloff. Traders will also monitor whether bitcoin can hold above the psychologically important $60,000 level.
🇺🇸 US Indices — Session Close
| Index | Price | Change | Change % |
|---|---|---|---|
| S&P 500 | 7,383.74 | ▼ -200.57 | ▼ -2.64% |
| Nasdaq 100 | 28,957.60 | ▼ -1450.21 | ▼ -4.77% |
| Dow Jones | 50,866.78 | ▼ -695.15 | ▼ -1.35% |
| Russell 2000 | 2,833.50 | ▼ -101.83 | ▼ -3.47% |
💱 FX Majors
| Pair | Rate | Change % |
|---|---|---|
| EUR/USD | 1.1527 | ▼ -0.71% |
| GBP/USD | 1.3336 | ▼ -0.68% |
| USD/JPY | 160.29 | ▲ +0.22% |
| AUD/USD | 0.705 | ▼ -1.19% |
| USD/CHF | 0.7962 | ▲ +0.65% |
🛢️ Commodities & Crypto
| Asset | Price (USD) | Change % |
|---|---|---|
| Gold (XAU/USD) | 4,353.90 | ▼ -2.72% |
| Silver (XAG/USD) | 68.00 | ▼ -7.84% |
| Crude Oil (WTI) | 90.25 | ▼ -3.00% |
| Brent Oil | 92.87 | ▼ -2.27% |
| Natural Gas | 3.22 | ▼ -3.48% |
| Bitcoin | 61,481.16 | ▼ -3.64% |
| Ethereum | 1,608.25 | ▼ -9.12% |
📋 Today's Earnings
| Ticker | Company | Timing | Market Cap |
|---|---|---|---|
| ABM | ABM Industries Inc | BMO | 2490000000.0 |
| GASS | StealthGas Inc | BMO | 357720000.0 |
| GIII | G-III Apparel Group Ltd | BMO | 1420000000.0 |
| HERE | Here Group Ltd ADR | BMO | 67210000.0 |
| TOUR | Tuniu Corp ADR | BMO | 516860000.0 |
📅 Economic Calendar
All times in UTC — Actual highlighted where available
| Time | Currency | Event | Imp. | Actual | Forecast | Previous |
|---|---|---|---|---|---|---|
| 12:30 | USD | Average Hourly Earnings (MoM) (May) | 🔴🔴🔴 | 0.3% | 0.3% | 0.2% |
| 12:30 | USD | Nonfarm Payrolls (May) | 🔴🔴🔴 | 172K | 85K | 179K |
| 12:30 | USD | Unemployment Rate (May) | 🔴🔴🔴 | 4.3% | 4.3% | 4.3% |
| 04:30 | INR | Interest Rate Decision | 🟡🟡 | 5.25% | 5.25% | 5.25% |
| 06:00 | GBP | Halifax House Price Index (MoM) (May) | 🟡🟡 | -0.1% | 0.0% | -0.1% |
| 06:00 | GBP | Halifax House Price Index (YoY) (May) | 🟡🟡 | 0.5% | 1.0% | 0.4% |
| 07:00 | TRY | CPI (MoM) (May) | 🟡🟡 | 1.71% | 1.60% | 4.18% |
| 07:00 | TRY | CPI (YoY) (May) | 🟡🟡 | 32.61% | 32.50% | 32.37% |
| 08:30 | GBP | Mortgage Rate (GBP) (May) | 🟡🟡 | 6.60% | 6.60% | |
| 09:00 | EUR | GDP (QoQ) (Q1) | 🟡🟡 | -0.2% | 0.1% | 0.1% |
| 09:00 | EUR | GDP (YoY) (Q1) | 🟡🟡 | 0.3% | 0.8% | 1.2% |
| 10:30 | INR | GDP Quarterly (YoY) (Q4) | 🟡🟡 | 7.8% | 7.2% | 8.0% |
| 12:30 | USD | Average Hourly Earnings (YoY) (YoY) (May) | 🟡🟡 | 3.4% | 3.4% | 3.6% |
| 12:30 | USD | Participation Rate (May) | 🟡🟡 | 61.8% | 61.8% | |
| 12:30 | USD | Private Nonfarm Payrolls (May) | 🟡🟡 | 120K | 85K | 177K |
| 12:30 | USD | U6 Unemployment Rate (May) | 🟡🟡 | 8.1% | 8.2% | |
| 12:30 | CAD | Employment Change (May) | 🟡🟡 | 87.8K | 10.6K | -17.7K |
| 12:30 | CAD | Unemployment Rate (May) | 🟡🟡 | 6.6% | 6.9% | 6.9% |
| 14:00 | CAD | Ivey PMI (May) | 🟡🟡 | 58.2 | 54.5 | 57.7 |
| 17:00 | USD | U.S. Baker Hughes Oil Rig Count | 🟡🟡 | 431 | 429 | |
| 17:00 | USD | U.S. Baker Hughes Total Rig Count | 🟡🟡 | 563 | 562 | |
| 19:00 | USD | Consumer Credit (Apr) | 🟡🟡 | 20.73B | 17.80B | 22.23B |
| 19:30 | GBP | CFTC GBP speculative net positions | 🟡🟡 | -52.2K | -61.4K | |
| 19:30 | USD | CFTC Crude Oil speculative net positions | 🟡🟡 | 155.9K | 161.0K | |
| 19:30 | USD | CFTC Gold speculative net positions | 🟡🟡 | 176.0K | 154.3K | |
| 19:30 | USD | CFTC Nasdaq 100 speculative net positions | 🟡🟡 | -14.9K | -6.1K | |
| 19:30 | USD | CFTC S&P 500 speculative net positions | 🟡🟡 | -220.8K | -165.8K | |
| 19:30 | AUD | CFTC AUD speculative net positions | 🟡🟡 | 41.8K | 60.2K | |
| 19:30 | BRL | CFTC BRL speculative net positions | 🟡🟡 | 47.0K | 71.7K | |
| 19:30 | JPY | CFTC JPY speculative net positions | 🟡🟡 | -129.6K | -114.7K | |
| 19:30 | EUR | CFTC EUR speculative net positions | 🟡🟡 | 48.9K | 29.4K | |
| 07:30 | EUR | ECB Supervisory Board Member Tuominen Speaks | 🟡🟡 | — | ||
| 18:00 | GBP | BoE Gov Bailey Speaks | 🟡🟡 | — |
Report published: June 05, 2026 — 23:36 CET
Disclaimer
The content on MarketsFN.com is provided for educational and informational purposes only. It does not constitute financial advice, investment recommendations, or trading guidance. All investments involve risks, and past performance does not guarantee future results. You are solely responsible for your investment decisions and should consult a qualified financial adviser before acting. MarketsFN.com and its authors are not liable for any losses arising from your use of this information.