**Tron at Oversold RSI 26.6: Rebound Ahead for $0.3251 TRX?**
· Crypto · QuoteReporter
**Tron at Oversold RSI 26.6: Rebound Ahead for $0.3251 TRX?**
Tron (TRX/USD) | June 05, 2026 $0.3251 -2.08%
🔍 Technical Analysis
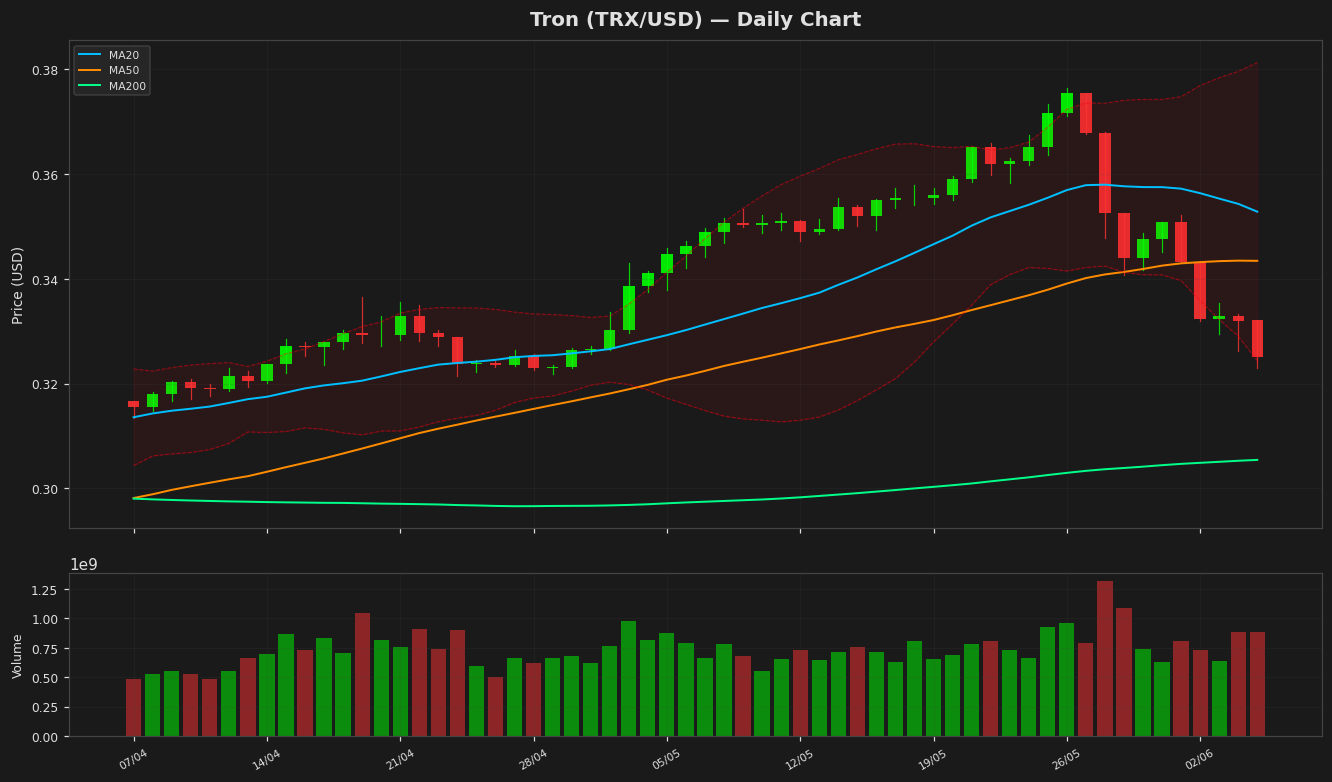
Tron (TRX) is currently trading at $0.325120, reflecting a daily decline of 2.08%. The price action shows TRX struggling below its key moving averages, with the MA20 at $0.352779 and MA50 at $0.343401, indicating short-term bearish momentum. However, the MA200 at $0.305435 suggests a longer-term bullish trend remains intact if support holds. Bollinger Bands reveal tightening volatility, with the upper band at $0.38121 and lower band at $0.324348. The price hovering near the lower band suggests potential oversold conditions. The RSI(14) at 26.649249 confirms oversold territory, signaling a possible reversal or consolidation if buying pressure emerges. The MACD histogram at -0.003957 below the signal line (0.000818) indicates bearish momentum, though the narrowing gap hints at weakening downward pressure. Key support lies at the 52-week low of $0.26813799, while resistance is seen at the YTD high of $0.37633201. The ATR(14) of $0.008597 reflects subdued volatility. A break above the MA20 could target $0.352779, while failure to hold $0.324348 may test lower supports. Traders should monitor RSI for divergence and MACD for crossover signals to gauge trend reversals.
Technical Metrics
| Metric | Value |
|---|---|
| Current Price | $0.3251 |
| Daily Change | -2.08% |
| MA 20 | $0.3528 |
| % from MA20 | -7.84% |
| MA 50 | $0.3434 |
| % from MA50 | -5.32% |
| MA 200 | $0.3054 |
| % from MA200 | +6.44% |
| BB Upper | $0.3812 |
| % from BB Upper | -14.71% |
| BB Lower | $0.3243 |
| % from BB Lower | +0.24% |
| RSI (14) | 26.65 |
| MACD | -0.003957 |
| MACD Signal | 0.000818 |
| ATR (14) | 0.008597 |
| 3-Day High | $0.3353 |
| 3-Day Low | $0.3229 |
| 52-Week High | $0.3763 |
| % from 52W High | -13.61% |
| 52-Week Low | $0.2681 |
| % from 52W Low | +21.25% |
| YTD High | $0.3763 |
| % from YTD High | -13.61% |
| YTD Low | $0.2681 |
| % from YTD Low | +21.25% |
📊 Market Commentary
Tron (TRX) is currently trading at $0.3251, down 2.08% today, as the broader crypto market experiences subdued sentiment. The RSI at 26.6 indicates TRX is deeply oversold, suggesting potential for a short-term rebound if buying interest emerges. However, the lack of strong momentum keeps traders cautious. TRX’s 52-week range of $0.2681 to $0.3763 highlights its current position in the lower half of this band, reflecting weaker performance compared to its yearly highs.
Market sentiment around TRX remains neutral to slightly bearish, with traders monitoring key support and resistance levels. Immediate support lies near $0.3200, a psychological level that has held in recent weeks. A break below could test the yearly low of $0.2681. On the upside, resistance is seen around $0.3400, followed by the $0.3600 zone, which aligns with the 200-day moving average—a level often watched for trend confirmation.
Traders are also observing network activity and adoption metrics, as Tron’s high throughput and low fees continue to attract decentralized application (dApp) developers and stablecoin transactions. However, broader macroeconomic factors and Bitcoin’s price action remain influential, as TRX often correlates with the wider market. For now, the oversold RSI may attract short-term buyers, but sustained upward movement will require improved market sentiment and higher trading volumes.
Disclaimer
The content on MarketsFN.com is provided for educational and informational purposes only. It does not constitute financial advice or investment recommendations. All investments involve risk. Cryptocurrency markets are highly volatile. Past performance does not guarantee future results.