Wheat: Up 0.0% to $610.75 — Testing 38.2% Fibonacci Support
· Commodities · QuoteReporter
Wheat: Up 0.0% to $610.75 — Testing 38.2% Fibonacci Support
Analysis Date: June 01, 2026
📊 Current Market Data
CURRENT PRICE
$610.75
DAILY CHANGE
+0.04%
WEEKLY CHANGE
-5.49%
52W HIGH
$679.50
52W LOW
$492.25
💡 Key Market Factors
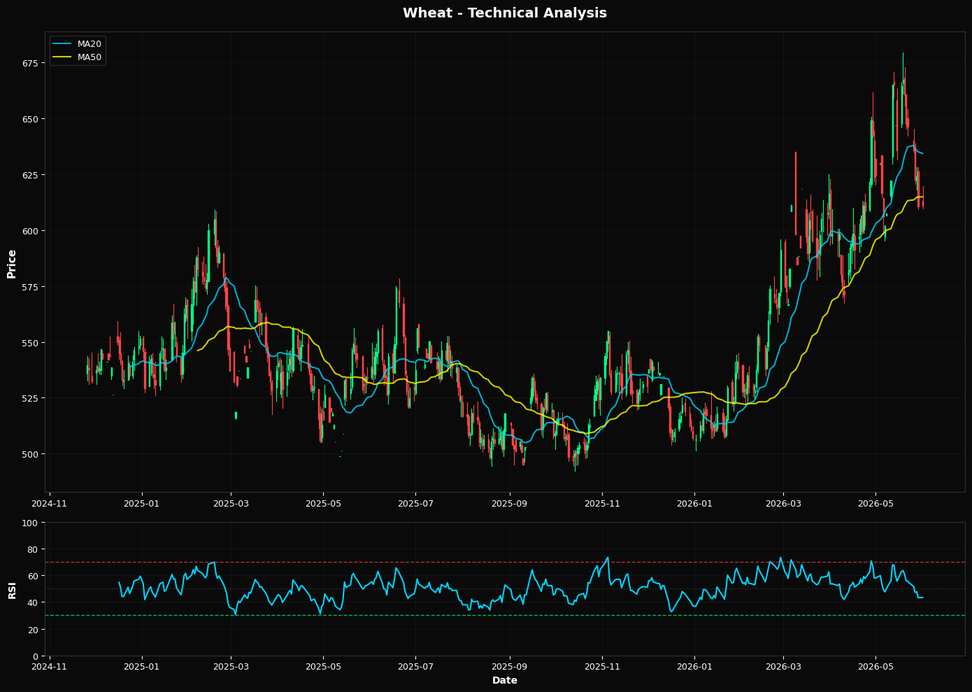
Wheat prices are poised for a potential rebound, with the current price of $610.75 sitting just above the critical Fibonacci support level at $607.97. This technical setup suggests a possible near-term bottom, especially given the oversold conditions indicated by the RSI of 43.4, which is approaching the lower threshold of 30 that typically signals a buying opportunity. The market's recent decline of 5.49% over the past week may have been overdone, setting the stage for a corrective bounce. The most significant macro driver impacting wheat prices right now is the strength of the U.S. dollar. A strong dollar typically pressures commodity prices, as it makes U.S.-denominated goods more expensive for foreign buyers. However, with the Federal Reserve's recent dovish signals suggesting a potential pause in rate hikes, the dollar's rally could stall, providing relief to wheat prices. This dynamic is crucial as it could reverse the recent downward pressure on wheat, allowing prices to stabilize or even rise. From a technical perspective, wheat is trading below its 20-day moving average of $634.27 and its 50-day moving average of $614.87, but remains above the 200-day moving average of $550.66. This positioning indicates a short-term bearish trend within a longer-term bullish framework. The proximity to the 38.2% Fibonacci retracement level at $607.97 adds a layer of support, suggesting that the downside may be limited. If prices can hold above this level, it could attract technical buying and shift momentum back to the upside. A key risk that could alter this outlook is the release of U.S. inflation data. Should inflation come in higher than expected, it could reignite fears of further Fed tightening, strengthening the dollar and exerting renewed pressure on wheat prices. Conversely, a softer inflation print could weaken the dollar and support a recovery in wheat. Traders should closely watch the upcoming inflation report, as it will be pivotal in confirming or invalidating the current technical and macro setup for wheat.📈 Technical Indicators Summary
RSI (14)
43.4
50-Day MA
$614.87
200-Day MA
$550.66
Fib Level
38.2%
📊 Technical Analysis Chart (18-Month View)
📐 Fibonacci Retracement Analysis
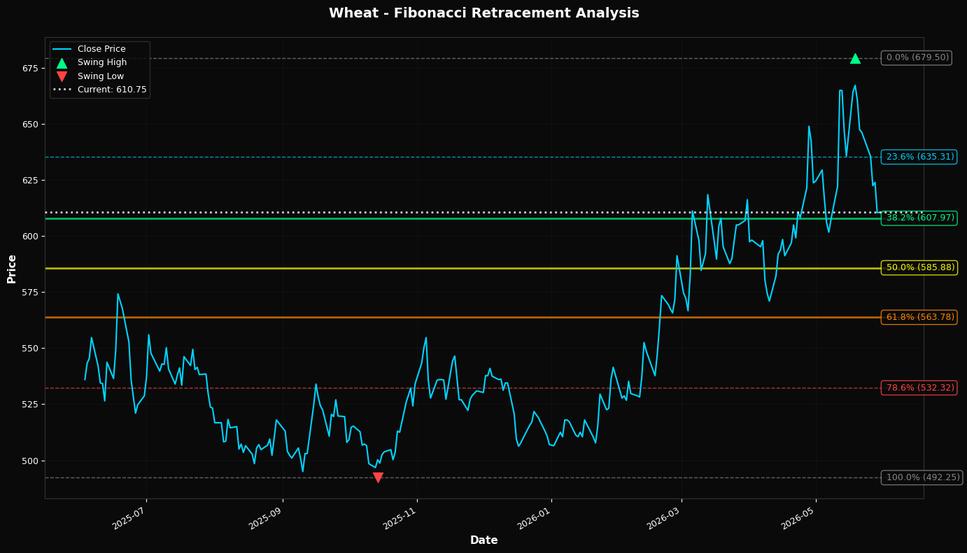
🎯 Key Trading Levels
Key Fibonacci Levels:
- 38.2%: $607.97
- 50.0%: $585.88
- 61.8%: $563.78
Support: $492.25 (Swing Low), $614.87 (50-Day MA)
Resistance: $679.50 (Swing High)
Disclaimer
The content on MarketsFN.com is provided for educational and informational purposes only. It does not constitute financial advice, investment recommendations, or trading guidance. All investments involve risks, and past performance does not guarantee future results. You are solely responsible for your investment decisions and should conduct independent research and consult a qualified financial advisor before acting. MarketsFN.com and its authors are not liable for any losses or damages arising from your use of this information.