The Nikkei225, officially known as the Nikkei Stock Average, is a prominent stock market index for the Tokyo Stock Exchange (TSE). Comprising 225 top-rated companies, it is a key indicator of Japan’s stock market performance and overall economic health. Launched in 1950, the Nikkei 225 is used globally to gauge the status of Japan’s industrial sector.
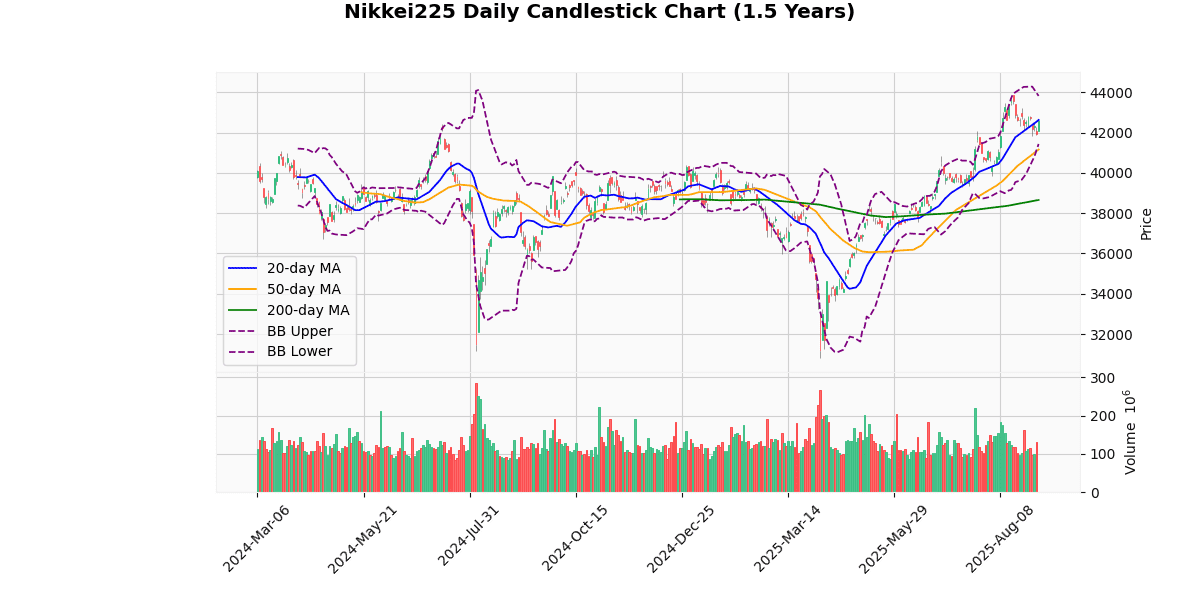
The Nikkei 225 index currently stands at 42,580.27, marking a 1.53% increase today. This performance places the index just below its 20-day moving average (MA20) of 42,629.04, indicating a slight short-term bearish signal, albeit minimal with a -0.11% difference. However, the index is well above its 50-day (MA50 at 41,159.75) and 200-day (MA200 at 38,656.57) moving averages, showing a robust upward trend in the medium to long term, with percentage differences of 3.45% and 10.15% respectively.
The Bollinger Bands reveal that the current price is nearing the middle band (same as MA20), with the upper band at 43,821.73 and the lower band at 41,436.35. The proximity to the middle band suggests a consolidation phase, with no immediate indication of high volatility as the price is not challenging either band extremity.
The Relative Strength Index (RSI) at 55.8 is neutral, indicating neither overbought nor oversold conditions, supporting the view of a balanced, albeit cautiously bullish market sentiment. The Moving Average Convergence Divergence (MACD) at 365.21 with a signal line at 532.84 shows a bearish crossover, suggesting potential downward momentum in the short term.
The index’s 3-day high and low are 42,608.8 and 41,863.2 respectively, showing recent trading in a relatively tight range, which is corroborated by the current Average True Range (ATR) of 554.59, indicating moderate daily price movement.
Year-to-date and 52-week metrics show the index is currently 2.95% below its high (43,876.42) but has significantly recovered from its lows (30,792.74), highlighting a strong bullish trend over the longer period.
In summary, the Nikkei 225 exhibits a stable upward trajectory with medium to long-term bullish signals, despite short-term bearish indicators from the MACD and proximity to the MA20.
## Technical Metrics
| Metric | Value |
|---|---|
| Current Price | 42580.3 |
| Today’s Change (%) | 1.53 |
| 20-day MA | 42629 |
| % from 20-day MA | -0.11 |
| 50-day MA | 41159.8 |
| % from 50-day MA | 3.45 |
| 200-day MA | 38656.6 |
| % from 200-day MA | 10.15 |
| Bollinger Upper | 43821.7 |
| % from BB Upper | -2.83 |
| Bollinger Lower | 41436.3 |
| % from BB Lower | 2.76 |
| RSI (14) | 55.8 |
| MACD | 365.21 |
| MACD Signal | 532.84 |
| 3-day High | 42608.8 |
| % from 3-day High | -0.07 |
| 3-day Low | 41863.2 |
| % from 3-day Low | 1.71 |
| 52-week High | 43876.4 |
| % from 52-week High | -2.95 |
| 52-week Low | 30792.7 |
| % from 52-week Low | 38.28 |
| YTD High | 43876.4 |
| % from YTD High | -2.95 |
| YTD Low | 30792.7 |
| % from YTD Low | 38.28 |
| ATR (14) | 554.59 |
The technical outlook for the Nikkei 225 index shows a moderately bullish sentiment as the index is trading close to its 20-day moving average (MA20) and above its longer-term moving averages (MA50 and MA200), indicating sustained upward momentum over the medium to long term. The current price is slightly below the MA20 but well above the MA50 and MA200, highlighting potential support levels if a pullback occurs.
The Bollinger Bands suggest that the index is trading near the middle band, with the current price not far from the upper Bollinger Band. This positioning indicates a relatively high level of volatility, as confirmed by the ATR of 554.59, suggesting significant daily price movements.
The Relative Strength Index (RSI) at 55.8 does not signal extreme conditions, positioning the market in a neutral to slightly bullish zone. However, the MACD below its signal line suggests some caution as it may indicate a potential slowdown in the bullish momentum.
Key support and resistance levels to watch include the recent 3-day low at 41863.2 and the 3-day high at 42608.8, respectively. A break beyond these levels could signal further directional movement. The proximity to the 52-week high also suggests that reaching new highs could encounter resistance.
Overall, market sentiment appears cautiously optimistic, with technical indicators supporting a continuation of the current trend, albeit with potential volatility. Investors should watch for any significant deviations from the moving averages or Bollinger Bands, which could indicate a shift in market dynamics.
