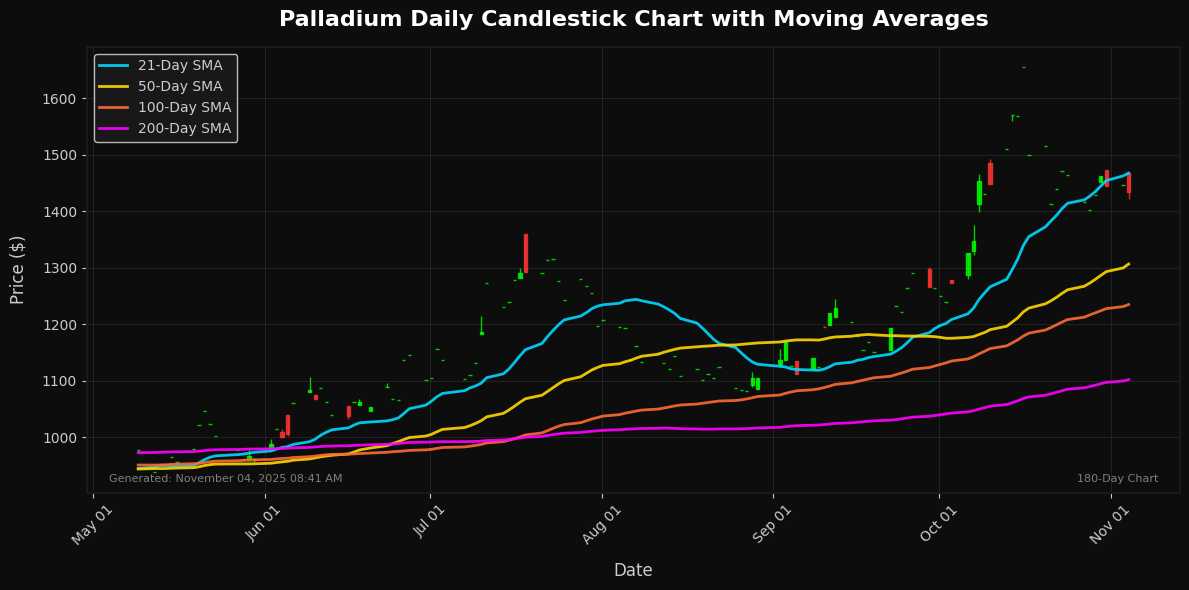
Precious Metals Update: Palladium Declines 1.51% – RSI at 53
📊 Market Overview
Report Date: November 04, 2025
| Metal | Price | Daily Change (%) | MA21 | MA50 | MA100 | MA200 | RSI | MACD |
|---|---|---|---|---|---|---|---|---|
| Gold | $4010.10 | -0.09% | $4071.17 | $3841.16 | $3595.13 | $3346.87 | 52.08 | 40.20 |
| Silver | $47.74 | -0.62% | $48.59 | $45.29 | $41.39 | $37.15 | 51.54 | 0.59 |
| Platinum | $1562.90 | -1.16% | $1608.96 | $1516.97 | $1438.05 | $1220.63 | 48.79 | 10.04 |
| Palladium | $1433.50 | -1.51% | $1467.54 | $1306.46 | $1234.90 | $1101.91 | 52.95 | 32.87 |
🔸 Gold
Technical Analysis
Gold is currently trading at $4010.10, reflecting a marginal daily decline of 0.09%. The price remains above short-term moving averages, with the 21-day MA at $4071.17 providing nearby resistance. Meanwhile, stronger support levels are identified at the 50-day MA of $3841.16 and longer-term MAs, notably the 100-day at $3595.13 and 200-day at $3346.87.
Momentum indicators show the RSI at 52.08, indicating neutral momentum, while the MACD at 40.20 suggests potential bullish momentum, albeit with caution given the lack of upward pressure in recent days. Overall, the market appears to be consolidating within this range. A break above the 21-day MA could signal a return to bullish sentiment, whereas a decline below the 50-day MA may suggest further downside risk. Traders should closely monitor these levels for potential entry or exit points.
🔸 Silver
Technical Analysis
As of the latest market data, silver is trading at $47.74, reflecting a daily change of -0.62%. The price remains above its 21-day moving average (MA21) of $48.59, suggesting short-term bullish momentum, although the proximity to this resistance level indicates a potential consolidation phase. The more significant moving averages—MA50 at $45.29, MA100 at $41.39, and MA200 at $37.15—illustrate a strong bullish trend over the medium to long term.
The Relative Strength Index (RSI) at 51.54 indicates neutral momentum, suggesting that silver is neither oversold nor overbought, allowing for further price exploration. The MACD signal of 0.59 indicates bullish momentum, although a crossover may be on the horizon, warranting vigilance from traders.
Overall, while silver remains in a strong uptrend, near-term resistance around MA21 at $48.59 could weigh on upward momentum,
🔸 Platinum
Technical Analysis
Platinum is currently priced at $1562.90, reflecting a daily decline of 1.16%. The recent price trend indicates a proximity to the 21-day moving average (MA21) of $1608.96, suggesting that the market is currently facing resistance at this level. Below, the MA50 at $1516.97 serves as a significant support level, while the MA100 and MA200 at $1438.05 and $1220.63, respectively, indicate a longer-term bullish outlook beneath the current price.
The Relative Strength Index (RSI) at 48.79 signals that platinum is trading in neutral territory, suggesting potential for either upward or downward movement. Meanwhile, the MACD value of 10.04 reflects positive momentum. Overall, the balance of indications suggests a cautious approach, with resistance at $1608.96 hindering immediate bullish prospects, while support at $1516.97 remains critical for sustaining the momentum. Traders should monitor these
🔸 Palladium
Technical Analysis
Palladium is currently priced at $1433.50, reflecting a daily decline of 1.51%. The moving averages indicate a bullish long-term outlook, with the MA21 ($1467.54) above both the MA50 ($1306.46) and MA100 ($1234.90), signaling potential resistance at the $1467.54 level. The MA200 ($1101.91) reinforces support for longer-term traders. The Relative Strength Index (RSI) is at 52.95, suggesting a neutral momentum, while the MACD at 32.87 indicates a positive trend, albeit one that is losing strength.
Traders should monitor the $1467 resistance closely; a break above could signal a renewed bullish trend, whereas a drop below the $1300 support level could trigger bearish sentiment. Overall, Palladium’s technical indicators suggest that while short-term volatility may persist, the longer-term outlook remains cautiously bullish provided critical support levels hold.
Disclaimer
The content on MarketsFN.com is provided for educational and informational purposes only. It does not constitute financial advice, investment recommendations, or trading guidance. All investments involve risks, and past performance does not guarantee future results. You are solely responsible for your investment decisions and should conduct independent research and consult a qualified financial advisor before acting. MarketsFN.com and its authors are not liable for any losses or damages arising from your use of this information.
