# RUSSELL2000 Technical Analysis Recap
The Russell 2000 Index is a prominent stock market index that tracks the performance of approximately 2,000 small-cap companies in the United States. It is widely regarded as a key barometer of the American small-cap sector, offering insights into the health and trends of smaller businesses that are often more responsive to domestic economic changes than their larger counterparts.
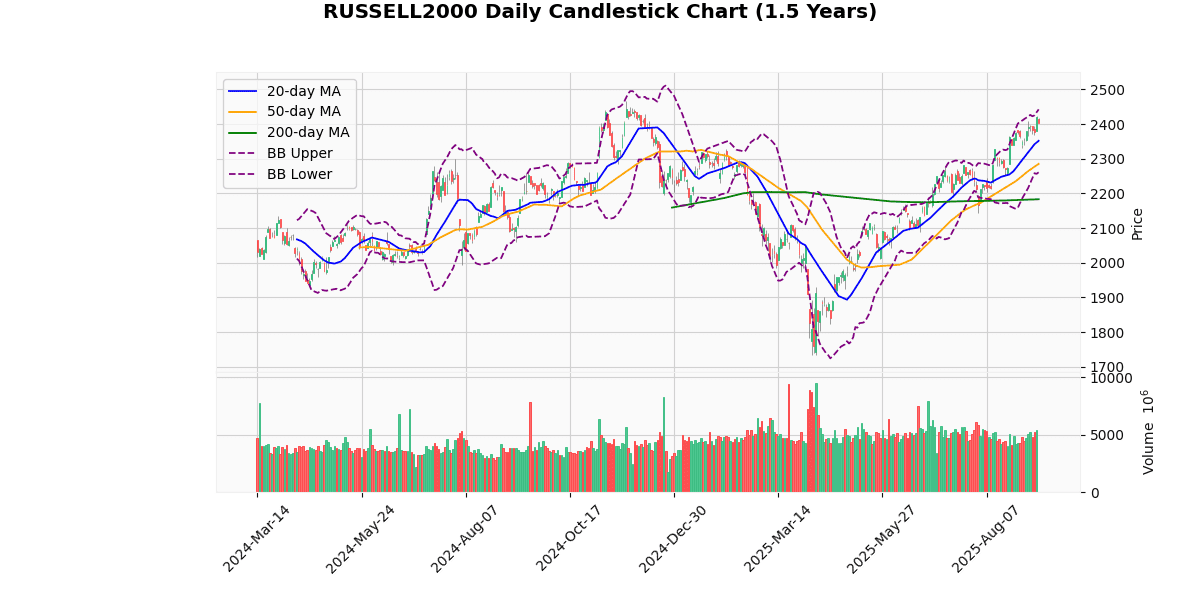
The Russell 2000 index currently stands at 2404.24, experiencing a slight decline today by 0.71%. The index is showing a bullish trend over the short to medium term, as indicated by its position above all key moving averages: 20-day (2351.64), 50-day (2285.13), and 200-day (2183.1). This upward trend is further supported by the fact that the index is trading 10.13% above its 200-day moving average, suggesting strong momentum.
The Bollinger Bands reveal that the index is trading near the upper band (2442.33), which typically signals a high level of volatility. The current price is closer to the upper band than the lower band (2260.94), indicating that the market might be in a potentially overbought state. However, the Relative Strength Index (RSI) at 63.96 is below the typical overbought threshold of 70, which might suggest there is still room for upward movement before the market becomes truly overbought.
The Moving Average Convergence Divergence (MACD) at 38.03 with a signal line at 36.63 shows a positive crossover, which is a bullish signal indicating that the index might continue to gain. This is corroborated by the index’s performance relative to its 3-day high (2422.33) and low (2369.01), showing recent resilience and a tendency to push towards higher price levels.
The Average True Range (ATR) stands at 29.85, pointing to a relatively high level of volatility in the index’s recent trading sessions. This could mean potential for significant price movements in the near term, either upwards or downwards.
In summary, the Russell 2000 is exhibiting strong bullish signals across several indicators, with the MACD and position relative to moving averages suggesting continued upward momentum. However, traders should watch the Bollinger Bands and RSI closely for signs of potential overbought conditions that could precede a pullback.
## Technical Chart

## Technical Metrics
| Metric | Value |
|---|---|
| Current Price | 2404.24 |
| Today’s Change (%) | -0.71 |
| 20-day MA | 2351.64 |
| % from 20-day MA | 2.24 |
| 50-day MA | 2285.13 |
| % from 50-day MA | 5.21 |
| 200-day MA | 2183.1 |
| % from 200-day MA | 10.13 |
| Bollinger Upper | 2442.33 |
| % from BB Upper | -1.56 |
| Bollinger Lower | 2260.94 |
| % from BB Lower | 6.34 |
| RSI (14) | 63.96 |
| MACD | 38.03 |
| MACD Signal | 36.63 |
| 3-day High | 2422.33 |
| % from 3-day High | -0.75 |
| 3-day Low | 2369.01 |
| % from 3-day Low | 1.49 |
| 52-week High | 2466.49 |
| % from 52-week High | -2.52 |
| 52-week Low | 1732.99 |
| % from 52-week Low | 38.73 |
| YTD High | 2422.33 |
| % from YTD High | -0.75 |
| YTD Low | 1732.99 |
| % from YTD Low | 38.73 |
| ATR (14) | 29.85 |
The technical outlook for the Russell 2000 index suggests a moderately bullish sentiment as indicated by its current price of 2404.24, which is above all key moving averages (MA20 at 2351.64, MA50 at 2285.13, and MA200 at 2183.1). This positioning above the moving averages highlights a strong upward trend over the short, medium, and long term.
The index is trading near the upper Bollinger Band (2442.33), suggesting that it is approaching overbought territory, although it has not breached this level. The Relative Strength Index (RSI) at 63.96 supports this, indicating momentum but still below the typical overbought threshold of 70. The MACD value at 38.03, above its signal line at 36.63, further confirms the bullish momentum.
Volatility, as measured by the Average True Range (ATR) of 29.85, points to moderate market fluctuations, which is consistent with the index’s recent price movements between its 3-day high of 2422.33 and low of 2369.01.
Potential resistance is likely near the recent YTD high of 2422.33 and could extend up to the 52-week high of 2466.49. Support might be found around the lower Bollinger Band at 2260.94 and further down at the MA200 level of 2183.1.
Overall, the Russell 2000’s current technical setup favors continued bullish behavior, though caution is warranted near resistance levels, where profit-taking might occur.
