Recent Price Action
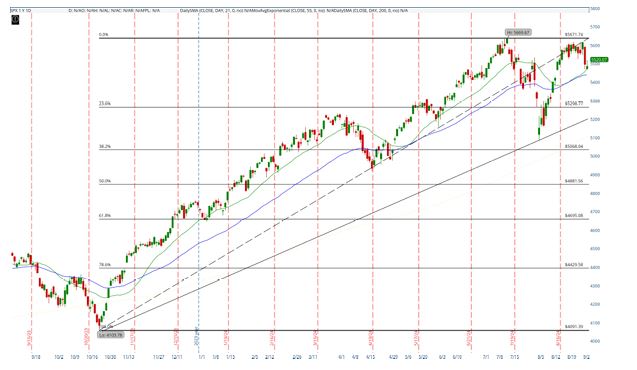
The S&P 500 Index (SPX) recently reached a high of 5,669.67 before encountering resistance and pulling back. The index is currently trading at 5,520.07, showing some consolidation just above the 23.6% Fibonacci retracement level, which is positioned at approximately 5,298.77. The recent price action indicates that the index is holding above this key Fibonacci level, with the 21-day Simple Moving Average (SMA) providing additional support around the 5,504.29 level. The pullback from the recent high suggests a pause in the bullish momentum, with the index now at a critical juncture where it must hold key support levels to avoid a deeper correction.
Large Trend
The broader trend for the S&P 500 remains bullish, as the index is trading well above the 200-day SMA, which is currently around 5,138.18. The uptrend that began in October 2022 has been characterized by a series of higher highs and higher lows, confirming the long-term bullish outlook. The index has respected the upward-sloping trendline drawn from the October lows, with recent price action showing that the 55-day Exponential Moving Average (EMA), currently at 5,473.97, is providing dynamic support during pullbacks.
The Fibonacci retracement levels drawn from the October 2022 lows to the recent high of 5,669.67 highlight key support zones. The 23.6% retracement level at 5,298.77 is the immediate support that the index is currently testing. Below this, the 38.2% retracement level at 5,068.04 and the 50% retracement level at 4,881.56 are significant support zones that could come into play if the index continues to decline.
Forecasts of Supports and Resistances
The S&P 500 index is at a critical support area around the 23.6% Fibonacci retracement level of 5,298.77. If the index manages to hold above this level and the 21-day SMA at 5,504.29, it could attempt to regain its upward momentum, with the next resistance level being the recent high at 5,669.67. A successful break above this high could open the door for a continuation of the uptrend, potentially targeting the 5,700 level or higher.
However, if the index fails to hold the 5,298.77 support level, it could lead to a deeper correction towards the 38.2% Fibonacci retracement level at 5,068.04. Below this, the 50% retracement level at 4,881.56, which coincides with the upward trendline and the 200-day SMA, would be a critical support area that could determine whether the long-term bullish trend remains intact.
Traders should monitor the index’s movement around these key levels closely. A bounce from the current support could signify a continuation of the bullish trend, while a break below could suggest that the market is entering a more significant corrective phase.
