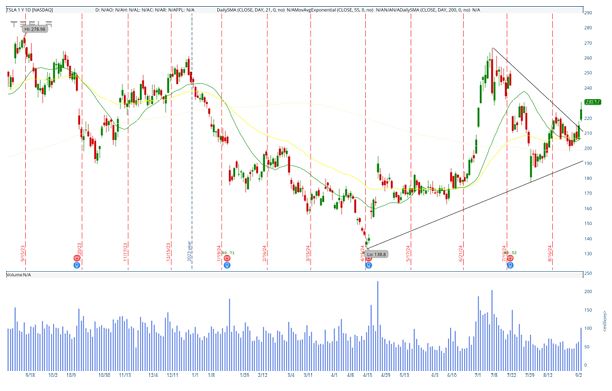
Tesla’s stock has shown promising technical developments, signaling potential for a bullish move in the near term. The recent price action displays a break above key levels that may suggest a shift in momentum for the electric vehicle giant.
A symmetrical triangle pattern has been forming on Tesla’s chart, which typically indicates a period of consolidation as traders wait for a significant move. In this case, the stock was compressed between lower highs and higher lows, forming a triangle over several weeks. What stands out now is the stock’s breakout from this formation. Tesla recently pushed above the descending trendline, a move that often signals the beginning of a new upward trend. This breakout is particularly notable because it was accompanied by a strong increase in volume, indicating robust buying interest. Volume plays a critical role in confirming such breakouts, as higher volume signifies stronger conviction among traders.
The stock’s moving averages further strengthen the bullish outlook. Tesla is currently trading above its 21-day simple moving average (SMA), a key indicator of short-term momentum. Additionally, the stock is holding above the 55-day exponential moving average (EMA), which reflects sustained strength beyond the immediate short term. More significantly, Tesla has crossed above its 200-day SMA, a long-term trend indicator that is closely watched by institutional investors. The 200-day moving average often serves as a line of demarcation between a stock being in a bull or bear market. Tesla’s ability to hold above this level is a positive signal that could attract more buyers, especially those waiting for confirmation of a long-term trend shift.
In terms of volume, the recent spike during the breakout adds further validation to the move. When a stock breaks through key technical levels on increasing volume, it often means the move is more likely to be sustained. Higher volume on up days suggests that there is significant demand for Tesla shares, which could push the price higher in the coming sessions.
However, Tesla does face some resistance. The $230-$240 range has been a key area where the stock has struggled to break through in the past. This zone aligns with previous consolidation periods and represents a psychological barrier for traders. If Tesla can clear this resistance level, it would signal further upside potential. On the flip side, the 200-day SMA, now acting as support at $202.85, is a critical level to watch in case of a pullback. A successful retest of this level would confirm its new role as support, potentially setting up Tesla for another leg higher.
Additionally, the stock’s moving averages are displaying a bullish crossover pattern. The 21-day SMA has moved above the 55-day EMA, a technical signal often used by traders to confirm a change in trend direction. As long as the price remains above these moving averages, the bullish trend is likely to persist.
In conclusion, Tesla’s recent price action suggests a bullish breakout from a key technical pattern, supported by increasing volume and positive movement in key moving averages. The breach of the 200-day SMA is particularly encouraging for long-term investors. However, Tesla still faces resistance around the $230-$240 level, which could serve as a short-term hurdle. If the stock manages to overcome this resistance, we could see further upside. Traders should watch the 200-day SMA for any signs of a pullback, as this level now serves as critical support in Tesla’s renewed upward trajectory
