Apple Inc. (Nasdaq: AAPL)shares fell 3.6% on Monday morning following reports of weaker-than-expected demand for the new iPhone 16, with first-weekend sales down 12% compared to the iPhone 15, according to TF Securities analyst Ming-Chi Kuo. Kuo attributed the decline to lower demand for the iPhone 16 Pro series, partially due to the delayed release of the Apple Intelligence feature, which will launch in beta next month. Intense competition in China also contributed to the softer demand. Other analysts from Barclays, JPMorgan, and Bank of America echoed concerns, noting that longer shipping times may indicate lighter demand for the new Pro models compared to last year.
Here’s a technical analysis for Apple Inc. (AAPL),
Trendlines:
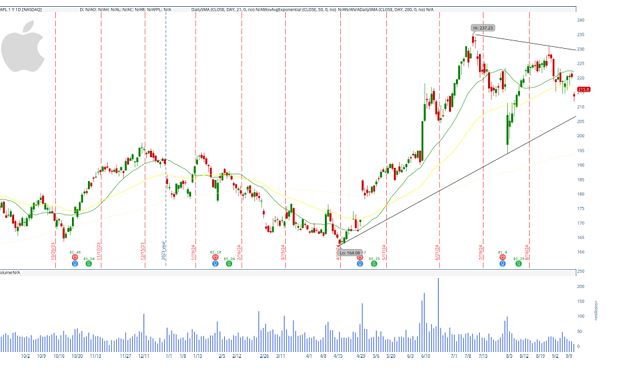
- Ascending Trendline: A clear upward-sloping trendline is visible, drawn from the lows in early April through September 2024, suggesting that the stock remains in an overall uptrend despite recent weakness.
- Descending Trendline: There is also a descending resistance trendline connecting the highs in July to September 2024, forming a broadening wedge pattern (sometimes called a megaphone pattern). This pattern indicates increased volatility and uncertainty in the market.
Simple Moving Averages (SMAs):
- SMA 20 (Short-Term): The price is currently trading below the 20-day moving average (green line), which is a bearish signal for short-term momentum.
- SMA 50 (Mid-Term): The stock is also trading below the 50-day SMA (yellow line), adding further bearishness in the medium term.
- SMA 200 (Long-Term): AAPL remains above the 200-day moving average (red line), which is a bullish signal indicating the stock is still in a long-term uptrend despite short-term weakness.
Support and Resistance:
- Support Levels:
- The chart shows a support level around the $215 region, which is near the current price. This level has been tested recently and seems to be providing temporary support.
- Below this, the next significant support level is around $210, which coincides with the ascending trendline from the earlier lows in 2023.
- Resistance Levels:
- The upper boundary of the broadening wedge near $230 represents a strong resistance zone. A breakout above this could trigger more upside momentum.
- Another resistance lies at around $225, the recent highs from mid-August.
Volume Analysis:
- Volume is relatively light in the recent price action compared to the earlier months of 2024, indicating that the selling pressure may not be as intense as it looks. However, declining volume in a downtrend can sometimes signal a lack of buyer interest, which could lead to further declines.
Candlestick Patterns:
- There is no strong reversal candlestick pattern visible at the moment. Recent price action shows small-bodied candles, which indicates indecision. This could suggest that the stock is in a consolidation phase before it chooses its next direction.
Price Action:
- The recent price drop of -3.03% (-6.75 points) on Sept 16 suggests bearish sentiment. This is reinforced by the stock trading below both the 20-day and 50-day moving averages, signaling a potential continuation of short-term weakness.
- A decisive move below the $215 support level could lead to further downside, potentially testing the $210 support.
Patterns:
- Broadening Wedge: This pattern, where both resistance and support levels diverge, typically indicates increased volatility and indecision. A breakout in either direction (above $230 for bullish, below $215 for bearish) could indicate the next strong move.
Summary:
- Short-Term Bearish: The stock is trading below its 20-day and 50-day moving averages, suggesting short-term weakness. The price is near a key support level ($215), and a break below could lead to further downside.
- Long-Term Bullish: AAPL remains above the 200-day SMA, indicating it is still in a long-term uptrend.
- Key Levels: Watch for support at $215 and resistance at $230. A break of these levels could define the next significant move.
