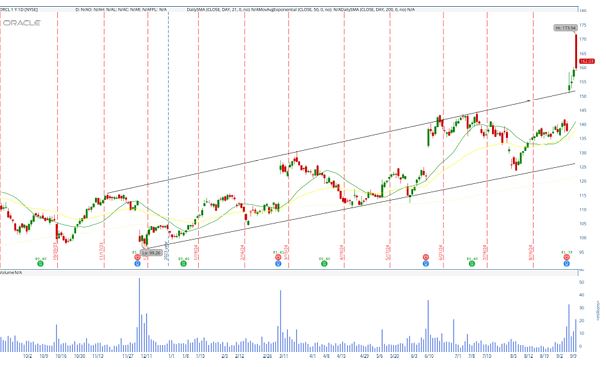
The stock chart for Oracle Corporation (ORCL) shows the following key technical indicators and patterns:
Recent Price Action:
- The stock closed at $162.03 on September 13, 2024, with a 0.40% gain on the day.
- The chart indicates a sharp upward movement in recent days, with the price reaching as high as $173.70 before closing lower at $162.03, suggesting some profit-taking or selling pressure at the higher levels.
Key Moving Averages:
- 20-day Simple Moving Average (SMA) (in orange): Positioned below the price, indicating short-term bullish momentum.
- 50-day Simple Moving Average (SMA) (in red): Also below the current price, reinforcing the strength of the recent uptrend.
- 200-day Simple Moving Average (SMA) (in blue): Well below the price, reflecting the stock’s long-term strength and overall bullish trend over the past year.
Volume Analysis:
- There is a significant spike in volume during the latest price rise, which often signals strong buying interest. However, the large range in the day’s price suggests potential volatility, with traders either accumulating positions or locking in profits.
Trendlines:
- The price action appears to respect a rising trendline starting from the lows around January and continuing through most of 2024. This upward trendline indicates consistent demand and bullish sentiment.
- A second trendline above the price seems to act as resistance, which was briefly breached during the recent rally, suggesting potential for further upward movement if the price breaks through this level decisively.
Support and Resistance:
- Support: The most immediate support lies near the $150 level, which has served as previous resistance in late August. Additionally, the 50-day and 200-day moving averages around $140 and $130, respectively, provide further support levels.
- Resistance: The next resistance level appears near $170-$175, where the stock briefly touched and then pulled back. If the price can break and hold above this level, it may signal a continuation of the strong uptrend.
Candlestick Pattern:
- The current candle indicates a long upper shadow, suggesting that while the stock reached new highs intraday, there was significant selling pressure that pushed the price back down before close. This could indicate caution among traders, as some may expect a short-term pullback after the rapid price increase.
Gaps and Exhaustion:
- There appears to be a potential gap in price over the past few days, which could either be a breakaway gap signaling further continuation, or an exhaustion gap if the momentum slows down. This gap needs to be monitored closely as gaps often get filled in the near term.
Volume and Market Sentiment:
- The sharp increase in volume accompanying the recent price spike shows strong market participation, often associated with significant news or earnings releases. This suggests heightened interest in the stock, though the volatility could also lead to near-term consolidation.
Summary:
Oracle Corporation’s stock is in a strong uptrend, supported by rising moving averages and strong volume. The stock is testing a key resistance level around $170, and a breakout above this level could signal further gains. However, the long upper wick on the recent candle suggests potential caution, as profit-taking may occur after the strong rally. Key support levels to watch are near $150 and $140, where the 50-day SMA offers additional support.
Traders should monitor whether the stock can break through the $170-$175 resistance area with sustained volume to confirm a continued upward trend or if a short-term pullback is likely.
