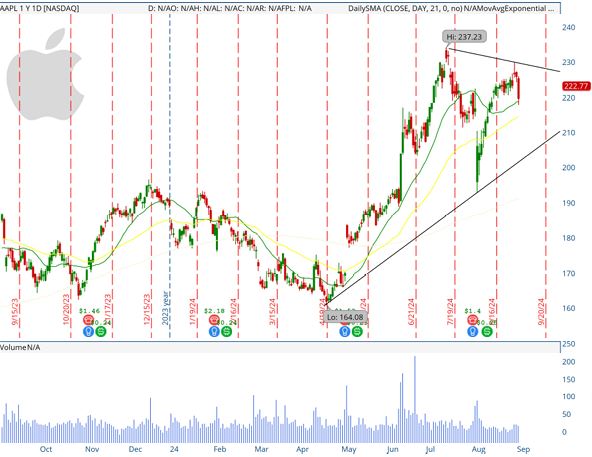
Apple Inc. (AAPL) has recently experienced a decline in its stock price, closing at $222.77 on September 3rd, down by 2.72% for the day. The stock’s recent performance indicates some weakness after attempting to hold above the $230 level. The volume during this decline has been moderate, suggesting that while there is selling pressure, it is not accompanied by panic selling. The price has now dropped below the 20-day Simple Moving Average (SMA), which often acts as a short-term resistance level. This suggests that the bullish momentum seen over the past couple of months is waning. The candlestick pattern formed on the latest trading day resembles a bearish engulfing or a significant down day, which indicates that sellers may be starting to dominate.
Large Trend
In the larger context, AAPL has been in a strong uptrend since late May 2024, as indicated by the rising trendline and the series of higher highs and higher lows. This uptrend has been supported by the 50-day SMA, which the stock has respected since it broke above it in early June. The stock also remains well above the 200-day SMA, underscoring the strength of the long-term bullish trend. However, there are signs that this uptrend is facing some challenges. The stock reached a peak around $240 in July, forming a potential resistance area, and has since struggled to make new highs. The downward sloping resistance line from this peak suggests that the momentum is slowing, and the stock may be entering a consolidation phase or even facing a potential reversal if the support levels do not hold.
Forecasts of Supports and Resistances
AAPL’s chart presents a mixed outlook. The recent price action, particularly the drop below the 20-day SMA, suggests that the stock might face further downside in the short term. If the price fails to recover quickly and continues to decline, the next major support level to watch would be around $215, which coincides with the 50-day SMA and has acted as support in the past. A breach of this level could lead to a more significant decline towards $200, where the long-term upward trendline intersects, providing a crucial support area. On the upside, if AAPL can regain strength and break above the $230 level, it would likely face resistance around $240, the recent high and the descending trendline. A break above this resistance could signal a resumption of the uptrend, with potential targets at $250 or higher. However, given the current momentum, the $215 support level will be critical in determining the stock’s next move. Traders should monitor how AAPL performs around this level to gauge whether the recent pullback is a temporary correction or the beginning of a more extended downturn.
