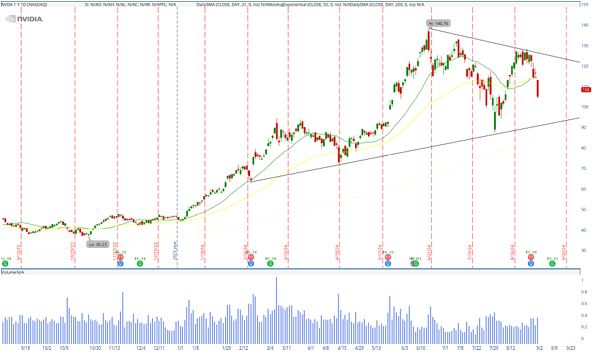
NVIDIA Corp (NVDA) has continued to exhibit significant bearish pressure in its latest trading session, as evidenced by the updated daily chart. The stock closed at $108.00 on September 3rd, marking a decline of 9.53% for the day. This sharp drop occurred with a substantial increase in trading volume, signaling strong selling activity. The stock has decisively fallen below the 20-day Simple Moving Average (SMA), a level that often acts as a short-term resistance. The chart now shows the continuation of a bearish engulfing pattern, where the most recent candlestick completely engulfs the previous day’s range, further solidifying the bearish sentiment. The stock is teetering on the edge of the crucial $108 support level, a key area that has held up multiple times in the past, but is now under serious threat.
Large Trend
Over the past several months, NVDA has been in a pronounced uptrend, characterized by higher highs and higher lows, which has been supported by a rising trendline that started around March 2024. This trendline has provided reliable support during minor pullbacks. However, the updated chart indicates that the stock is now struggling to maintain this uptrend. The formation of a descending trendline from the peak near $140 in July suggests that NVDA is facing increasing downward pressure, with lower highs indicating a shift in momentum. The stock remains above the 200-day SMA, indicating that the long-term trend is still intact, but the proximity of the price to this level suggests that any further decline could jeopardize the broader bullish outlook. The 50-day SMA is now being tested, and its breach could signal a more substantial correction.
Forecasts of Supports and Resistances
The updated chart of NVDA presents a challenging outlook for the stock. The recent price action, marked by a significant drop and a bearish engulfing candle, points to continued weakness. If the stock fails to hold the $108 support level, which aligns with both the neckline of a potential double top pattern and previous lows, it could trigger further selling pressure, pushing the price towards the $100 level. This level serves as a strong psychological support and also corresponds with the low from June 2024. Below this, the next major support would be around $90, near the 200-day SMA, which could serve as a long-term support zone. On the upside, if NVDA manages to stabilize and rebound from the current level, it would face immediate resistance around $116, the point of the recent high. A move above this could see the stock challenge the $120 resistance area, where the descending trendline and the 20-day SMA converge. However, the bearish momentum suggests that any rally might be short-lived unless the stock can reclaim and hold these resistance levels convincingly. Traders should closely monitor the $108 level, as its breach or hold will likely dictate the stock’s next significant move.
