Bitcoin Dips Below $63K as RSI Nears Oversold Zone
· Crypto · QuoteReporter
Bitcoin Dips Below $63K as RSI Nears Oversold Zone
Bitcoin (BTC/USD) | July 06, 2026 $62,828.6992 -1.13%
🔍 Technical Analysis
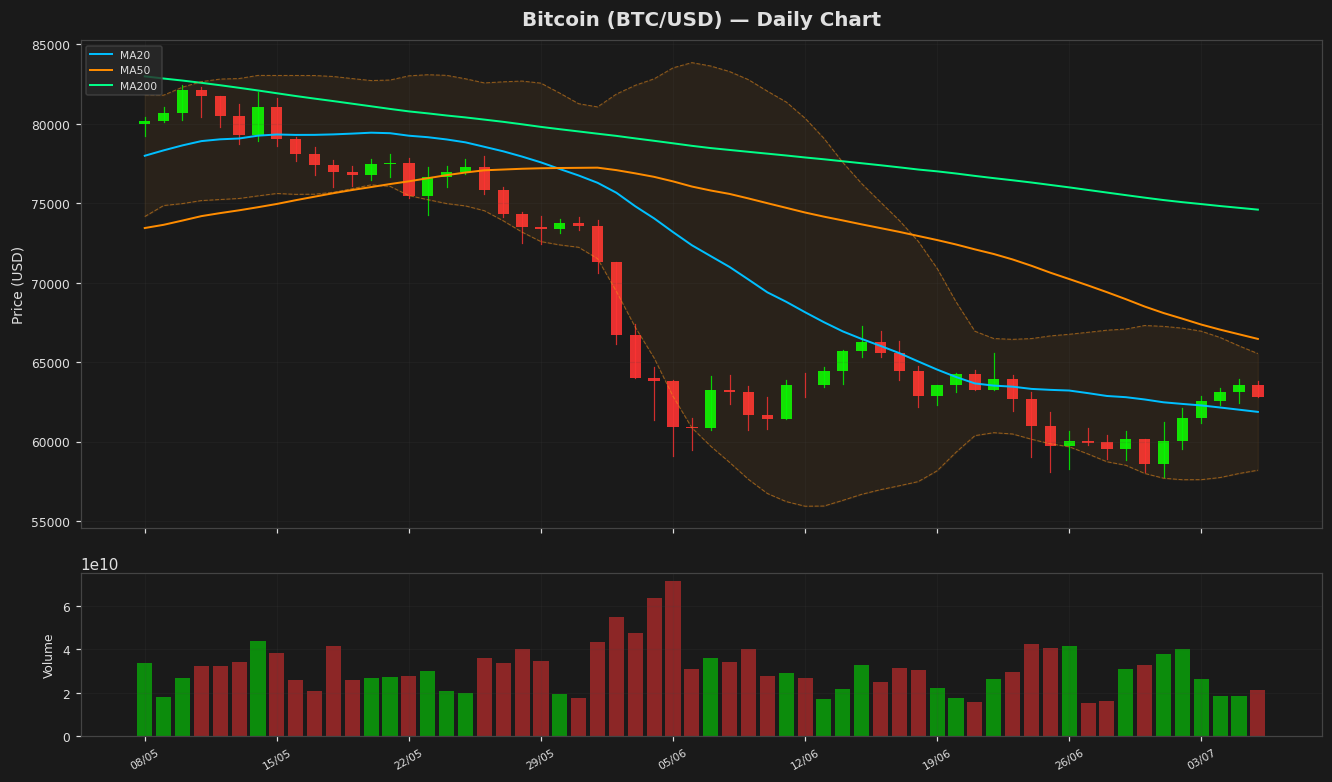
Bitcoin is currently trading at $62,828, showing a slight daily decline of 1.13%. The price remains below the 20-day moving average (MA20) at $61,867, indicating short-term bearish pressure, while the 50-day MA ($66,461) and 200-day MA ($74,600) suggest a broader downtrend. Bollinger Bands reveal tightening volatility, with the upper band at $65,540 and the lower band at $58,195, suggesting potential consolidation or a breakout soon. The RSI at 45.64 reflects neutral momentum, neither oversold nor overbought. The MACD histogram shows a bearish crossover, with the MACD line (-1047) below the signal line (-1703), reinforcing downside momentum. Key support levels are found near $58,195 (Bollinger lower band) and the 52-week low at $57,747, while resistance lies at the MA20 ($61,867) and the upper Bollinger Band ($65,540). The 52-week high at $116,078 highlights the significant retracement from all-time highs, with the YTD range between $57,747 and $97,860. The ATR (2176) indicates moderate volatility, suggesting cautious trading. Bitcoin’s current technical posture leans bearish, but a break above MA20 could signal a short-term recovery.
Technical Metrics
| Metric | Value |
|---|---|
| Current Price | $62,828.6992 |
| Daily Change | -1.13% |
| MA 20 | $61,867.7076 |
| % from MA20 | +1.55% |
| MA 50 | $66,461.4326 |
| % from MA50 | -5.47% |
| MA 200 | $74,600.3896 |
| % from MA200 | -15.78% |
| BB Upper | $65,540.3417 |
| % from BB Upper | -4.14% |
| BB Lower | $58,195.0735 |
| % from BB Lower | +7.96% |
| RSI (14) | 45.65 |
| MACD | -1047.464835 |
| MACD Signal | -1702.967596 |
| ATR (14) | 2176.898438 |
| 3-Day High | $63,935.8477 |
| 3-Day Low | $62,287.5859 |
| 52-Week High | $116,078.9844 |
| % from 52W High | -45.87% |
| 52-Week Low | $57,747.7656 |
| % from 52W Low | +8.80% |
| YTD High | $97,860.6016 |
| % from YTD High | -35.80% |
| YTD Low | $57,747.7656 |
| % from YTD Low | +8.80% |
📊 Market Commentary
Bitcoin (BTC) is currently trading at $62,828.69, down 1.13% today, as the market shows signs of consolidation following recent volatility. The Relative Strength Index (RSI) at 45.6 suggests neutral momentum, neither overbought nor oversold, indicating a balanced tug-of-war between buyers and sellers. Over the past 52 weeks, Bitcoin has ranged between $57,747.76 and $116,078.98, reflecting the broader crypto market’s recovery from the 2022 bear market and subsequent fluctuations in 2023.
Market sentiment remains cautious as traders monitor macroeconomic factors, including Fed policy expectations and institutional demand through spot Bitcoin ETFs. The $60,000 level is a critical psychological and technical support zone; a sustained break below could signal further downside toward the yearly low near $57,747. Conversely, resistance is seen around $65,000, where previous rallies have stalled.
Traders are also watching on-chain metrics, such as exchange flows and whale activity, for signs of accumulation or distribution. The recent dip in price has not yet triggered panic selling, suggesting holders remain resilient. However, low trading volumes indicate a lack of strong conviction in either direction. For now, Bitcoin appears range-bound, with the market awaiting clearer signals from macroeconomic developments or shifts in institutional interest to determine its next major move.
Market sentiment remains cautious as traders monitor macroeconomic factors, including Fed policy expectations and institutional demand through spot Bitcoin ETFs. The $60,000 level is a critical psychological and technical support zone; a sustained break below could signal further downside toward the yearly low near $57,747. Conversely, resistance is seen around $65,000, where previous rallies have stalled.
Traders are also watching on-chain metrics, such as exchange flows and whale activity, for signs of accumulation or distribution. The recent dip in price has not yet triggered panic selling, suggesting holders remain resilient. However, low trading volumes indicate a lack of strong conviction in either direction. For now, Bitcoin appears range-bound, with the market awaiting clearer signals from macroeconomic developments or shifts in institutional interest to determine its next major move.
Disclaimer
The content on MarketsFN.com is provided for educational and informational purposes only. It does not constitute financial advice or investment recommendations. All investments involve risk. Cryptocurrency markets are highly volatile. Past performance does not guarantee future results.