BNB at $546.64: Oversold RSI Signals Potential Rebound Ahead
· Crypto · QuoteReporter
BNB at $546.64: Oversold RSI Signals Potential Rebound Ahead
BNB (BNB/USD) | July 01, 2026 $546.6400 +0.17%
🔍 Technical Analysis
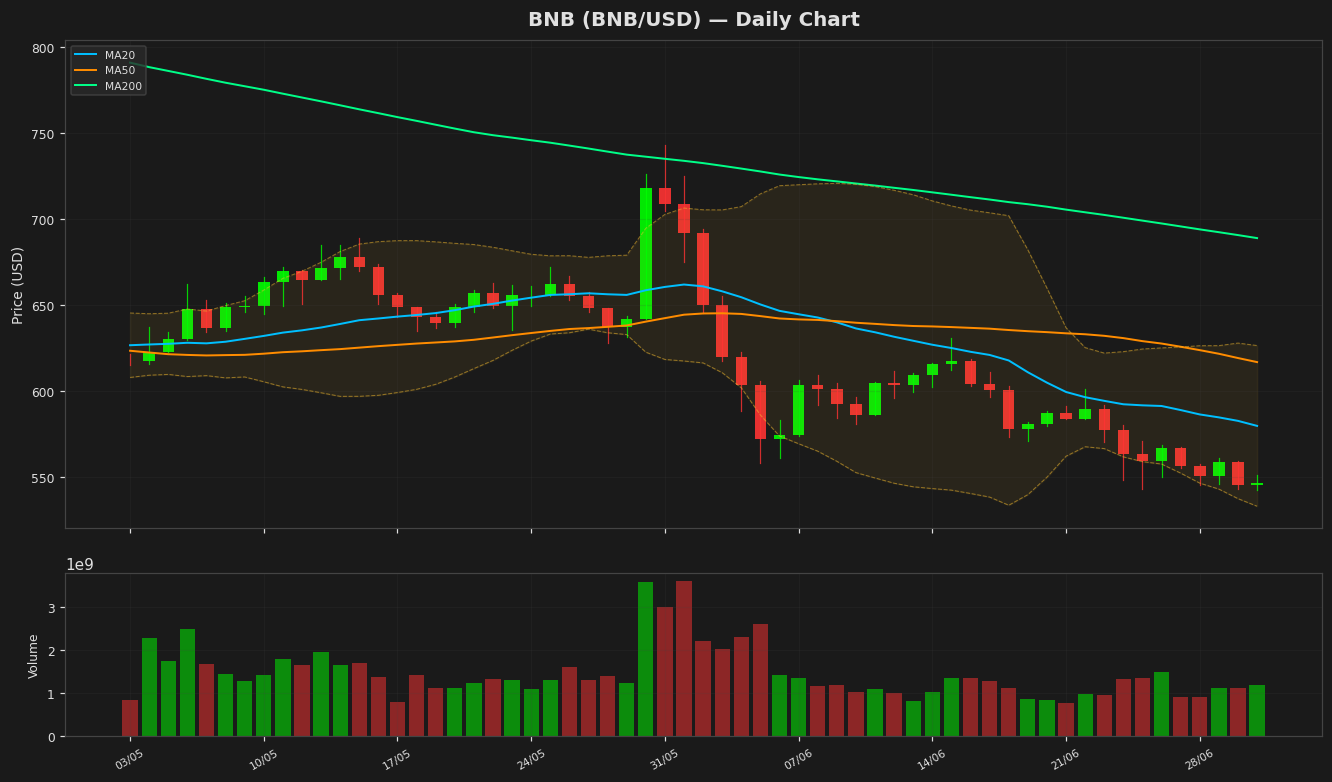
BNB is currently trading at $546.64, showing minimal daily gains of 0.17%, while remaining under significant bearish pressure. The price is below all key moving averages—MA20 ($579.92), MA50 ($616.99), and MA200 ($689.03)—confirming a strong downtrend. The Bollinger Bands indicate heightened volatility, with the upper band at $626.59 and the lower band at $533.25. Price action near the lower band suggests potential oversold conditions, though a sustained break below could trigger further downside. The RSI at 26.95 is deeply oversold, hinting at a possible short-term rebound, but the weak MACD histogram (-18.81) below the signal line (-16.99) reinforces bearish momentum.
Key support lies at the yearly low of $542.42, a critical level to monitor for breakdowns. A breach here may accelerate selling toward $500. Immediate resistance is at the MA20 ($579.92), followed by the MA50 ($616.99). The 52-week high of $1,180.01 underscores the steep decline from peak levels, while the YTD high of $954.86 highlights persistent selling pressure in 2024. The ATR (14) at 17.07 reflects moderate volatility, suggesting cautious trading near support. A bullish reversal would require reclaiming the MA20 and RSI recovery above 30, but current indicators favor bearish continuation unless momentum shifts.
Key support lies at the yearly low of $542.42, a critical level to monitor for breakdowns. A breach here may accelerate selling toward $500. Immediate resistance is at the MA20 ($579.92), followed by the MA50 ($616.99). The 52-week high of $1,180.01 underscores the steep decline from peak levels, while the YTD high of $954.86 highlights persistent selling pressure in 2024. The ATR (14) at 17.07 reflects moderate volatility, suggesting cautious trading near support. A bullish reversal would require reclaiming the MA20 and RSI recovery above 30, but current indicators favor bearish continuation unless momentum shifts.
Technical Metrics
| Metric | Value |
|---|---|
| Current Price | $546.6400 |
| Daily Change | +0.17% |
| MA 20 | $579.9219 |
| % from MA20 | -5.74% |
| MA 50 | $616.9866 |
| % from MA50 | -11.40% |
| MA 200 | $689.0271 |
| % from MA200 | -20.66% |
| BB Upper | $626.5939 |
| % from BB Upper | -12.76% |
| BB Lower | $533.2500 |
| % from BB Lower | +2.51% |
| RSI (14) | 26.95 |
| MACD | -18.813269 |
| MACD Signal | -16.991630 |
| ATR (14) | 17.074594 |
| 3-Day High | $561.3637 |
| 3-Day Low | $542.4232 |
| 52-Week High | $1,180.0149 |
| % from 52W High | -53.68% |
| 52-Week Low | $542.4232 |
| % from 52W Low | +0.78% |
| YTD High | $954.8583 |
| % from YTD High | -42.75% |
| YTD Low | $542.4232 |
| % from YTD Low | +0.78% |
📊 Market Commentary
BNB is trading at $546.64, showing a slight uptick of 0.17% today amid broader market uncertainty. The token remains near the lower end of its 52-week range ($542.42 – $1,180.01), reflecting sustained bearish pressure. The RSI at 26.9 indicates oversold conditions, which could signal potential for a short-term rebound, though sentiment remains cautious as traders await clearer directional cues.
Market sentiment around BNB is mixed. While the oversold RSI suggests some traders may look for buying opportunities, the lack of strong bullish momentum keeps the broader trend neutral to bearish. Key support at $542.42—the 52-week low—is being closely watched; a sustained break below could trigger further downside. On the upside, resistance near $600 remains a psychological hurdle, with stronger selling pressure likely to emerge near this level.
Traders are monitoring broader crypto market trends, particularly Bitcoin’s performance, as well as developments within the Binance ecosystem, including regulatory updates and platform activity. The current low volatility suggests a period of consolidation, but any significant market-moving news could shift sentiment quickly. Given the oversold RSI, short-term traders may watch for a technical bounce, while longer-term investors remain cautious until stronger bullish confirmation appears. Liquidity levels and order book depth around key price zones will also influence near-term price action.
Disclaimer
The content on MarketsFN.com is provided for educational and informational purposes only. It does not constitute financial advice or investment recommendations. All investments involve risk. Cryptocurrency markets are highly volatile. Past performance does not guarantee future results.