Solana Eyes $80 as RSI Nears Bullish Zone, Up 2.27% Today
· Crypto · QuoteReporter
Solana Eyes $80 as RSI Nears Bullish Zone, Up 2.27% Today
Solana (SOL/USD) | July 01, 2026 $75.1900 +2.27%
🔍 Technical Analysis
### Technical Analysis: Solana (SOL)
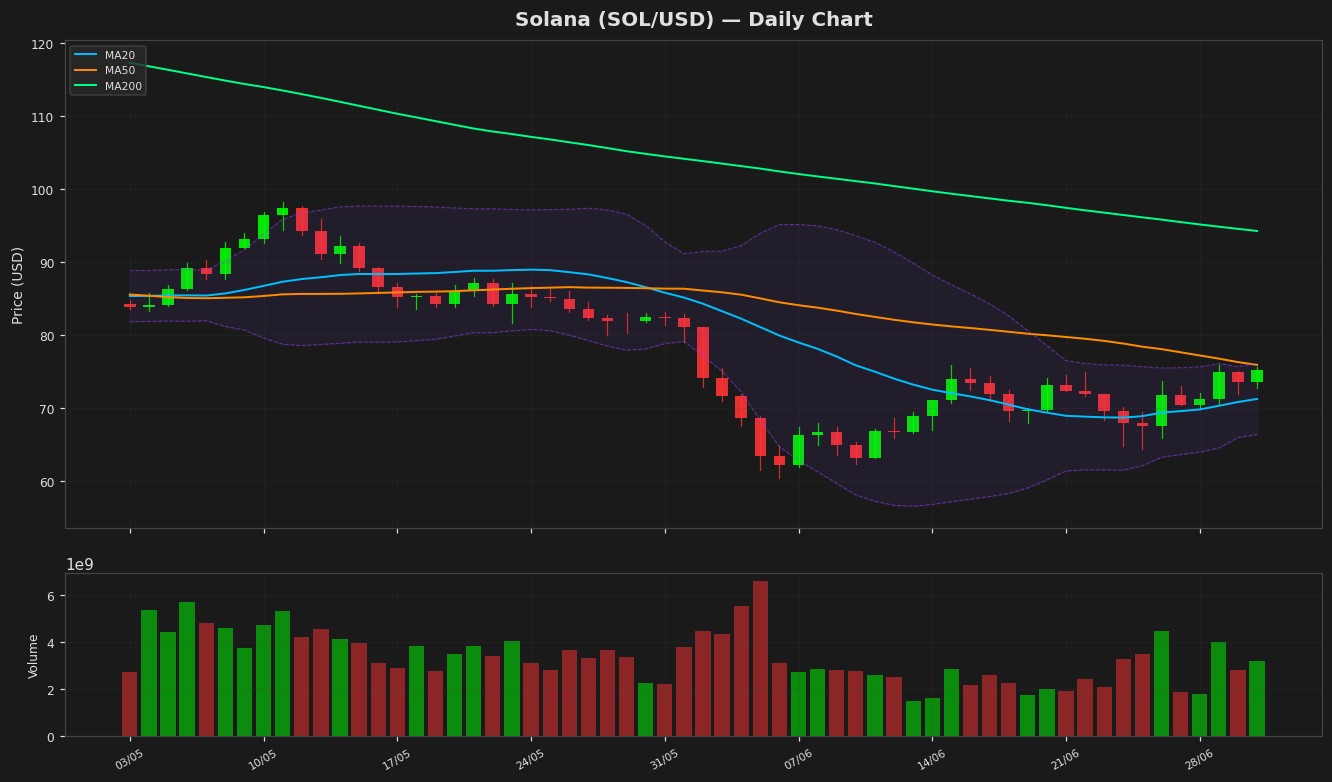
Solana (SOL) is currently trading at **$75.19**, up **2.27%** on the day, showing bullish momentum. The price remains above the **20-day moving average (MA20) at $71.27**, indicating short-term strength, but below the **50-day MA ($75.93)**, suggesting consolidation near this resistance. The **200-day MA ($94.25)** looms as a key long-term resistance level, reinforcing the broader downtrend from 2023 highs.
Bollinger Bands show a tightening range, with the upper band at **$76.11** and the lower band at **$66.43**. The price hovering near the upper band signals potential overbought conditions, but a breakout above **$76.11** could confirm further upside.
The **RSI (14) at 56.58** is neutral, neither overbought nor oversold, allowing room for continued movement in either direction. The **MACD (-0.288) remains below its signal line (-1.250)**, indicating lingering bearish momentum, though the histogram shows slight convergence, hinting at a possible reversal.
Key support lies at **$66.43 (Bollinger lower band)**, followed by the **52-week low at $60.41**. Resistance is at **$76.11 (upper Bollinger band)**, with a break potentially targeting **$94.25 (200-day MA)**. The **52-week high at $205.02** remains a distant psychological barrier.
Given the mixed signals, traders should watch for a confirmed breakout above **$76.11** or a rejection leading to a retest of **$71.27 (MA20)**. The **ATR (14) at 3.89** suggests moderate volatility, reinforcing cautious positioning.
Technical Metrics
| Metric | Value |
|---|---|
| Current Price | $75.1900 |
| Daily Change | +2.27% |
| MA 20 | $71.2689 |
| % from MA20 | +5.50% |
| MA 50 | $75.9292 |
| % from MA50 | -0.97% |
| MA 200 | $94.2475 |
| % from MA200 | -20.22% |
| BB Upper | $76.1062 |
| % from BB Upper | -1.20% |
| BB Lower | $66.4315 |
| % from BB Lower | +13.18% |
| RSI (14) | 56.58 |
| MACD | -0.288080 |
| MACD Signal | -1.250453 |
| ATR (14) | 3.885323 |
| 3-Day High | $75.9202 |
| 3-Day Low | $70.5091 |
| 52-Week High | $205.0201 |
| % from 52W High | -63.33% |
| 52-Week Low | $60.4147 |
| % from 52W Low | +24.46% |
| YTD High | $148.2160 |
| % from YTD High | -49.27% |
| YTD Low | $60.4147 |
| % from YTD Low | +24.46% |
📊 Market Commentary
**Solana (SOL) Market Commentary**
Solana (SOL) is trading at $75.19, up 2.27% today, showing moderate bullish momentum as it holds above key support levels. The Relative Strength Index (RSI) at 56.6 suggests neutral conditions, neither overbought nor oversold, allowing room for further movement in either direction. Over the past 52 weeks, SOL has ranged between $60.41 and $205.02, with current prices sitting near the lower half of this range, reflecting a cautious but improving sentiment.
Market sentiment around Solana remains mixed but cautiously optimistic. Recent network upgrades and strong developer activity continue to support its long-term viability, though macroeconomic uncertainty and broader crypto market trends weigh on short-term price action. Traders are closely watching the $70 support level, which has held firm in recent weeks, while resistance near $80 remains a key hurdle. A sustained break above $80 could signal stronger bullish momentum, while a drop below $70 may invite further downside pressure.
Volume has been steady but not exceptional, indicating a lack of strong directional conviction among traders. Institutional interest and on-chain metrics, such as active addresses and DeFi TVL, are being monitored for signs of renewed demand. With Bitcoin and Ethereum influencing broader market trends, SOL’s near-term trajectory will likely depend on overall crypto market sentiment. For now, traders remain watchful for a decisive breakout or breakdown from the current range.
Disclaimer
The content on MarketsFN.com is provided for educational and informational purposes only. It does not constitute financial advice or investment recommendations. All investments involve risk. Cryptocurrency markets are highly volatile. Past performance does not guarantee future results.