Dogecoin at Extreme RSI 8.5: Rebound or Further Drop Ahead?
· Crypto · QuoteReporter
Dogecoin at Extreme RSI 8.5: Rebound or Further Drop Ahead?
Dogecoin (DOGE/USD) | July 01, 2026 $0.0714 -0.84%
🔍 Technical Analysis
### Dogecoin (DOGE) Technical Analysis
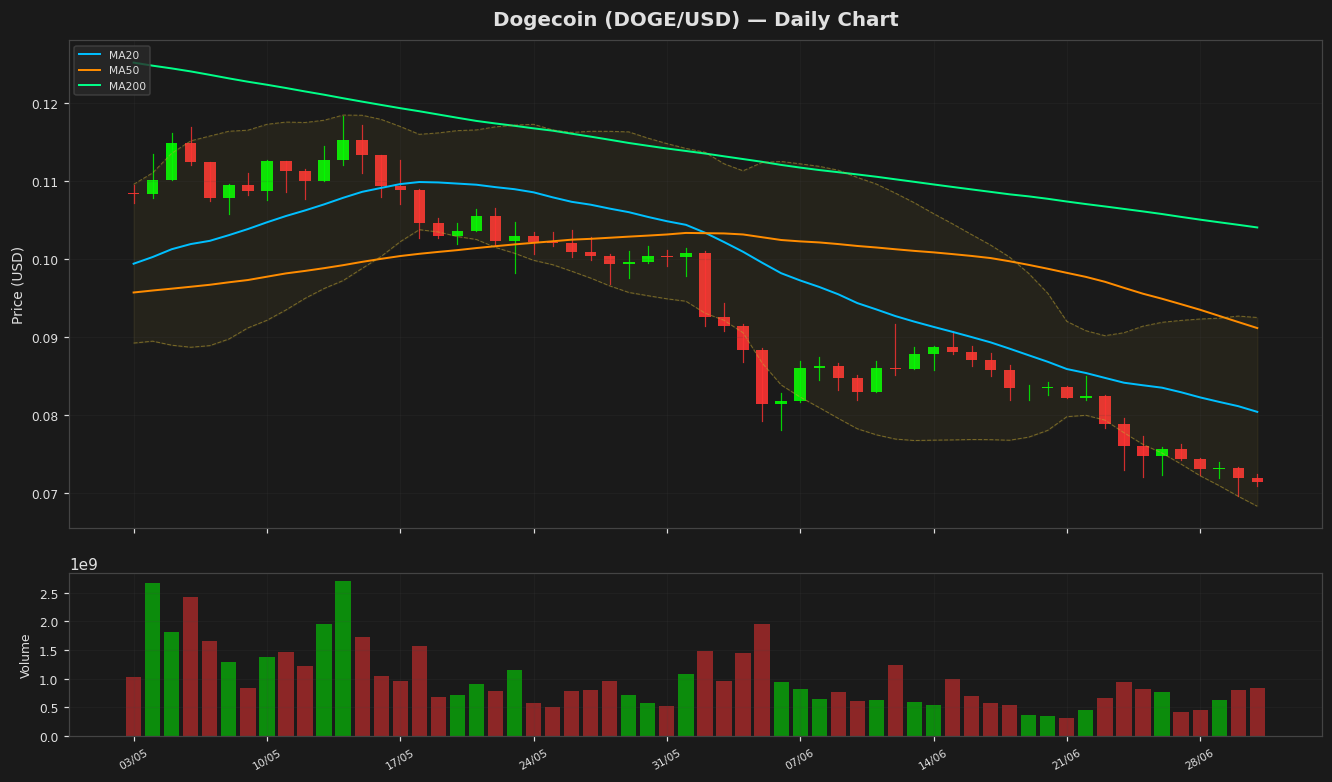
Dogecoin is currently trading at **$0.071390**, down **0.84%** on the day, reflecting continued bearish pressure. The price remains below all key moving averages, with the **20-day MA at $0.080412**, **50-day MA at $0.091145**, and **200-day MA at $0.104033**, indicating a strong downtrend. The widening gap between the price and these MAs suggests persistent selling momentum.
Bollinger Bands show the price hovering near the lower band (**$0.068326**), while the upper band sits at **$0.092498**. This compression signals low volatility, but the sustained lower-band proximity hints at potential oversold conditions. The **RSI(14) at 8.48** is deeply oversold, far below the 30 threshold, which could precede a short-term bounce if buying interest emerges.
The **MACD histogram is negative (-0.00526)**, with the MACD line below the signal line (-0.004852), reinforcing bearish momentum. The **ATR(14) of 0.003145** indicates subdued volatility, typical of consolidation phases.
Key resistance levels are the 20-day MA (**$0.0804**) and the 50-day MA (**$0.0911**). Immediate support lies at the **52-week low of $0.069611**, followed by psychological support at **$0.065**. A break below could trigger further declines, while reclaiming the 20-day MA may signal a minor recovery. Given the extreme RSI, a corrective rally is plausible, but the broader trend remains bearish unless DOGE sustains above the 200-day MA.
Technical Metrics
| Metric | Value |
|---|---|
| Current Price | $0.0714 |
| Daily Change | -0.84% |
| MA 20 | $0.0804 |
| % from MA20 | -11.22% |
| MA 50 | $0.0911 |
| % from MA50 | -21.67% |
| MA 200 | $0.1040 |
| % from MA200 | -31.38% |
| BB Upper | $0.0925 |
| % from BB Upper | -22.82% |
| BB Lower | $0.0683 |
| % from BB Lower | +4.48% |
| RSI (14) | 8.48 |
| MACD | -0.005260 |
| MACD Signal | -0.004852 |
| ATR (14) | 0.003145 |
| 3-Day High | $0.0740 |
| 3-Day Low | $0.0696 |
| 52-Week High | $0.2093 |
| % from 52W High | -65.89% |
| 52-Week Low | $0.0696 |
| % from 52W Low | +2.56% |
| YTD High | $0.1561 |
| % from YTD High | -54.26% |
| YTD Low | $0.0696 |
| % from YTD Low | +2.56% |
📊 Market Commentary
Dogecoin (DOGE) is trading at $0.0714, down 0.84% today, as the meme coin continues to struggle amid weak market sentiment. The Relative Strength Index (RSI) sits at an extremely oversold 8.5, signaling intense selling pressure but also potential for a short-term bounce if buyers step in. DOGE remains near the lower end of its 52-week range ($0.0696 – $0.2093), with the current price just above the yearly low.
Market sentiment for DOGE is bearish, reflecting broader weakness in the crypto market. Traders are closely monitoring the $0.0696 support level, as a breakdown could trigger further downside. On the upside, resistance is seen near $0.0750, a level that has acted as a short-term ceiling in recent sessions. Volume remains subdued, indicating limited conviction from either bulls or bears.
The lack of catalysts for DOGE, combined with reduced speculative interest in meme coins, has contributed to its underperformance. Traders are also watching Bitcoin’s price action, as DOGE often moves in tandem with the broader market. While the oversold RSI suggests a possible relief rally, sustained buying interest is needed to shift momentum. For now, caution prevails, with most participants waiting for clearer signals before taking significant positions. The $0.0700 psychological level remains key in the near term.
Disclaimer
The content on MarketsFN.com is provided for educational and informational purposes only. It does not constitute financial advice or investment recommendations. All investments involve risk. Cryptocurrency markets are highly volatile. Past performance does not guarantee future results.