Copper: Up 2.1% to $6.24 — Below MA50 ($6.25) — Caution
· Commodities · QuoteReporter
Copper: Up 2.1% to $6.24 — Below MA50 ($6.25) — Caution
Analysis Date: July 03, 2026
📊 Current Market Data
CURRENT PRICE
$6.24
DAILY CHANGE
+2.12%
WEEKLY CHANGE
+1.67%
52W HIGH
$6.65
52W LOW
$4.32
💡 Key Market Factors
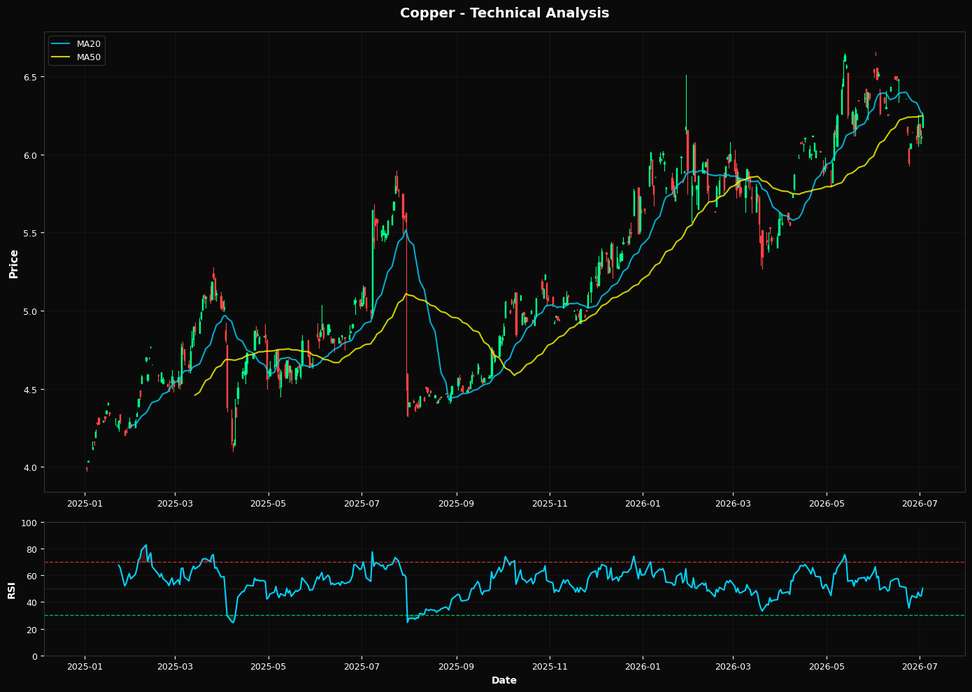
Copper's recent price action suggests a cautious optimism, but the market may be underestimating the impact of the U.S. dollar's movements. Currently priced at $6.24, copper has seen a daily increase of +2.12% and a weekly rise of +1.67%. This uptick is significant given the broader macroeconomic backdrop where the U.S. dollar's strength has been a critical factor. A strong dollar typically pressures commodity prices, but copper's resilience indicates that other factors, such as supply constraints or demand from China, might be offsetting this pressure. However, if the dollar continues to strengthen, it could cap further gains in copper prices. From a technical perspective, copper is at a critical juncture. The Relative Strength Index (RSI) at 50.3 suggests a neutral market, neither overbought nor oversold. The price is hovering just below the 20-day and 50-day moving averages, both at $6.25, indicating a potential resistance level. However, the 200-day moving average at $5.65 provides a strong support base, aligning closely with the nearest Fibonacci support at $5.76. This technical setup suggests a consolidation phase, with a slight bullish bias given the proximity to the moving averages and the recent price gains. A break above these moving averages could signal a more sustained upward trend. The key risk to this outlook is the upcoming Federal Reserve meeting. Any indication of a more aggressive rate hike path could strengthen the dollar further, exerting downward pressure on copper prices. Conversely, a dovish stance could weaken the dollar, providing a tailwind for copper. The market may not be fully pricing in the potential for a significant policy shift, which could lead to volatility in commodity prices. Looking ahead, the most critical catalyst will be the next U.S. inflation report. A higher-than-expected inflation figure could prompt the Fed to maintain or even accelerate its rate hikes, impacting the dollar and, by extension, copper prices. Conversely, a softer inflation reading could ease rate hike expectations, potentially weakening the dollar and supporting copper's upward momentum. This report will be pivotal in confirming or challenging the current market dynamics and should be closely watched by investors.📈 Technical Indicators Summary
RSI (14)
50.3
50-Day MA
$6.25
200-Day MA
$5.65
Fib Level
38.2%
📊 Technical Analysis Chart (18-Month View)
📐 Fibonacci Retracement Analysis
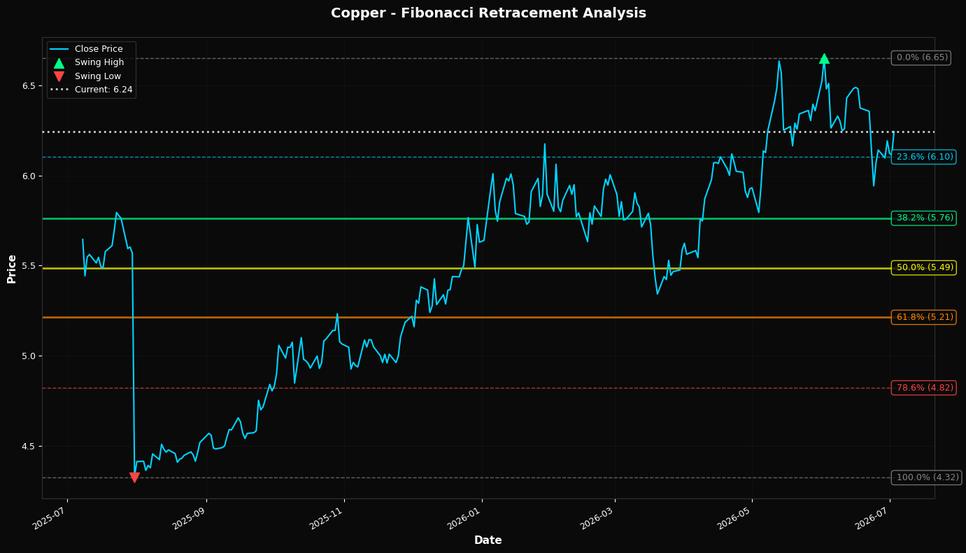
🎯 Key Trading Levels
Key Fibonacci Levels:
- 38.2%: $5.76
- 50.0%: $5.49
- 61.8%: $5.21
Support: $4.32 (Swing Low), $6.25 (50-Day MA)
Resistance: $6.65 (Swing High)
Disclaimer
The content on MarketsFN.com is provided for educational and informational purposes only. It does not constitute financial advice, investment recommendations, or trading guidance. All investments involve risks, and past performance does not guarantee future results. You are solely responsible for your investment decisions and should conduct independent research and consult a qualified financial advisor before acting. MarketsFN.com and its authors are not liable for any losses or damages arising from your use of this information.