Cotton: Down 1.0% to $72.57 — Testing 61.8% Fibonacci Support
· Commodities · QuoteReporter
Cotton: Down 1.0% to $72.57 — Testing 61.8% Fibonacci Support
Analysis Date: July 03, 2026
📊 Current Market Data
CURRENT PRICE
$72.57
DAILY CHANGE
-0.97%
WEEKLY CHANGE
-1.13%
52W HIGH
$88.88
52W LOW
$60.71
💡 Key Market Factors
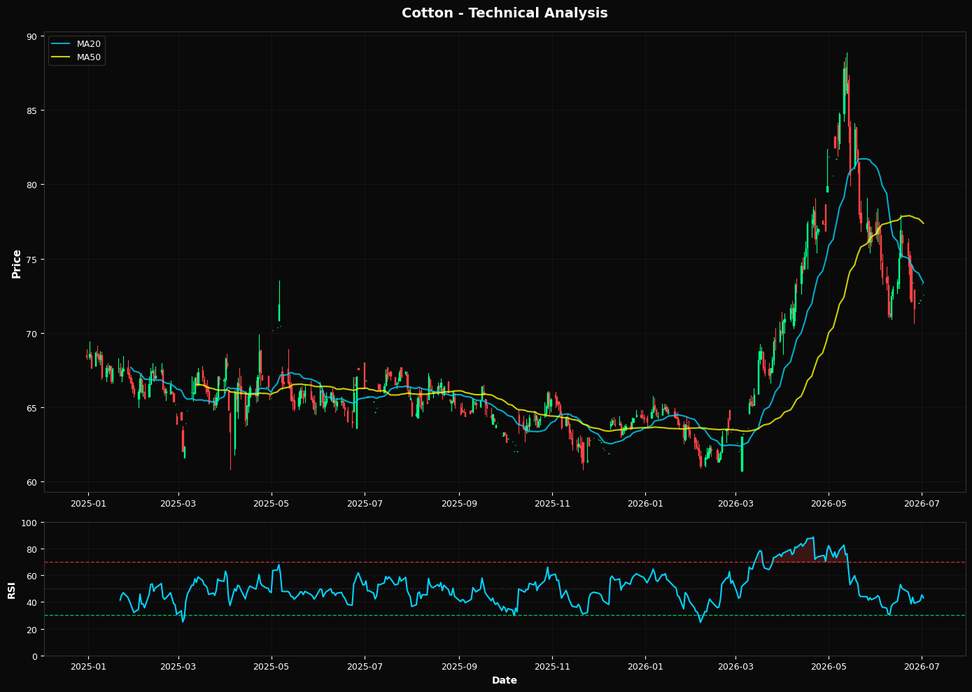
Cotton prices are poised at a critical juncture, with the U.S. dollar's strength emerging as the most significant macro driver. As cotton is priced in dollars, a strong USD typically exerts downward pressure on prices by making U.S. exports less competitive. Currently, cotton is trading at $72.57, down 0.97% daily and 1.13% weekly, indicating that the market may be underpricing the impact of a robust dollar environment. With the Federal Reserve maintaining a hawkish stance on interest rates, the dollar's strength could persist, further pressuring cotton prices. This dynamic is crucial as it directly affects global demand and could lead to a more pronounced price decline if the dollar continues to appreciate. From a technical perspective, cotton is showing signs of potential weakness. The Relative Strength Index (RSI) at 43.1 suggests that the commodity is not yet oversold, leaving room for further downside. The current price of $72.57 is below both the 20-day moving average of $73.38 and the 50-day moving average of $77.38, indicating a bearish trend. However, it remains above the 200-day moving average of $68.06, which could act as a longer-term support level. The nearest Fibonacci support at 61.8% is at $71.47, which is crucial; a breach below this level could accelerate selling pressure. The technical setup suggests a bearish bias unless the price can reclaim the 20-day moving average. A key risk that could alter the current bearish outlook is a shift in U.S. monetary policy or a significant change in inflation data. Should the Federal Reserve signal a pause or reversal in its rate hike trajectory, the dollar could weaken, providing relief to cotton prices. Additionally, any unexpected surge in inflation could prompt a reassessment of the Fed's policy path, impacting the dollar and, consequently, cotton prices. The market may be underestimating the potential for such a pivot, which could lead to a rapid revaluation of cotton's price trajectory. Looking ahead, the upcoming U.S. Consumer Price Index (CPI) release will be pivotal. A lower-than-expected CPI could suggest easing inflationary pressures, potentially leading to a softer dollar and providing a bullish catalyst for cotton. Conversely, a higher CPI reading would likely reinforce the Fed's current policy stance, strengthening the dollar and maintaining pressure on cotton prices. This data point will be crucial in confirming or invalidating the current bearish outlook for cotton.📈 Technical Indicators Summary
RSI (14)
43.1
50-Day MA
$77.38
200-Day MA
$68.06
Fib Level
61.8%
📊 Technical Analysis Chart (18-Month View)
📐 Fibonacci Retracement Analysis
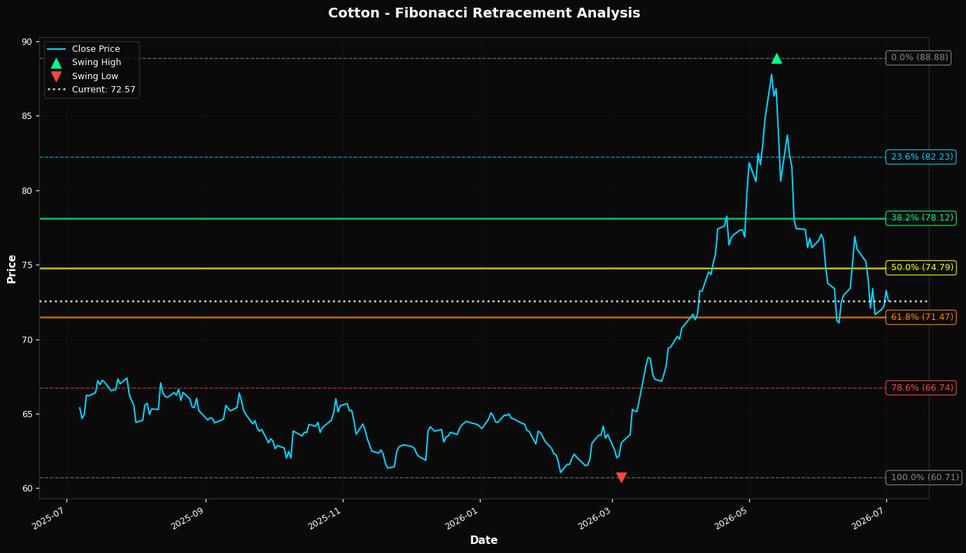
🎯 Key Trading Levels
Key Fibonacci Levels:
- 38.2%: $78.12
- 50.0%: $74.79
- 61.8%: $71.47
Support: $60.71 (Swing Low), $77.38 (50-Day MA)
Resistance: $88.88 (Swing High)
Disclaimer
The content on MarketsFN.com is provided for educational and informational purposes only. It does not constitute financial advice, investment recommendations, or trading guidance. All investments involve risks, and past performance does not guarantee future results. You are solely responsible for your investment decisions and should conduct independent research and consult a qualified financial advisor before acting. MarketsFN.com and its authors are not liable for any losses or damages arising from your use of this information.