Corn: Up 1.0% to $425.00 — Testing 50.0% Fibonacci Support
· Commodities · QuoteReporter
Corn: Up 1.0% to $425.00 — Testing 50.0% Fibonacci Support
Analysis Date: July 03, 2026
📊 Current Market Data
CURRENT PRICE
$425.00
DAILY CHANGE
+0.95%
WEEKLY CHANGE
+2.47%
52W HIGH
$481.75
52W LOW
$368.75
💡 Key Market Factors
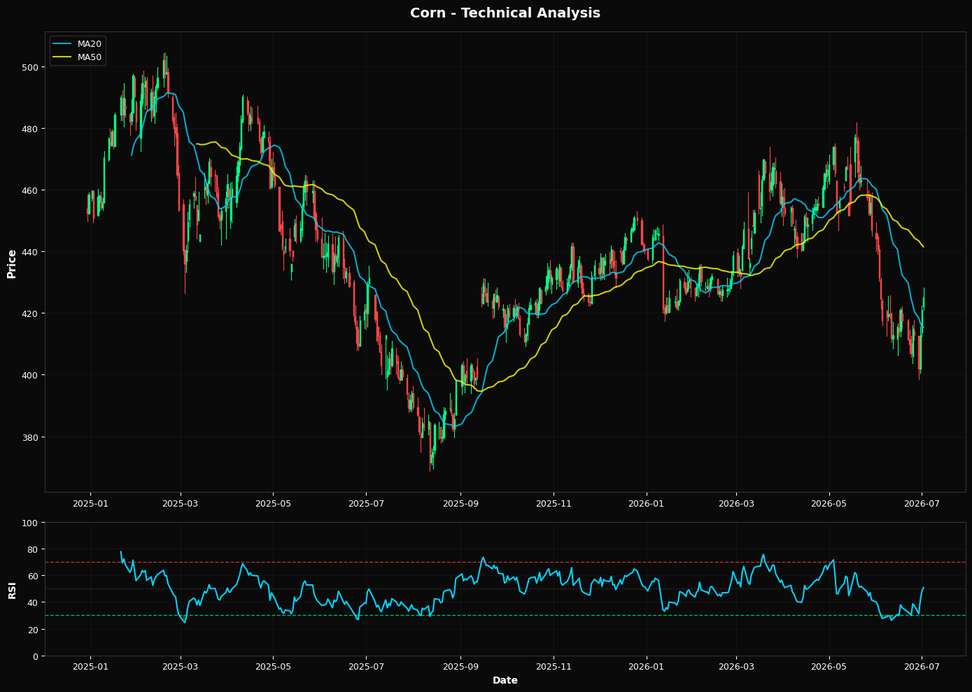
Corn prices are poised for a potential breakout, driven by a confluence of technical factors and macroeconomic conditions. The most pressing macro driver for corn today is the strength of the U.S. dollar. A strong dollar typically exerts downward pressure on commodity prices, including corn, by making U.S. exports more expensive for foreign buyers. However, with the Federal Reserve signaling a potential pause in rate hikes, the dollar's recent strength may wane, providing a tailwind for corn prices. This dynamic is crucial as it could enhance U.S. competitiveness in the global corn market, potentially driving prices higher. From a technical perspective, corn is at a critical juncture. The current price of $425.00 is just below the nearest Fibonacci support level at $425.25, suggesting a potential pivot point. The Relative Strength Index (RSI) at 50.7 indicates a neutral market, neither overbought nor oversold, which aligns with the price hovering around the 50% Fibonacci retracement. However, the 20-day moving average ($415.40) is below the current price, suggesting short-term bullish momentum. Yet, the price remains below both the 50-day ($441.46) and 200-day ($436.59) moving averages, indicating that longer-term trends are still bearish. This mixed technical setup suggests that while there is potential for upward movement, significant resistance levels must be overcome for a sustained rally. A key risk that could alter the current landscape for corn is a shift in U.S. monetary policy. Should the Federal Reserve decide to resume rate hikes, the dollar could strengthen further, putting renewed pressure on corn prices. Conversely, any indication of a dovish turn could weaken the dollar, providing a boost to corn. Additionally, geopolitical developments affecting global trade, such as changes in export policies or tariffs, could also serve as catalysts for price movement. Looking ahead, the upcoming Federal Reserve meeting and any statements regarding future rate policy will be pivotal. A confirmation of a pause or a dovish shift could validate the bullish potential for corn, while a hawkish surprise could reinforce the bearish longer-term technical signals. Investors should closely monitor these developments, as they will likely dictate the next significant move in corn prices.📈 Technical Indicators Summary
RSI (14)
50.7
50-Day MA
$441.46
200-Day MA
$436.59
Fib Level
50.0%
📊 Technical Analysis Chart (18-Month View)
📐 Fibonacci Retracement Analysis
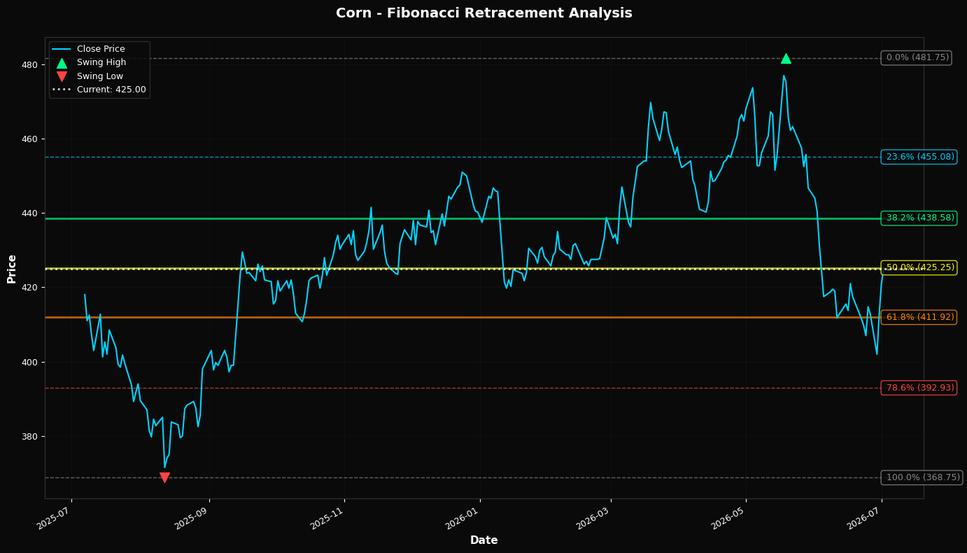
🎯 Key Trading Levels
Key Fibonacci Levels:
- 38.2%: $438.58
- 50.0%: $425.25
- 61.8%: $411.92
Support: $368.75 (Swing Low), $441.46 (50-Day MA)
Resistance: $481.75 (Swing High)
Disclaimer
The content on MarketsFN.com is provided for educational and informational purposes only. It does not constitute financial advice, investment recommendations, or trading guidance. All investments involve risks, and past performance does not guarantee future results. You are solely responsible for your investment decisions and should conduct independent research and consult a qualified financial advisor before acting. MarketsFN.com and its authors are not liable for any losses or damages arising from your use of this information.