Crypto Market Slumps: Bitcoin, Ethereum, and Ripple Lead Losses Today
· Crypto · QuoteReporter
Crypto Market Slumps: Bitcoin, Ethereum, and Ripple Lead Losses Today
Crypto Market Report | May 22, 2026
📊 Crypto Market Overview
The cryptocurrency market is currently experiencing a mixed sentiment, with some assets showing signs of consolidation while others continue to face selling pressure. Bitcoin, the largest cryptocurrency by market capitalization, is trading at $77,264.4688, down 0.35% on the day. The Relative Strength Index (RSI) for Bitcoin stands at 37.8, indicating a neutral territory, while the Moving Average Convergence Divergence (MACD) is at 91.7755, suggesting a continued bullish trend.
Other major cryptocurrencies, such as Ethereum and Solana, are also trading in the red, with Ethereum's RSI at 26.9, indicating oversold conditions, and Solana's RSI at 39.6. Ripple and BNB are also down on the day, with their RSI values at 40.5 and 53.2, respectively. In contrast, Tron is showing signs of being overbought, with an RSI of 80.4.
The macro context remains relevant, with news of a Verus bridge exploiter returning $8.5 million after a bounty offer and US lawmakers renewing their push for a strategic Bitcoin reserve with the ARMA bill. Additionally, the SEC's Peirce has tempered expectations over tokenized stocks exemption, highlighting the ongoing regulatory scrutiny. The Coinbase premium has hit a monthly low, indicating mounting institutional selling pressure.
From a technical standpoint, the MACD values for various cryptocurrencies are providing mixed signals. Ethereum's MACD is negative, indicating a bearish trend, while Bitcoin's MACD remains positive. The market is also seeing some firms winding down their operations amid the ongoing slump, while others are navigating the challenges posed by tokenized stocks and liquidity fragmentation. Overall, the cryptocurrency market is characterized by a complex interplay of factors, with both bullish and bearish signals present across various assets.
📰 Crypto News
- Verus bridge exploiter returns $8.5M after bounty offer
- Bitcoin price record 90-day uptrend 'resembles bull market rally:' New analysis
- Tokenized stocks risk liquidity and revenue fragmentation: Research
- Galaxy’s Novogratz speaks in court over failed $1.2B BitGo deal: Report
- SEC's Peirce tempers expectations over tokenized stocks exemption
- Coinbase premium hits monthly low as institutional selling pressure mounts
- Accused attackers of Sandbox exec’s wife tried to flee via Uber
- US lawmakers renew strategic Bitcoin reserve push with ARMA bill
- 5 crypto firms wind down this week amid ongoing market slump
- Bitcoin liquidity balance hints at developing rally toward $80K
- Bitcoin longs soar despite weak US macroeconomic data: Is $82K BTC next?
- ZachXBT flags $520K Polymarket exploit on Polygon, team says funds are safe
- Near Protocol to automate its own growth and its token is skyrocketing
- Polymarket aims for prediction market approval in Japan by 2030
- Bitcoin implied volatility drops to 7 month low despite macro risks
🔍 Technical Analysis
Bitcoin (BTC) — -0.35%
$77,264.47 52W: $60,074.20 — $126,198.07
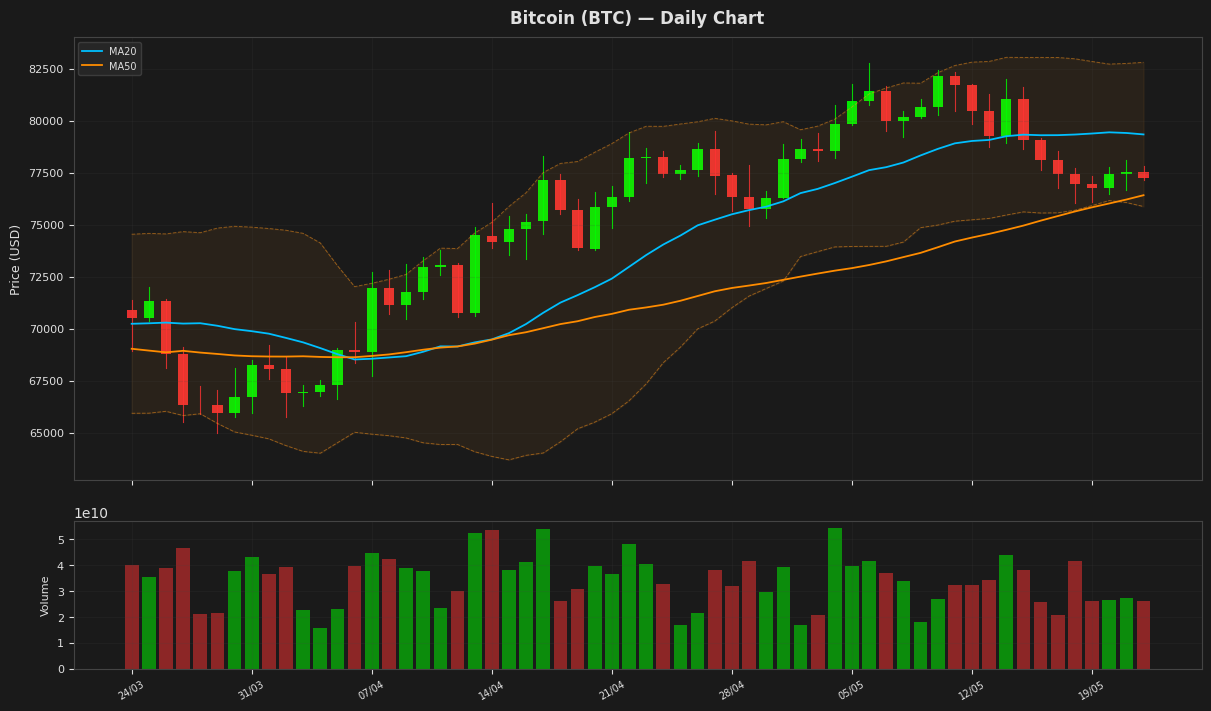
Bitcoin's price is currently at $77,264, showing a slight decline of 0.35% and is positioned near the lower Bollinger Band at $75,874, indicating potential support. The RSI is at 37.77, suggesting the asset is nearing oversold territory. The MACD is above its signal line, indicating a potential bullish signal. The ATR remains high at $1,801, indicating significant volatility.
Ethereum (ETH) — -0.44%
$2,121.94 52W: $1,748.63 — $4,763.36
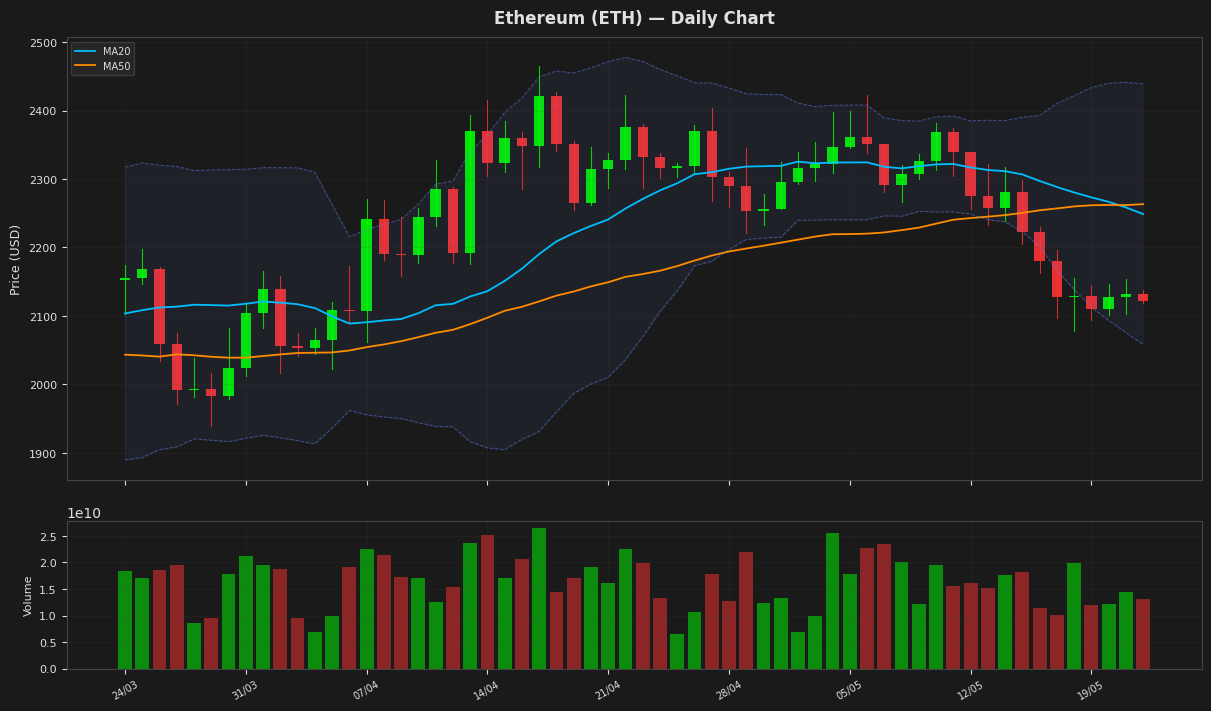
Ethereum's price is currently at $2,121.94, showing a slight decline, and is nearing the lower Bollinger Band at $2,058.45, indicating potential oversold conditions as the RSI(14) is at 26.90. The MACD is below its signal line, suggesting a bearish trend. The Average True Range indicates moderate volatility, and the price is significantly below both the MA20 and MA50, reinforcing the downtrend.
Ripple (XRP) — -1.02%
$1.3581 52W: $1.1335 — $3.1835
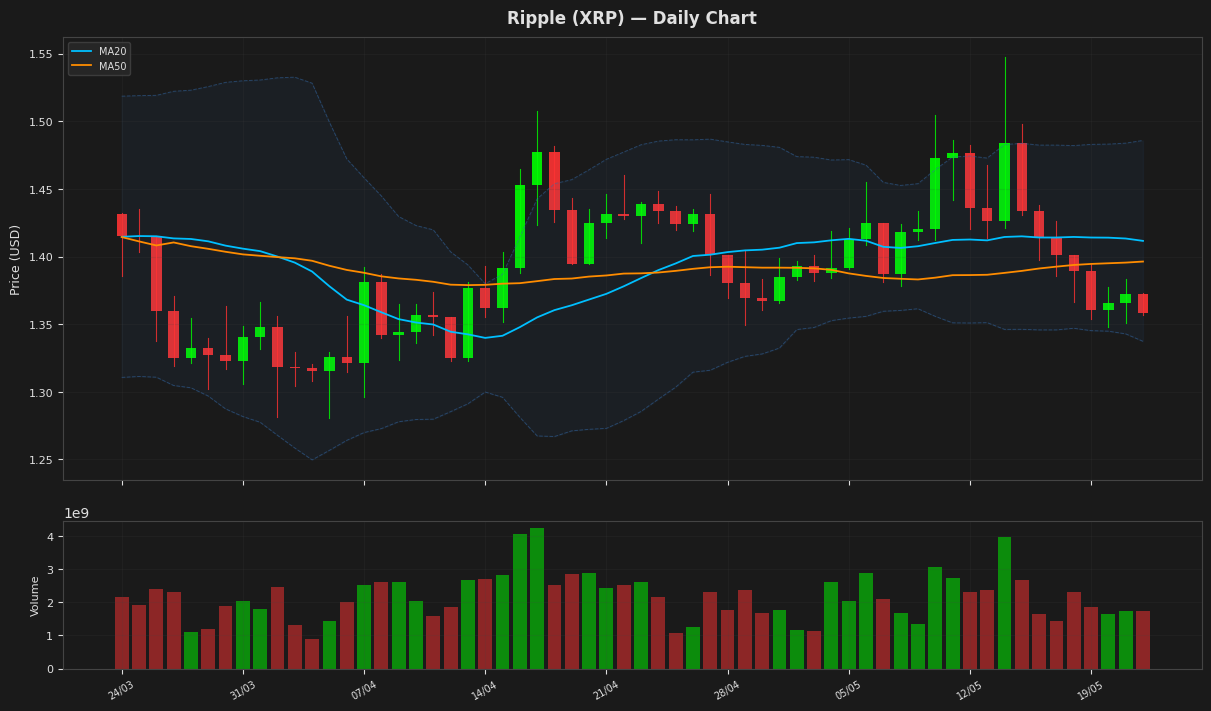
Ripple's price is currently at $1.358100, showing a slight decline, and is positioned near the lower Bollinger Band at $1.337386, indicating potential support. The RSI is at 40.470341, suggesting the asset is nearing oversold territory. The MACD is below its signal line, indicating a bearish trend. The ATR indicates moderate volatility.
Solana (SOL) — -0.23%
$86.9600 52W: $68.6918 — $253.2099
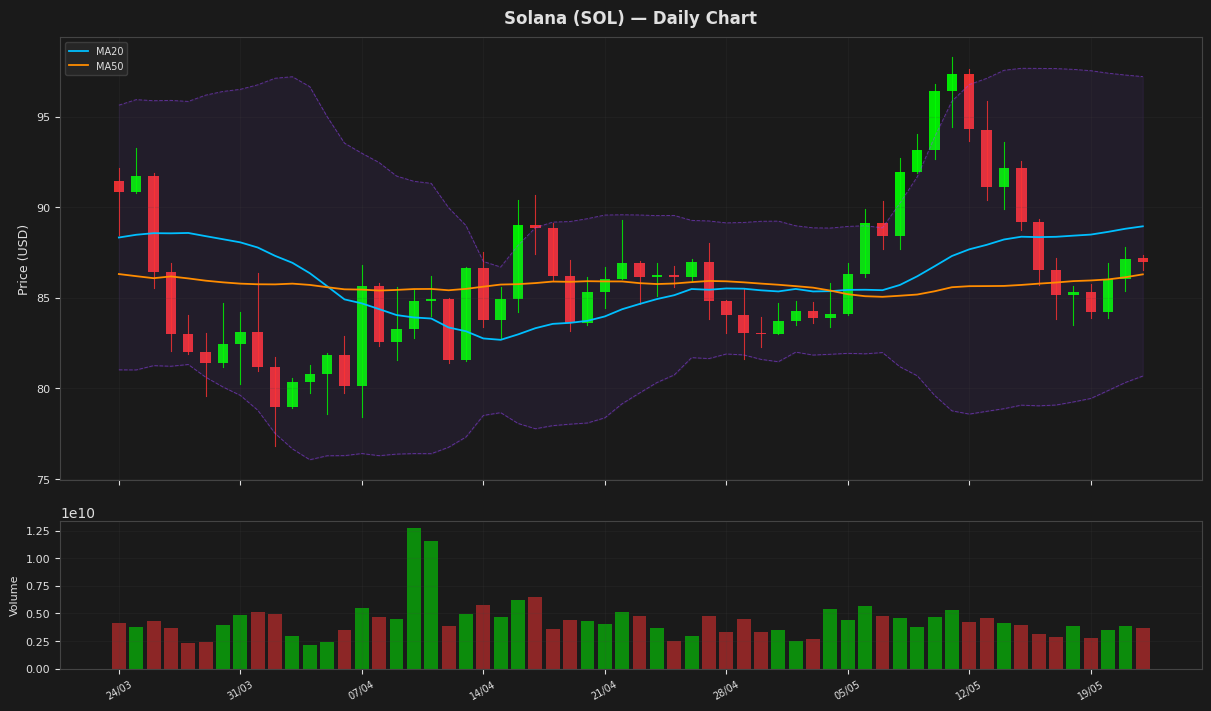
Solana's price is currently at $86.96, slightly below its MA50 at $86.29, indicating a potential support level. The RSI at 39.63 suggests the asset is nearing oversold territory, while the MACD is below its signal line, indicating a bearish trend. The Bollinger Bands indicate a trading range between $80.68 and $97.20, with the current price near the middle of this range.
BNB (BNB) — -0.31%
$655.3400 52W: $570.6840 — $1,370.55
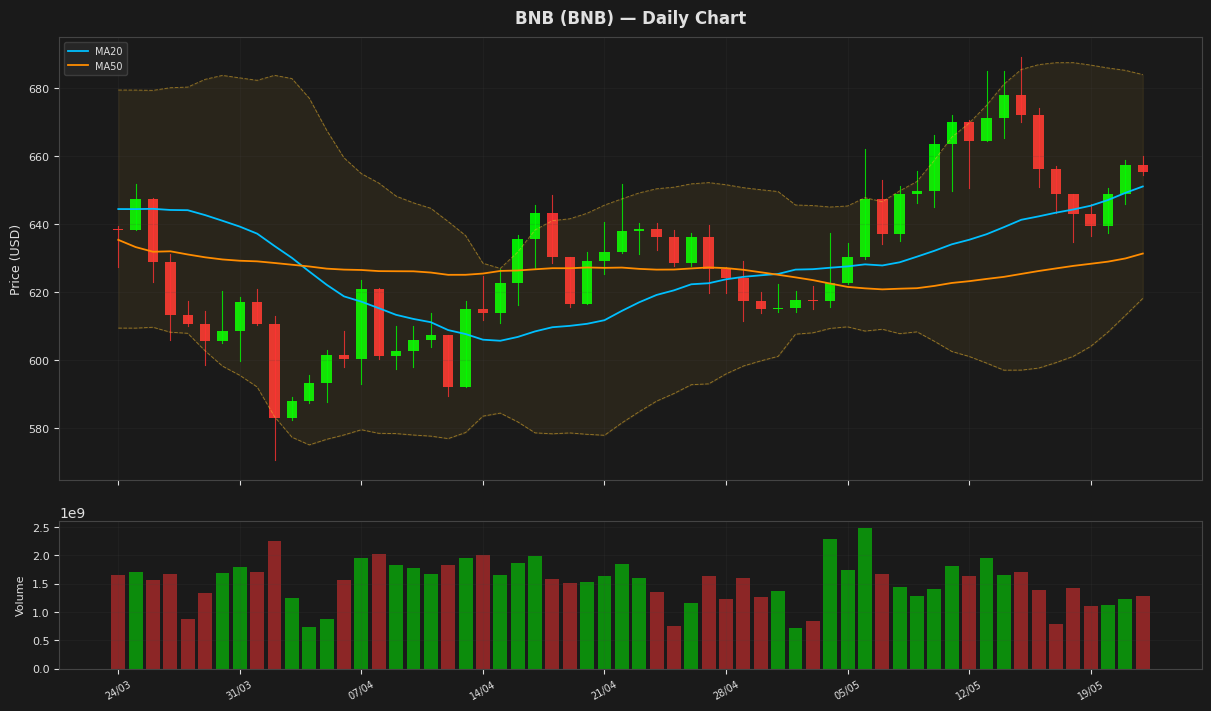
BNB is currently trading at $655.34, slightly above its 20-day moving average of $651.13, indicating a neutral to slightly bullish short-term trend. The Relative Strength Index (RSI) at 53.22 suggests a balanced market with no extreme buying or selling pressure. The price is also within the Bollinger Bands, with the upper band at $684.04 and lower band at $618.21, indicating moderate volatility.
Tron (TRX) — -0.09%
$0.364688 52W: $0.268138 — $0.365925
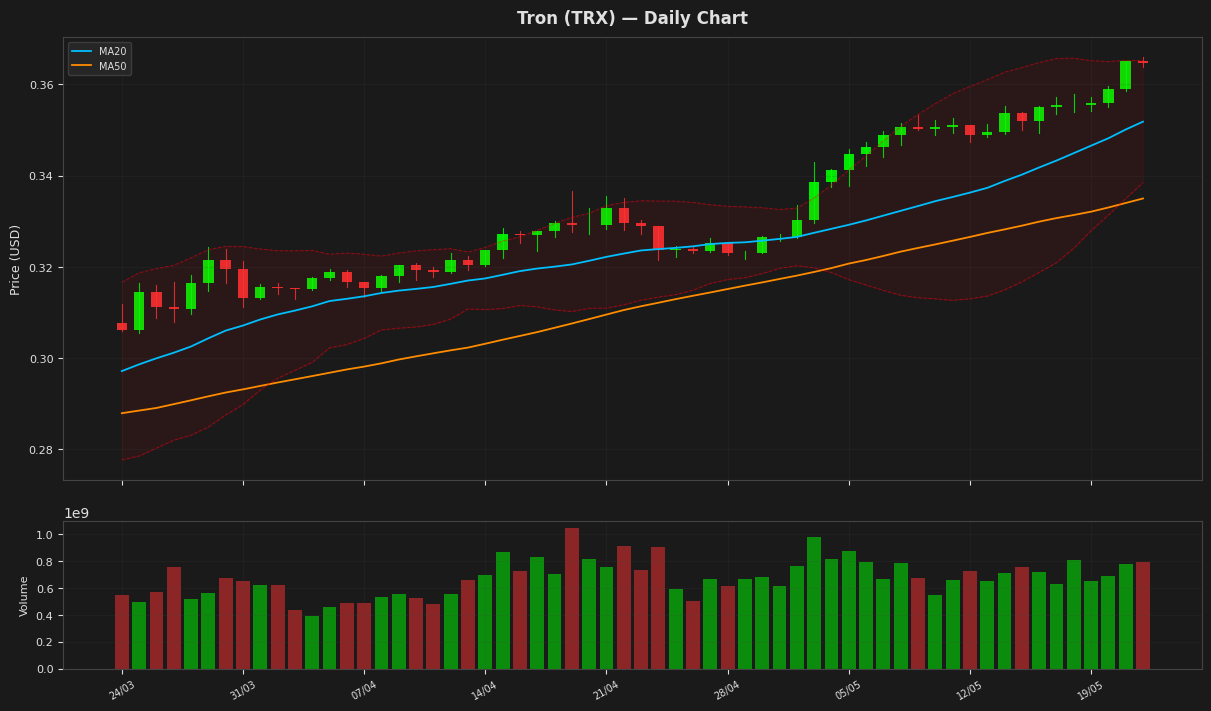
Tron's price is currently at $0.364688, near its 52-week high of $0.365925, with the RSI indicating an overbought condition at 80.437655. The MACD is above its signal line, suggesting a bullish signal. The Bollinger Bands are relatively tight, indicating low volatility, with the price near the upper band. The ATR suggests that the price movement is relatively stable.
Dogecoin (DOGE) — +0.11%
$0.105610 52W: $0.081573 — $0.305642
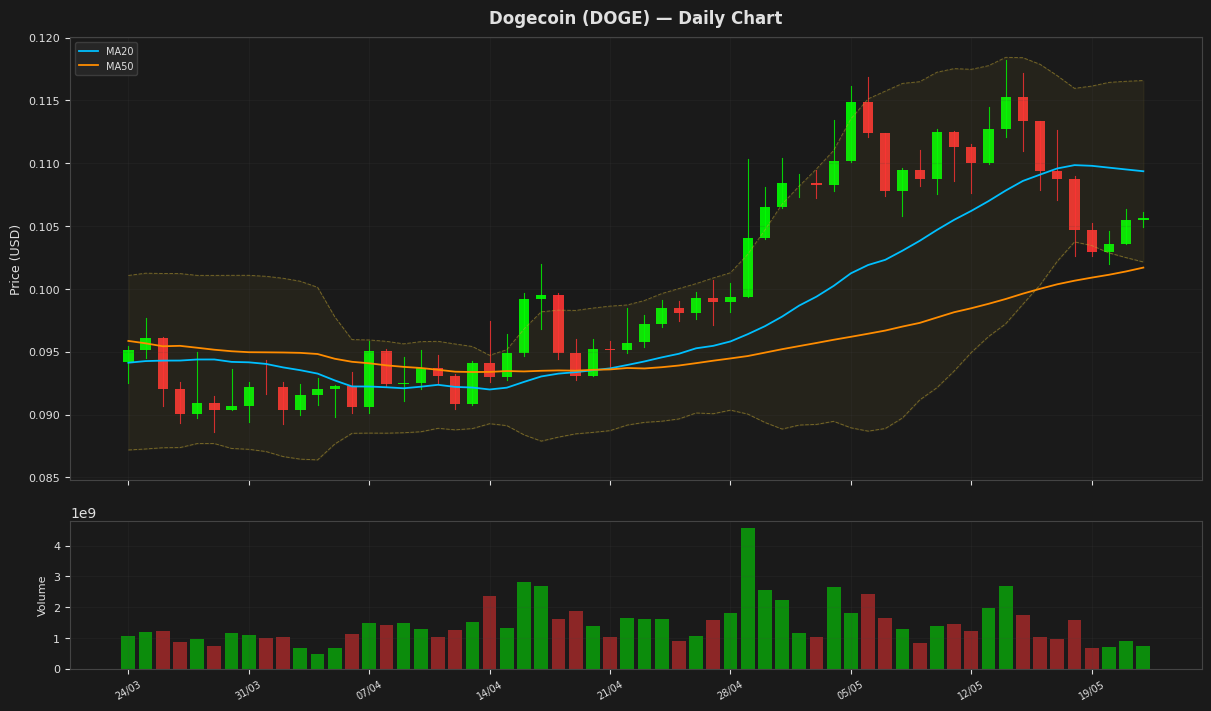
Dogecoin is currently trading at $0.105610, slightly above the lower Bollinger Band of $0.102147, indicating potential support at this level. The RSI is at 42.974048, suggesting that the cryptocurrency is nearing oversold territory. The MACD is below its signal line, indicating a bearish trend. The price is also below both the MA20 and MA50, further reinforcing the bearish sentiment.
Disclaimer
The content on MarketsFN.com is provided for educational and informational purposes only. It does not constitute financial advice or investment recommendations. All investments involve risk. Past performance does not guarantee future results.