Crypto Market Slumps: BNB, Ripple, and Solana Lead Top Losers Today
· Crypto · QuoteReporter
Crypto Market Slumps: BNB, Ripple, and Solana Lead Top Losers Today
Crypto Market Report | July 06, 2026
📊 Crypto Market Overview
The cryptocurrency market is currently experiencing a subdued trading environment, with the majority of top assets recording minor losses. Bitcoin, the largest cryptocurrency by market capitalization, is trading at $62,993.3594, down 0.87% on the day, with its Relative Strength Index (RSI) standing at 46.2, indicating a neutral sentiment. The MACD indicator is negative at -1034.3296, suggesting a bearish trend.
Other major cryptocurrencies, including Ethereum, Ripple, and BNB, are also trading in the red, with losses ranging from 0.76% to 1.29%. Ethereum's RSI is at 54.4, while its MACD is negative at -13.3441, indicating a similar neutral-to-bearish sentiment. Solana is an exception, with its RSI at 66.5 and a positive MACD of 2.0977, suggesting a relatively stronger trend.
The macroeconomic context remains a key driver of market sentiment, with central bankers sounding alarms over the potential risks associated with agentic AI in finance. The recent record stablecoin transaction volume of $1.79 trillion in June is a notable development, indicating growing activity in the cryptocurrency space. Meanwhile, security concerns persist, with reports of a potential vulnerability affecting thousands of crypto wallets.
Notable technical signals include Bitcoin's RSI hovering around the neutral zone, while its MACD remains negative. Ethereum's RSI is above 50, indicating a relatively stronger position, but its MACD is still in negative territory. Overall, the market is characterized by a cautious sentiment, with investors likely awaiting key developments and catalysts to drive the next significant move. The recent news and developments, including Vitalik Buterin's comments on Ethereum's 'biggest rebuild' since the Merge, are being closely watched by market participants.
Other major cryptocurrencies, including Ethereum, Ripple, and BNB, are also trading in the red, with losses ranging from 0.76% to 1.29%. Ethereum's RSI is at 54.4, while its MACD is negative at -13.3441, indicating a similar neutral-to-bearish sentiment. Solana is an exception, with its RSI at 66.5 and a positive MACD of 2.0977, suggesting a relatively stronger trend.
The macroeconomic context remains a key driver of market sentiment, with central bankers sounding alarms over the potential risks associated with agentic AI in finance. The recent record stablecoin transaction volume of $1.79 trillion in June is a notable development, indicating growing activity in the cryptocurrency space. Meanwhile, security concerns persist, with reports of a potential vulnerability affecting thousands of crypto wallets.
Notable technical signals include Bitcoin's RSI hovering around the neutral zone, while its MACD remains negative. Ethereum's RSI is above 50, indicating a relatively stronger position, but its MACD is still in negative territory. Overall, the market is characterized by a cautious sentiment, with investors likely awaiting key developments and catalysts to drive the next significant move. The recent news and developments, including Vitalik Buterin's comments on Ethereum's 'biggest rebuild' since the Merge, are being closely watched by market participants.
📰 Crypto News
- Nigel Farage accepted gifts from crypto-linked fraudster: Report
- Here’s what happened in crypto today
- Stablecoin transaction volume hits record $1.79T in June
- Thousands of crypto wallets at risk from ‘Ill Bloom’ vulnerability: Coinspect
- Central bankers sound alarms over agentic AI finance risks
- Trump’s memecoin holders have lost over $3.8B: Report
- Dubai tops Asian crypto hubs, Taiwan passes crypto laws: Asia Express
- FOMC minutes, SpaceX joins Nasdaq 100: Crypto Week Ahead
- Vitalik Buterin says Ethereum is preparing its 'biggest rebuild' since the Merge
- Live markets: Bitcoin pops to $63,900, then reverses, as week begins
- I am contemplating selling some of my bitcoin for gold, veteran trader Peter Brandt says
- XRP rises 3% as $1.14 breakout turns into support test
- Ether leads crypto's hold above key levels as bitcoin steadies over $63,000
🔍 Technical Analysis
Bitcoin (BTC) — -0.87%
$62,993.36 52W: $57,747.77 — $116,078.98
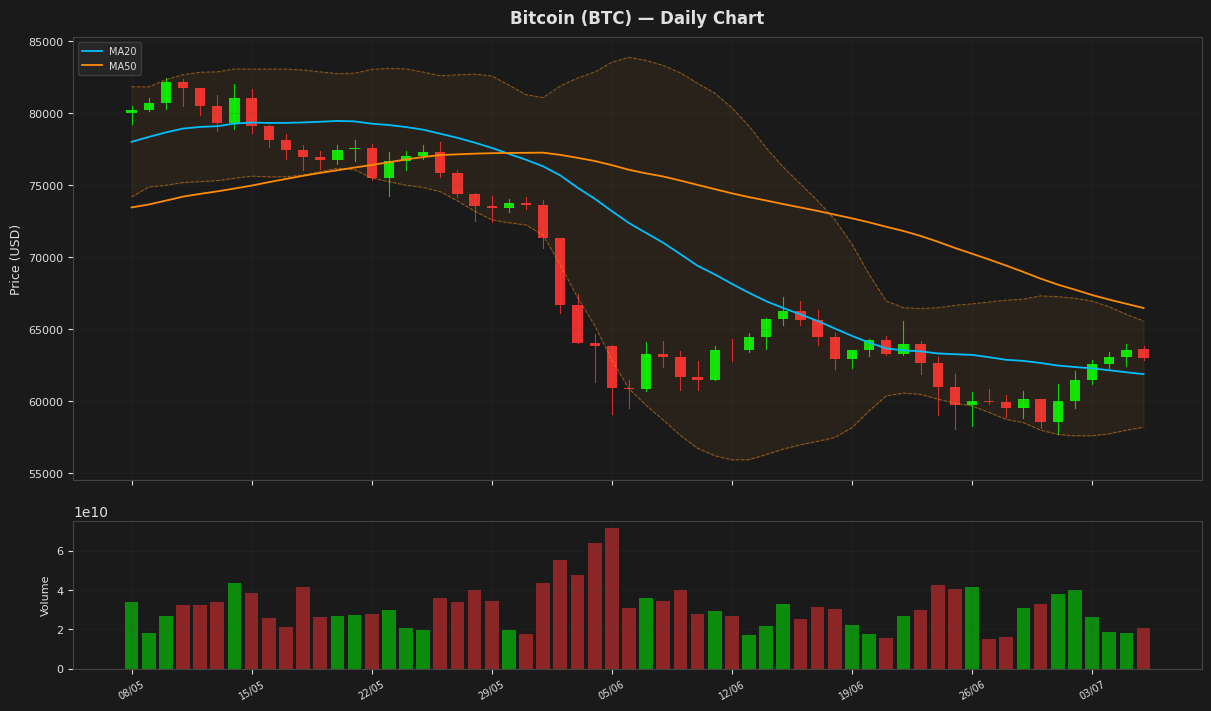
Bitcoin's price is currently at $62,993, slightly below its 20-day moving average of $61,875, indicating a lack of strong upward momentum. The Relative Strength Index (RSI) at 46.24 suggests a neutral position, neither overbought nor oversold. The MACD line is above its signal line, indicating a potential bullish signal as the MACD is -1034.33 and the signal is -1700.34. The price is also within the Bollinger Bands, with the upper band at $65,558 and the lower band at $58,193.
Ethereum (ETH) — -0.76%
$1,769.54 52W: $1,506.51 — $4,173.51
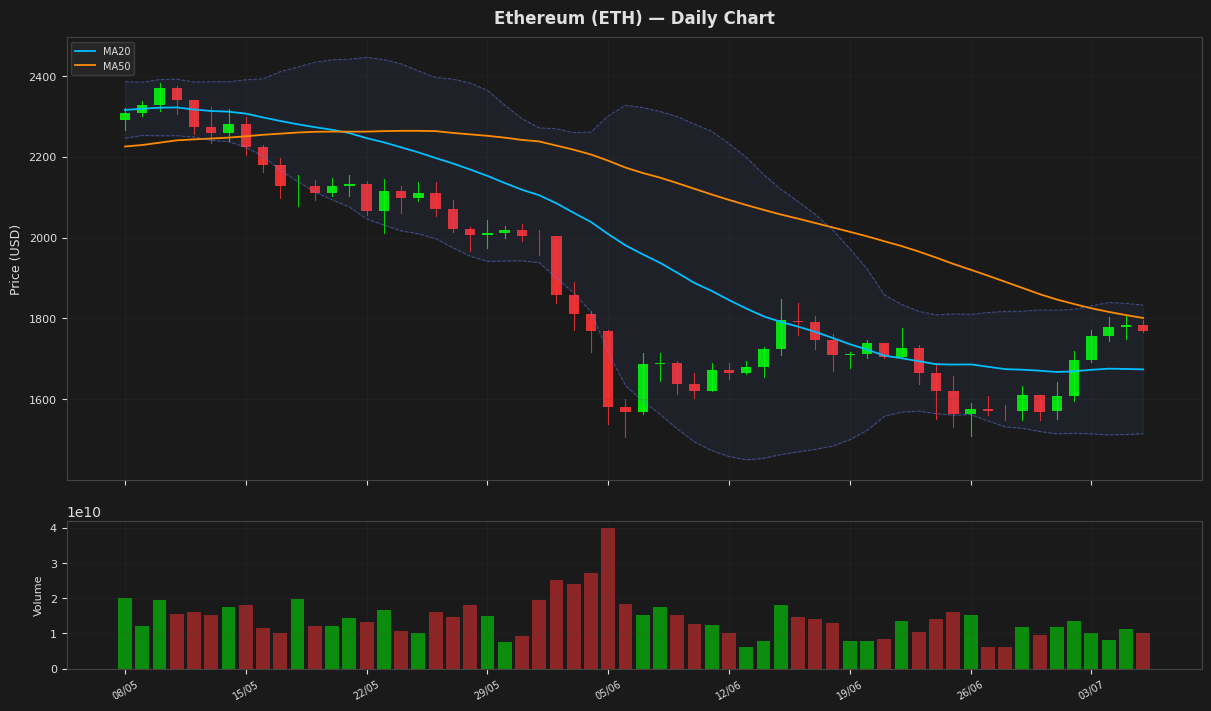
Ethereum is currently trading at $1,769.54, slightly below its 50-day moving average of $1,801.19, indicating a potential resistance level. The Relative Strength Index (RSI) at 54.42 suggests a neutral market sentiment, while the Moving Average Convergence Divergence (MACD) being below its signal line indicates a bearish signal. The price is also near the upper Bollinger Band at $1,833.28, suggesting a possible reversal.
Ripple (XRP) — -0.99%
$1.1444 52W: $1.0098 — $2.6833
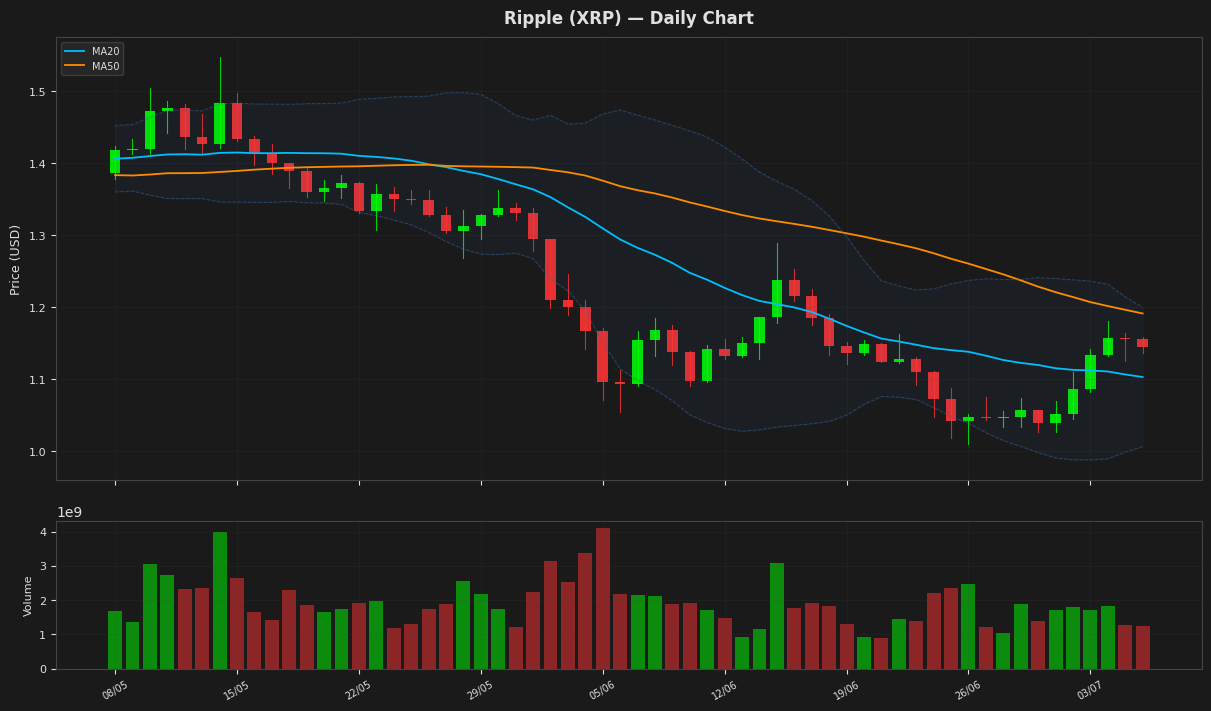
Ripple's price is currently at $1.144400, showing a slight decline of 0.99% for the day, and is positioned between its 20-day and 50-day moving averages, indicating a neutral short-term trend. The RSI is at 53.109187, suggesting a balanced market with no strong directional bias. The Bollinger Bands indicate that the price is near the upper band at 1.199746, suggesting potential resistance at this level. The MACD is negative but above its signal line, indicating a potential for a slight recovery.
Solana (SOL) — -0.99%
$80.6200 52W: $60.4147 — $203.8318
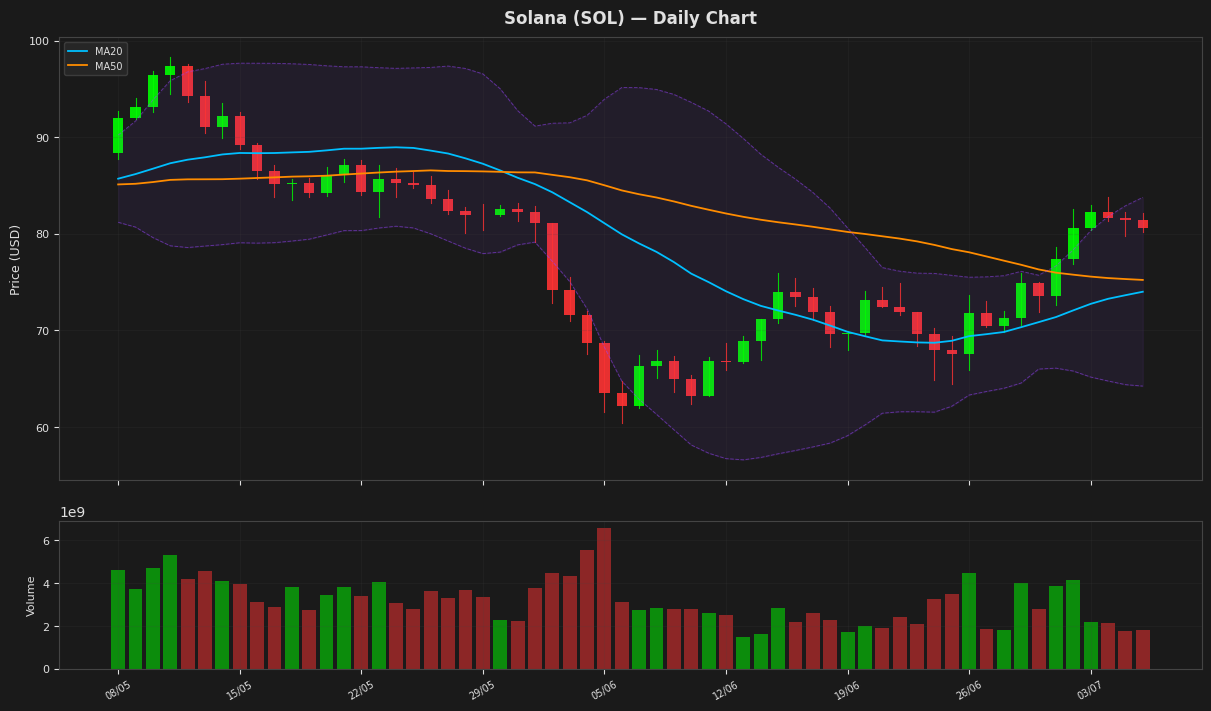
Solana's price is currently at $80.62, showing a minor decline of 0.99% and trading above both its MA20 and MA50, indicating a short-term bullish trend. The RSI is at 66.50, suggesting the asset is nearing overbought territory but still has room to maneuver. The MACD is above its signal line, reinforcing the positive momentum, while the Bollinger Bands indicate potential resistance around $83.77.
BNB (BNB) — -1.29%
$581.3500 52W: $538.5992 — $1,148.56
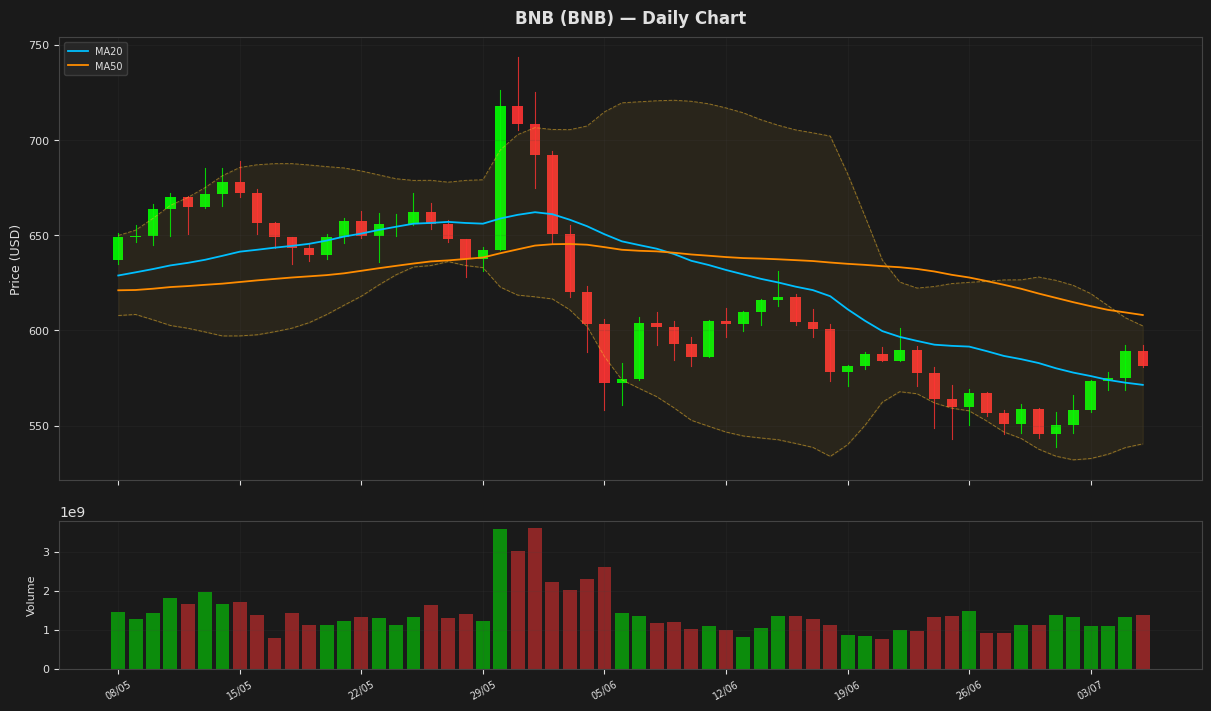
BNB is currently trading at $581.35, slightly below its MA50, indicating a potential bearish trend. The RSI is near the neutral zone at 46.58, while the MACD is below its signal line, suggesting a bearish momentum. The price is hovering near the upper end of the Bollinger Bands range, with the upper and lower bands at $602.36 and $540.42 respectively, indicating a relatively stable volatility.
Tron (TRX) — -0.58%
$0.327094 52W: $0.268138 — $0.376332
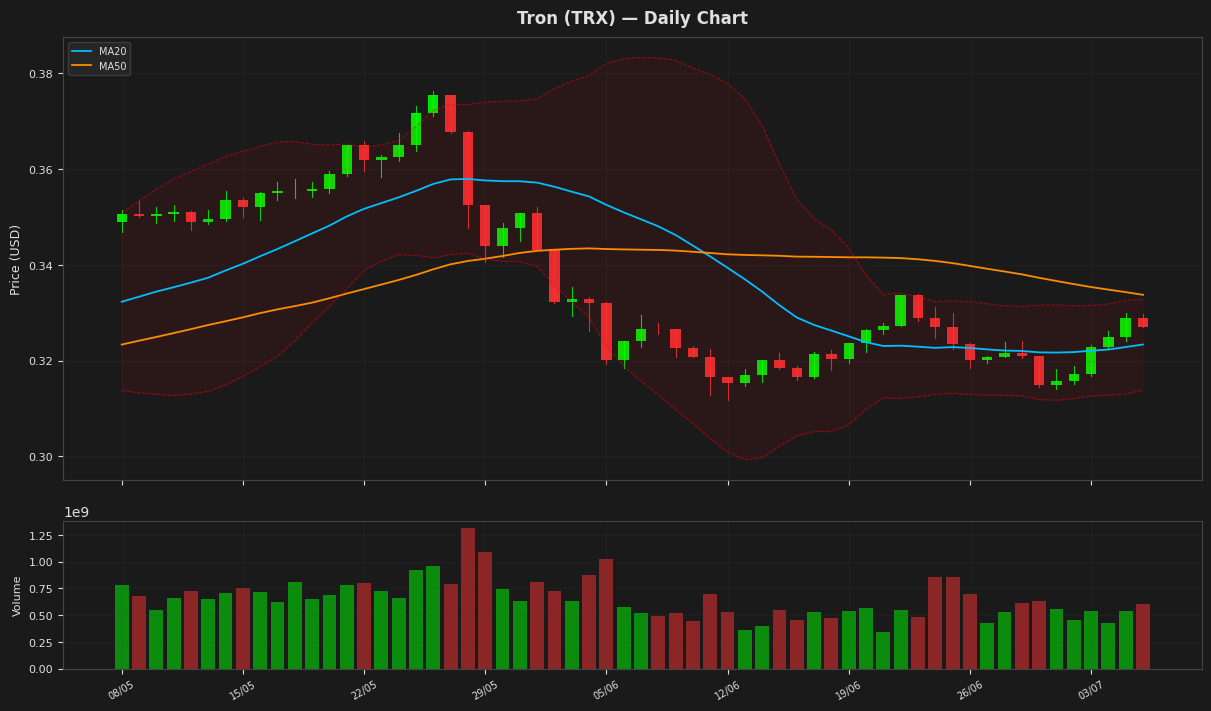
Tron's price is currently at $0.327094, slightly above its 20-day moving average of 0.323362, indicating a potential support level. The Relative Strength Index (RSI) at 41.292615 suggests that TRX is nearing oversold territory, while the MACD is below its signal line, indicating a bearish trend. The Bollinger Bands indicate that the price is near the upper band, suggesting a possible resistance level at 0.332863.
Dogecoin (DOGE) — -0.80%
$0.077110 52W: $0.069611 — $0.202907
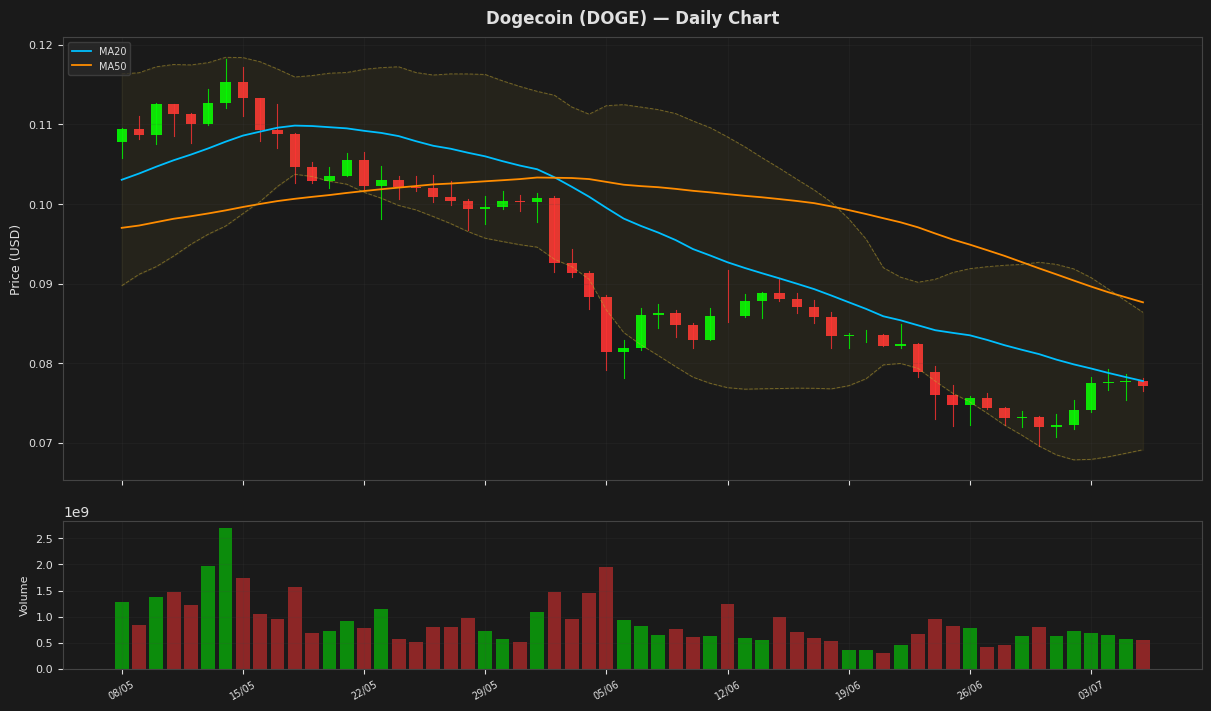
Dogecoin's price is currently at $0.077110, showing a slight decline of 0.80% for the day. The RSI(14) value of 35.996839 indicates that the cryptocurrency is nearing oversold territory, while the MACD is below its signal line, suggesting a bearish trend. The price is also below both the MA20 and MA50, further indicating a downward trend. The Bollinger Bands suggest that the price is relatively low, with the current price closer to the lower band at 0.069129.
Disclaimer
The content on MarketsFN.com is provided for educational and informational purposes only. It does not constitute financial advice or investment recommendations. All investments involve risk. Past performance does not guarantee future results.