Crypto Market Update: BNB, Bitcoin, and Solana Lead the Gains
· Crypto · QuoteReporter
Crypto Market Update: BNB, Bitcoin, and Solana Lead the Gains
Crypto Market Report | August 05, 2026
📊 Crypto Market Overview
The cryptocurrency market is currently experiencing a mixed sentiment, with Bitcoin (BTC) trading at $64,215.05, reflecting a modest gain of 1.19% today. Despite this uptick, Bitcoin's Relative Strength Index (RSI) stands at 38.2, indicating that it is approaching oversold territory, while the Moving Average Convergence Divergence (MACD) is in negative territory at -79.6967, suggesting bearish momentum. Ethereum (ETH) is also seeing slight gains, up 0.65% to $1,870.37, but its RSI of 43.3 indicates a lack of strong buying pressure.
Among the top altcoins, BNB has emerged as a notable performer, increasing by 1.94% to $600.20, with a healthier RSI of 63.7, suggesting it is nearing overbought conditions. In contrast, Ripple (XRP) is down 0.76% to $1.0665, with an RSI of 31.4, indicating significant selling pressure. Solana (SOL) and Dogecoin (DOGE) are also struggling, with SOL up 0.83% but still in a weak position with an RSI of 37.1, while DOGE has dropped 0.40% and has an RSI of 39.8.
The macro context is influenced by various developments, including Taiwan's introduction of a Travel Rule for domestic crypto transfers and Bybit's acquisition of an Austrian e-money license, which could enhance regulatory clarity in the EU. Additionally, discussions around Ethereum's staking mechanisms are gaining traction, with proposals that could significantly alter issuance rates. As the market navigates these developments, technical signals indicate a cautious atmosphere, with many assets remaining under pressure despite some short-term recoveries. Overall, the market is characterized by uncertainty, reflecting broader economic conditions and regulatory developments.
Among the top altcoins, BNB has emerged as a notable performer, increasing by 1.94% to $600.20, with a healthier RSI of 63.7, suggesting it is nearing overbought conditions. In contrast, Ripple (XRP) is down 0.76% to $1.0665, with an RSI of 31.4, indicating significant selling pressure. Solana (SOL) and Dogecoin (DOGE) are also struggling, with SOL up 0.83% but still in a weak position with an RSI of 37.1, while DOGE has dropped 0.40% and has an RSI of 39.8.
The macro context is influenced by various developments, including Taiwan's introduction of a Travel Rule for domestic crypto transfers and Bybit's acquisition of an Austrian e-money license, which could enhance regulatory clarity in the EU. Additionally, discussions around Ethereum's staking mechanisms are gaining traction, with proposals that could significantly alter issuance rates. As the market navigates these developments, technical signals indicate a cautious atmosphere, with many assets remaining under pressure despite some short-term recoveries. Overall, the market is characterized by uncertainty, reflecting broader economic conditions and regulatory developments.
📰 Crypto News
- Taiwan plans Travel Rule for domestic crypto transfers from October
- Missouri trio charged over alleged Bitcoin kidnapping plot
- Cloudflare introduces wallets for AI agents, plans stablecoin payments
- AI credit bubble could fuel Bitcoin ‘crack-up boom’ past $1M: Hayes
- Here’s what happened in crypto today
- CLARITY or not, crypto isn’t going back in the bottle: Bitwise
- Bybit’s EU payments arm secures Austrian e-money license
- Ethereum researchers want to rein in staking; critics say it could backfire
- The worst chart for bitcoin bulls right now
- New Ethereum proposal would cut issuance to zero if staked ETH reaches $112 billion
- "You stole, please return some." Coldcard hacker's wallet becomes a graffiti wall of pleas and hustles
- Bitcoin flat at $64,000 as stocks print records and Hormuz deal nears
- This Bitcoin Bridge Shut Itself Down Because AI Was Finding Bugs Too Fast
- AI Enthusiast Bugs His Toddler's Sleepover and Feeds It to Claude—The Internet Bugs Back
- OpenAI Dumps Apple Employees' Text Messages to Fight Trade Secret Suit
🔍 Technical Analysis
Bitcoin (BTC) — +1.19%
$64,215.05 52W: $57,747.77 — $97,860.60
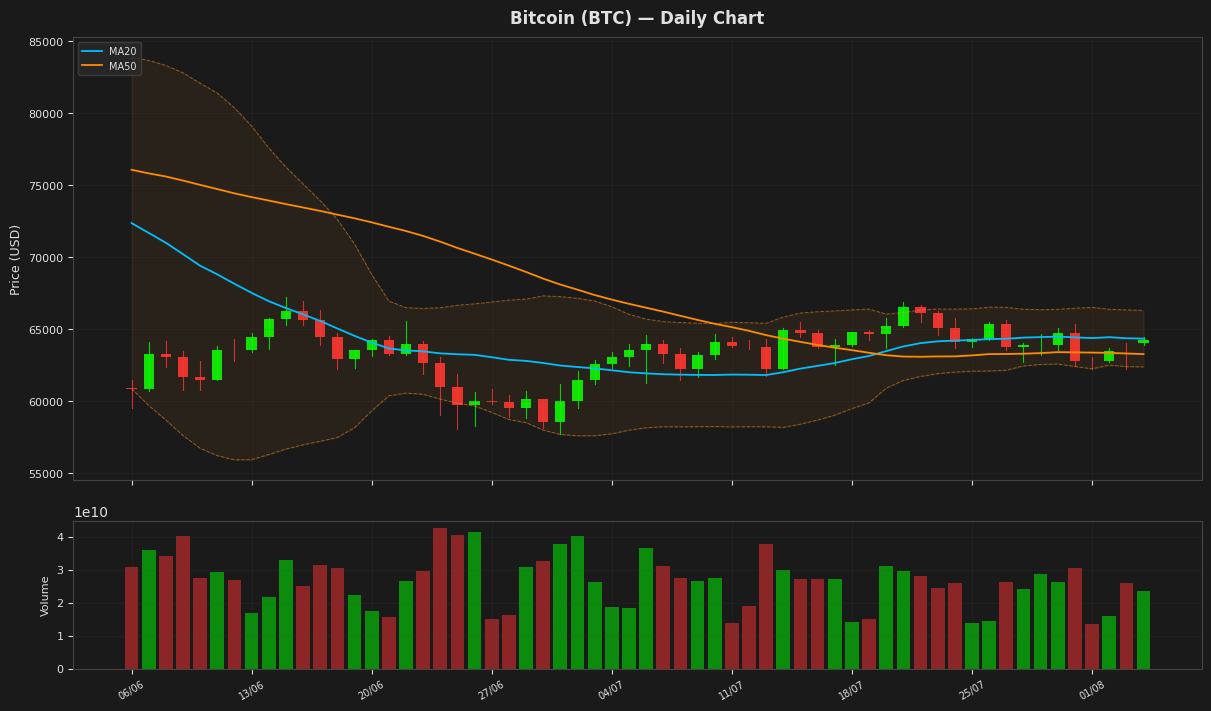
Bitcoin is currently trading at $64,215.05, reflecting a daily increase of 1.19%. The price is above the 20-day moving average (MA20) of $64,338.61 but slightly above the 50-day moving average (MA50) of $63,264.73, indicating a potential bullish trend. The RSI at 38.22 suggests that Bitcoin is nearing oversold conditions, while the MACD remains negative, indicating bearish momentum. The Bollinger Bands show the price is approaching the upper band at $66,298.13, suggesting potential resistance ahead.
Ethereum (ETH) — +0.65%
$1,870.37 52W: $1,506.51 — $3,446.62
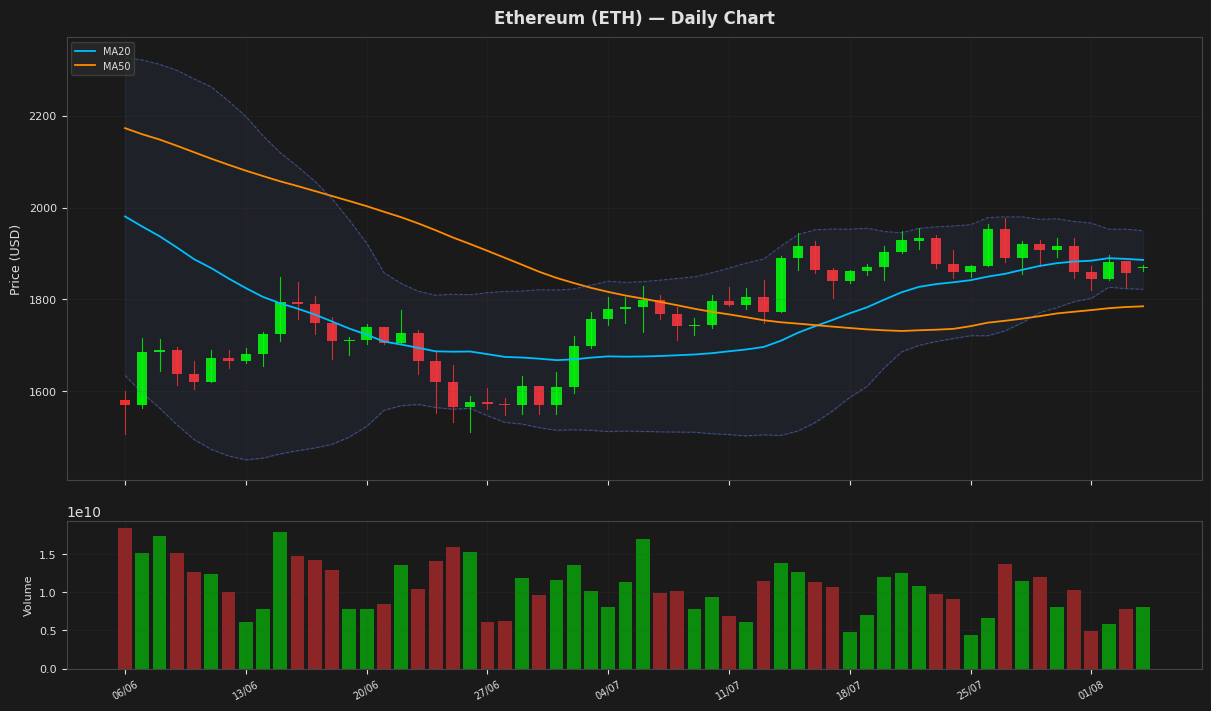
Ethereum is currently trading at $1,870.37, reflecting a modest daily increase of 0.65%. The price is below both the 20-day moving average of $1,885.90 and the 50-day moving average of $1,784.88, indicating a bearish trend in the short to medium term. The RSI at 43.31 suggests that Ethereum is nearing oversold conditions, while the MACD indicates a potential for upward momentum as it remains above the signal line. The Bollinger Bands show a range between $1,822.08 and $1,949.72, suggesting that ETH may be consolidating within this range.
Ripple (XRP) — -0.76%
$1.0665 52W: $1.0098 — $2.4103
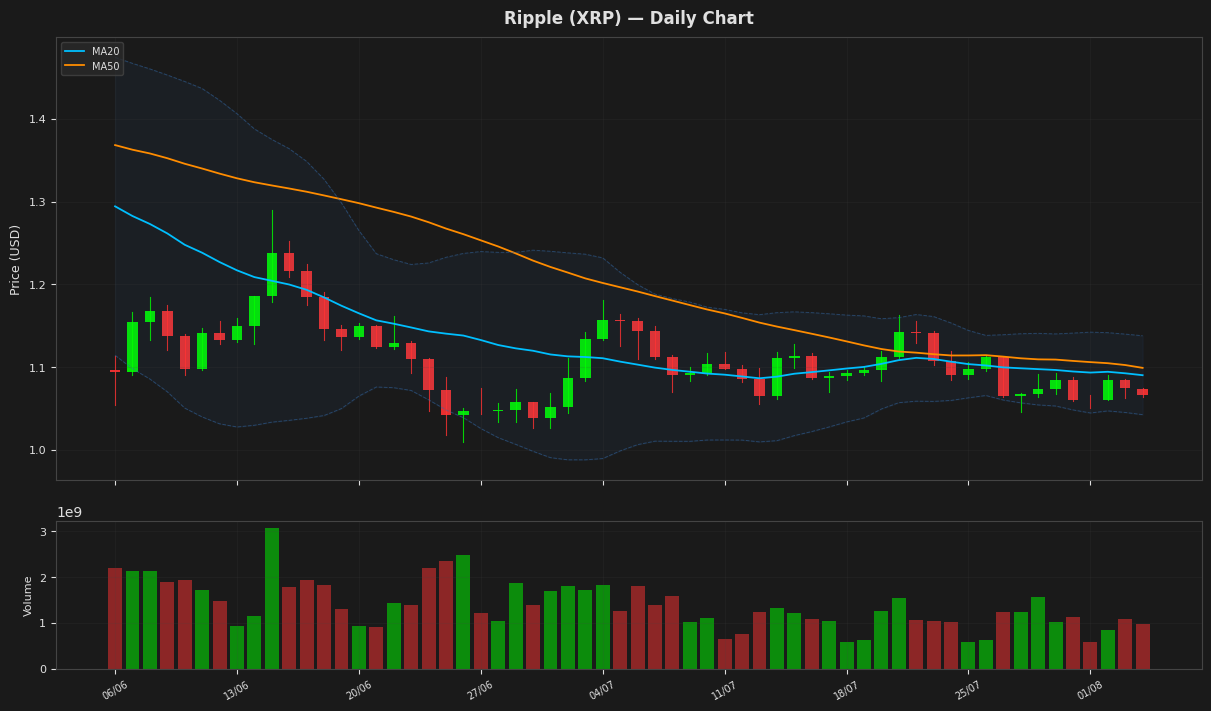
Ripple (XRP) is currently priced at $1.066500, reflecting a daily decline of 0.76%. The price is below both the 20-day moving average (MA20) of 1.090096 and the 50-day moving average (MA50) of 1.098956, indicating a bearish trend. The RSI at 31.41 suggests that XRP is approaching oversold conditions, while the MACD shows a slight bearish momentum. With the price near the lower Bollinger Band at 1.04241, there may be potential for a rebound if buying interest increases.
Solana (SOL) — +0.83%
$74.0800 52W: $60.4147 — $148.2160
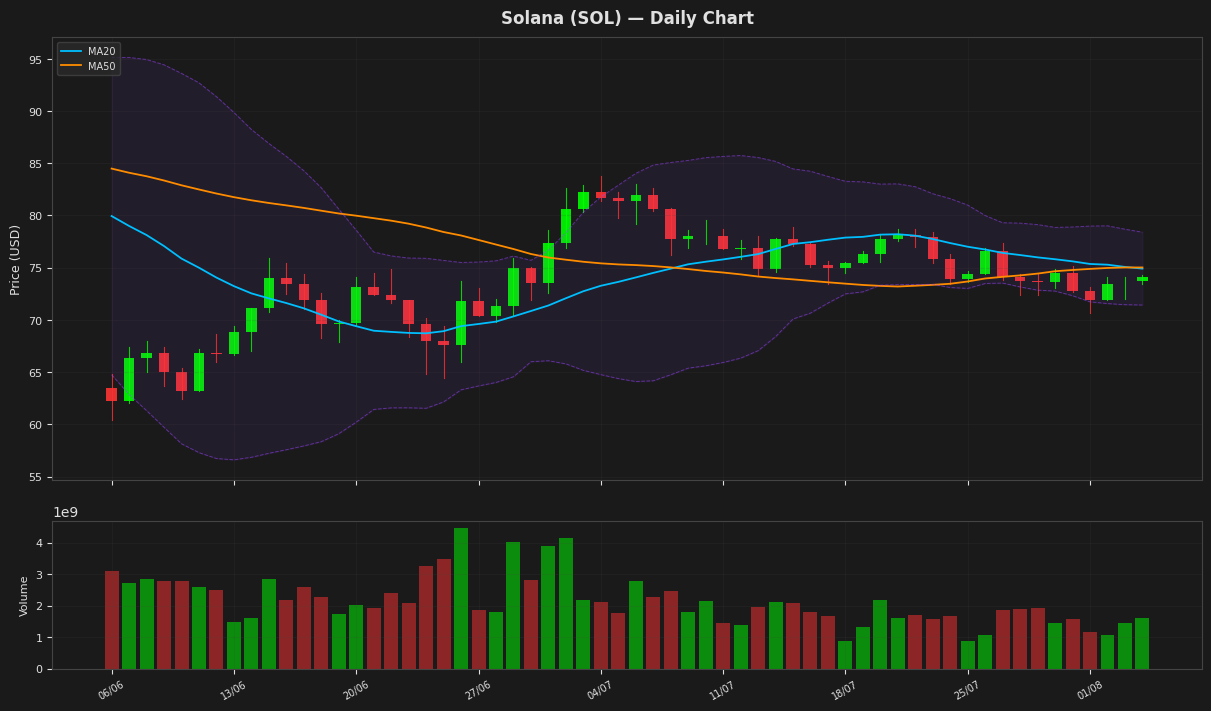
Solana is currently trading at $74.08, showing a slight daily increase of 0.83%. The price is below both the 20-day and 50-day moving averages, indicating a bearish trend. The RSI at 37.12 suggests that the asset is approaching oversold conditions, while the MACD remains negative, signaling continued downward momentum. The Bollinger Bands indicate a potential range between $71.43 and $78.40, with the price currently closer to the lower band, highlighting the risk of further declines.
BNB (BNB) — +1.94%
$600.2000 52W: $538.5992 — $954.8583
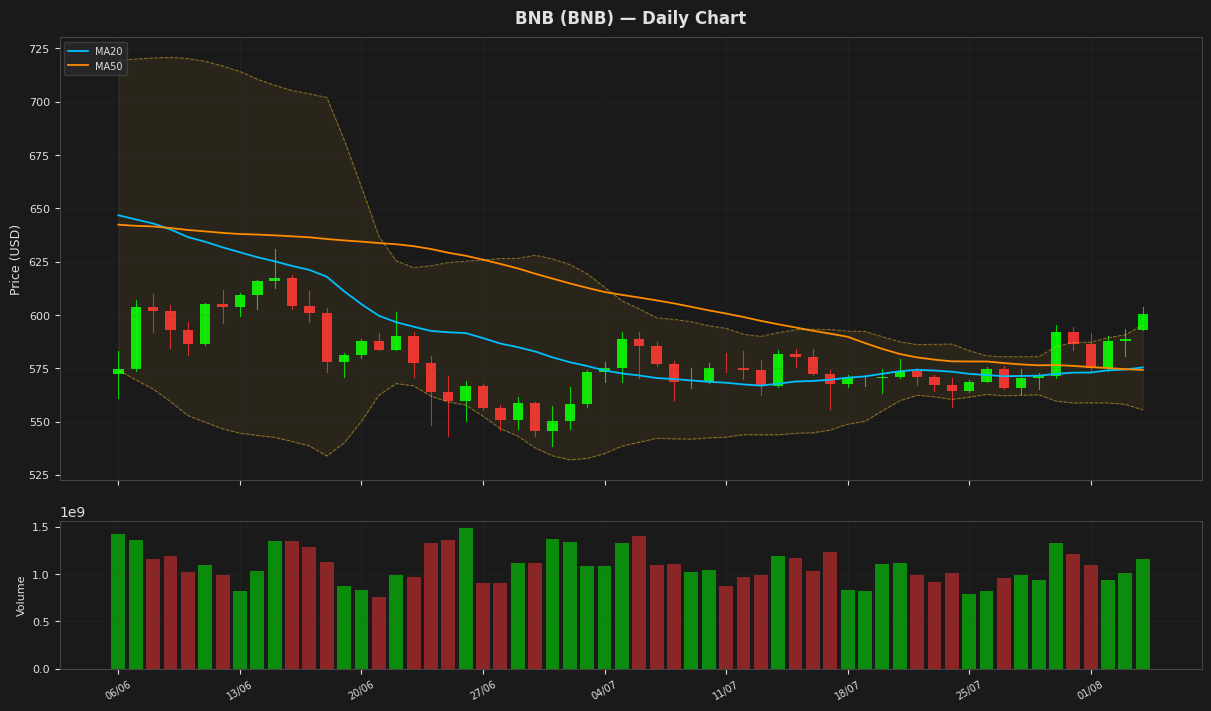
BNB is currently trading at $600.20, reflecting a daily increase of 1.94%. The price is above both the 20-day moving average (MA20) of $575.38 and the 50-day moving average (MA50) of $574.19, indicating a bullish trend. The RSI at 63.74 suggests that BNB is nearing overbought territory, while the MACD shows a positive momentum with a value of 3.81. The price is approaching the upper Bollinger Band at $595.29, which may act as a resistance level.
Tron (TRX) — -0.43%
$0.327108 52W: $0.268138 — $0.376332
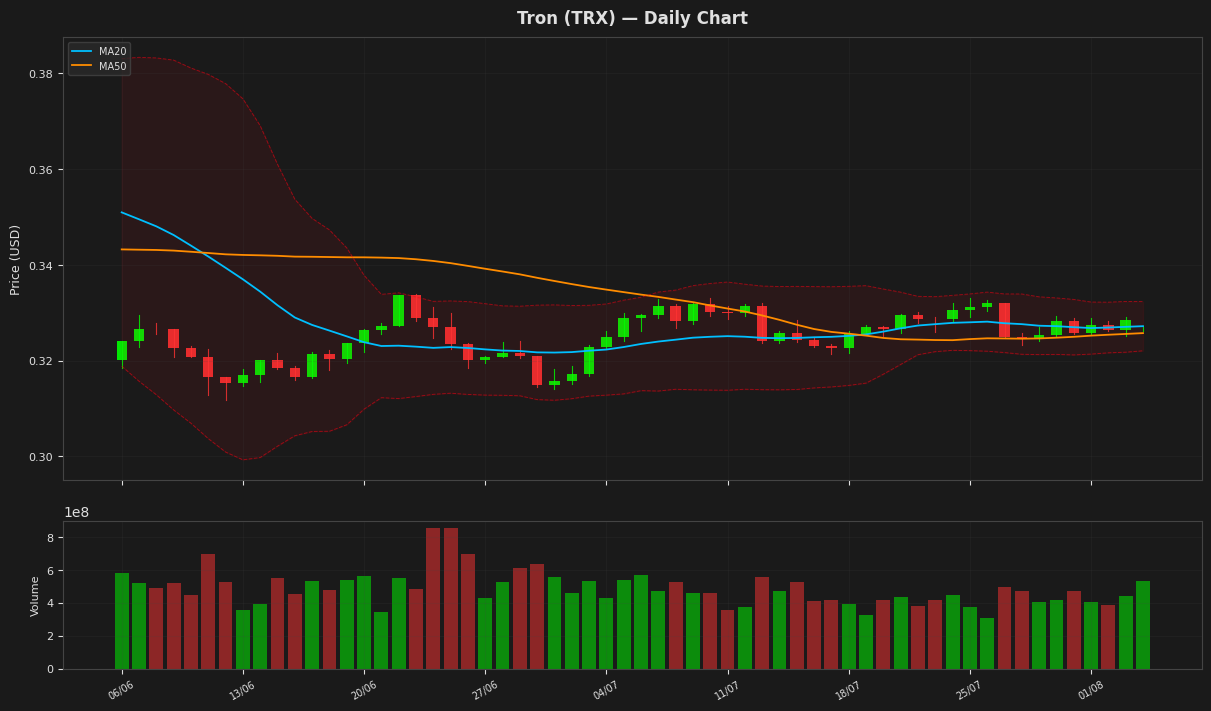
Tron (TRX) is currently trading at $0.327108, reflecting a slight daily decline of 0.43%. The price is positioned just above the 20-day moving average of 0.327193 and the 50-day moving average of 0.325744, indicating potential support around these levels. The Relative Strength Index (RSI) at 45.29 suggests that TRX is neither overbought nor oversold, while the MACD shows a slight bullish momentum. With Bollinger Bands indicating a range between 0.32205 and 0.332335, TRX is likely to experience volatility within this channel in the near term.
Dogecoin (DOGE) — -0.40%
$0.069860 52W: $0.067973 — $0.156602
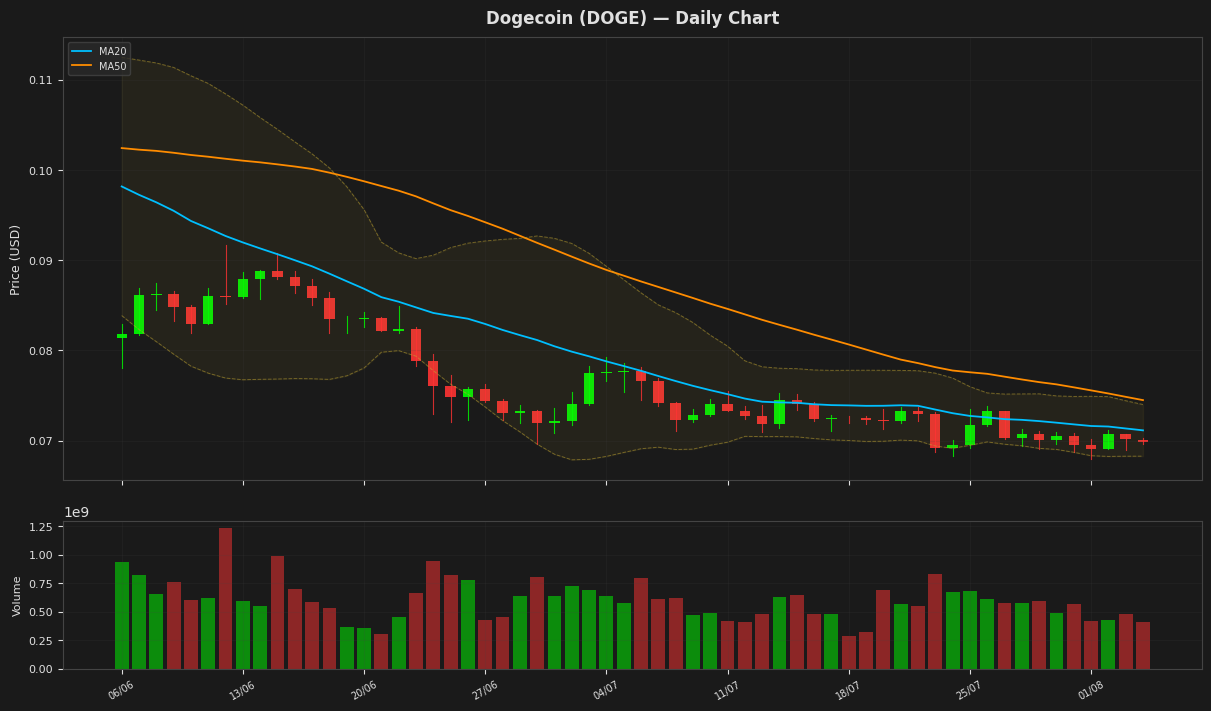
Dogecoin is currently trading at $0.069860, reflecting a slight daily decline of 0.40%. The price is below both the 20-day moving average (MA20) of $0.071131 and the 50-day moving average (MA50) of $0.074482, indicating bearish momentum. The RSI is at 39.79, suggesting that Dogecoin is approaching oversold conditions, while the MACD remains negative, signaling continued downward pressure. With the price near the lower Bollinger Band at $0.068268, a potential support level is evident, but if it breaks below this, further declines could be expected.
Disclaimer
The content on MarketsFN.com is provided for educational and informational purposes only. It does not constitute financial advice or investment recommendations. All investments involve risk. Past performance does not guarantee future results.