Gold: Down 0.2% to $4071.10 — Testing 61.8% Fibonacci Support
· Commodities · QuoteReporter
Gold: Down 0.2% to $4071.10 — Testing 61.8% Fibonacci Support
Analysis Date: June 29, 2026
📊 Current Market Data
CURRENT PRICE
$4071.10
DAILY CHANGE
-0.19%
WEEKLY CHANGE
-2.65%
52W HIGH
$5586.20
52W LOW
$3262.00
💡 Key Market Factors
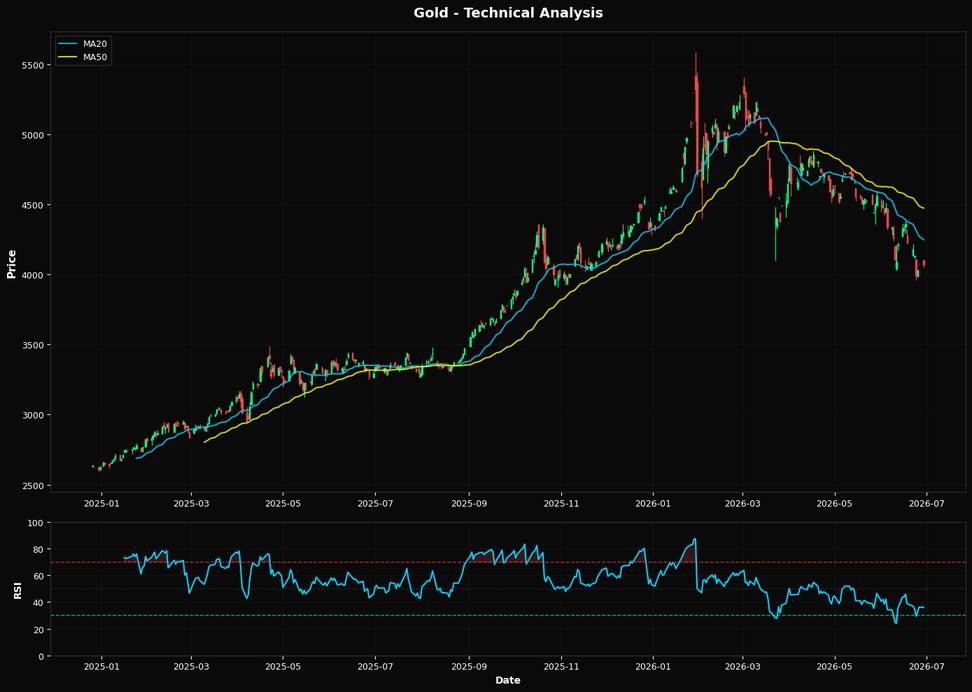
Gold's current price of $4071.10, down 0.19% daily and 2.65% weekly, suggests that the market is underpricing the impact of a strengthening U.S. dollar. The USD's appreciation is the most critical macro driver for gold right now, as it directly affects the metal's appeal as a safe-haven asset. With the Federal Reserve maintaining a hawkish stance on interest rates to combat persistent inflation, the dollar is likely to remain strong. This dynamic exerts downward pressure on gold prices, as a stronger dollar makes gold more expensive for foreign buyers, reducing demand. From a technical perspective, gold's RSI of 35.9 indicates that it is approaching oversold territory, suggesting potential for a rebound. However, the price is significantly below its 20-day moving average of $4247.38, the 50-day moving average of $4473.81, and the 200-day moving average of $4450.34. This bearish alignment of moving averages underscores a strong downward trend. The nearest Fibonacci support level at 61.8% is $4151.02, which gold is currently trading below, further reinforcing the bearish outlook. The technical indicators collectively suggest a continuation of the downward trend unless a significant catalyst emerges. The key risk or catalyst that could alter this bearish scenario is a shift in Federal Reserve policy. If upcoming economic data, such as employment figures or inflation reports, indicate a cooling economy, the Fed might pivot to a more dovish stance. This could weaken the dollar and provide relief to gold prices. Conversely, stronger-than-expected economic data could reinforce the Fed's current policy, exacerbating gold's decline. Looking forward, the next Federal Reserve meeting and subsequent policy statement will be crucial in confirming or invalidating this view. Any indication of a policy shift could dramatically alter the current bearish sentiment in the gold market. Investors should closely monitor the Fed's language for signs of a potential pivot, as this would likely trigger a significant revaluation of gold's price trajectory.📈 Technical Indicators Summary
RSI (14)
35.9
50-Day MA
$4473.81
200-Day MA
$4450.34
Fib Level
61.8%
📊 Technical Analysis Chart (18-Month View)
📐 Fibonacci Retracement Analysis
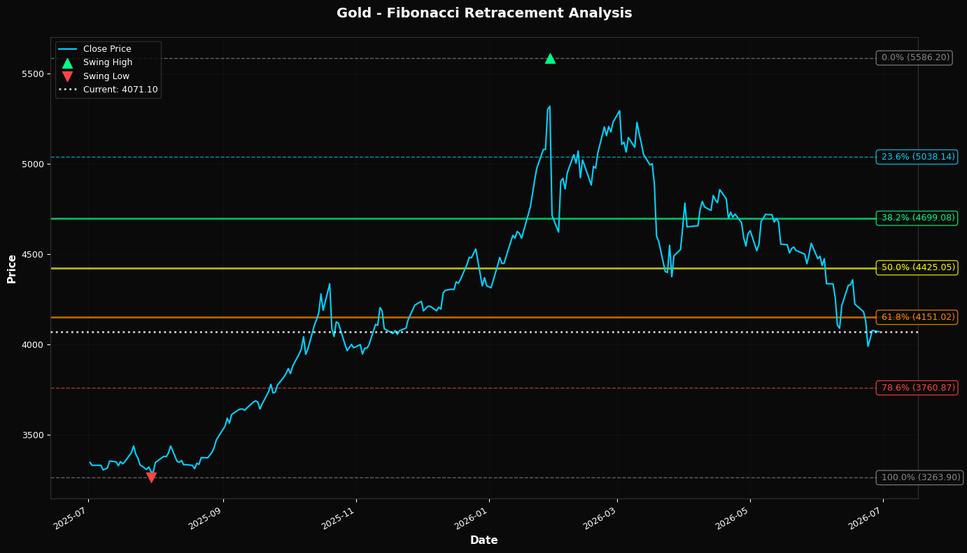
🎯 Key Trading Levels
Key Fibonacci Levels:
- 38.2%: $4699.08
- 50.0%: $4425.05
- 61.8%: $4151.02
Support: $3263.90 (Swing Low), $4473.81 (50-Day MA)
Resistance: $5586.20 (Swing High)
Disclaimer
The content on MarketsFN.com is provided for educational and informational purposes only. It does not constitute financial advice, investment recommendations, or trading guidance. All investments involve risks, and past performance does not guarantee future results. You are solely responsible for your investment decisions and should conduct independent research and consult a qualified financial advisor before acting. MarketsFN.com and its authors are not liable for any losses or damages arising from your use of this information.