Silver: Up 0.0% to $59.22 — Below MA50 ($73.19) — Caution
· Commodities · QuoteReporter
Silver: Up 0.0% to $59.22 — Below MA50 ($73.19) — Caution
Analysis Date: June 29, 2026
📊 Current Market Data
CURRENT PRICE
$59.22
DAILY CHANGE
+0.01%
WEEKLY CHANGE
-9.62%
52W HIGH
$121.30
52W LOW
$35.27
💡 Key Market Factors
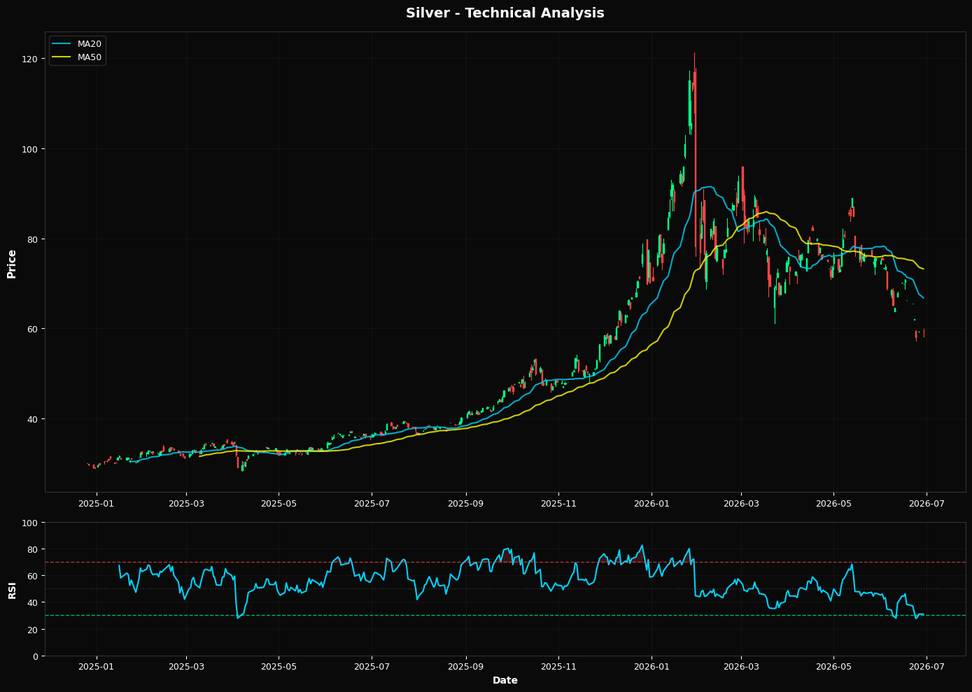
Silver's current price action suggests a potential rebound opportunity, driven by its deeply oversold technical condition. With the Relative Strength Index (RSI) at 30.9, silver is teetering on the edge of being oversold, indicating a possible reversal or at least a pause in the recent downtrend. The price of $59.22 is significantly below its 20-day moving average of $66.78 and the 200-day moving average of $68.35, underscoring the extent of its recent decline. The proximity to the 61.8% Fibonacci retracement level at $68.57 suggests a critical support zone that could attract buying interest. This technical setup implies a potential upside, especially if silver can stabilize above this Fibonacci level. The most pressing macro driver for silver right now is the strength of the U.S. dollar. A strong dollar typically exerts downward pressure on silver prices, as it makes the metal more expensive for holders of other currencies. However, if the Federal Reserve signals a pause or slowdown in rate hikes, this could weaken the dollar and provide a tailwind for silver. Given the metal's recent 9.62% weekly decline, any dovish shift in Fed policy could catalyze a significant recovery. The market may be underpricing the potential for such a policy pivot, especially if upcoming inflation data shows signs of cooling. A key risk to this outlook is the upcoming U.S. inflation report. Should inflation remain stubbornly high, it could reinforce the Fed's hawkish stance, strengthening the dollar further and putting additional pressure on silver. Conversely, a softer-than-expected inflation print could validate a bullish thesis for silver, as it would likely lead to a repricing of rate hike expectations and a weaker dollar. This inflation data will be crucial in determining whether silver can break above its current technical resistance levels and sustain a recovery. In conclusion, the next U.S. inflation report is the pivotal event to watch. A lower-than-expected inflation figure could confirm a bullish reversal for silver, aligning with its oversold technical indicators and potential support at the Fibonacci level. Conversely, persistently high inflation could invalidate this view, reinforcing the downtrend. Investors should closely monitor this data point, as it will likely dictate the near-term direction for silver prices.📈 Technical Indicators Summary
RSI (14)
30.9
50-Day MA
$73.19
200-Day MA
$68.35
Fib Level
61.8%
📊 Technical Analysis Chart (18-Month View)
📐 Fibonacci Retracement Analysis
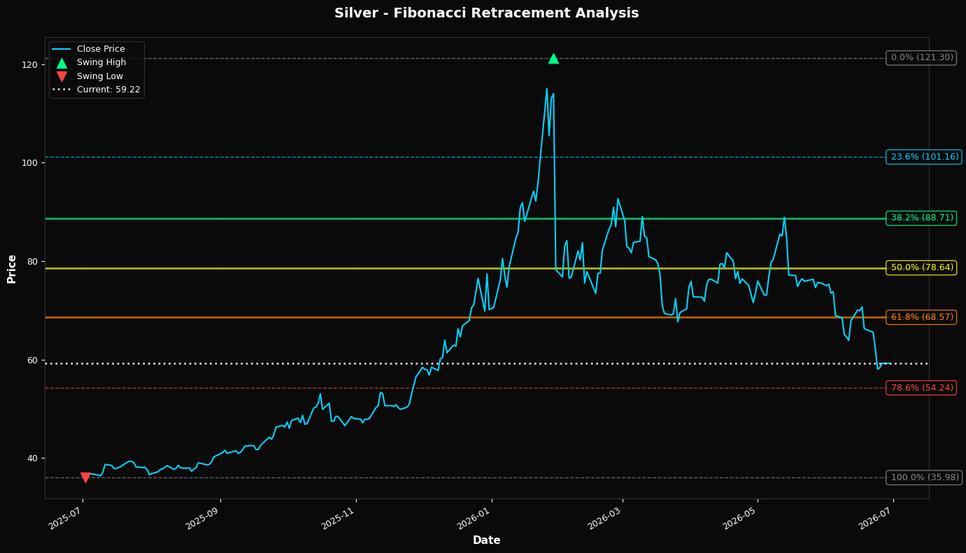
🎯 Key Trading Levels
Key Fibonacci Levels:
- 38.2%: $88.71
- 50.0%: $78.64
- 61.8%: $68.57
Support: $35.98 (Swing Low), $73.19 (50-Day MA)
Resistance: $121.30 (Swing High)
Disclaimer
The content on MarketsFN.com is provided for educational and informational purposes only. It does not constitute financial advice, investment recommendations, or trading guidance. All investments involve risks, and past performance does not guarantee future results. You are solely responsible for your investment decisions and should conduct independent research and consult a qualified financial advisor before acting. MarketsFN.com and its authors are not liable for any losses or damages arising from your use of this information.