Gold: Down 0.4% to $4521.70 — Below MA50 ($4668.88) — Caution
· Commodities · QuoteReporter
Gold: Down 0.4% to $4521.70 — Below MA50 ($4668.88) — Caution
Analysis Date: May 22, 2026
📊 Current Market Data
CURRENT PRICE
$4521.70
DAILY CHANGE
-0.40%
WEEKLY CHANGE
-0.75%
52W HIGH
$5586.20
52W LOW
$3242.40
💡 Key Market Factors
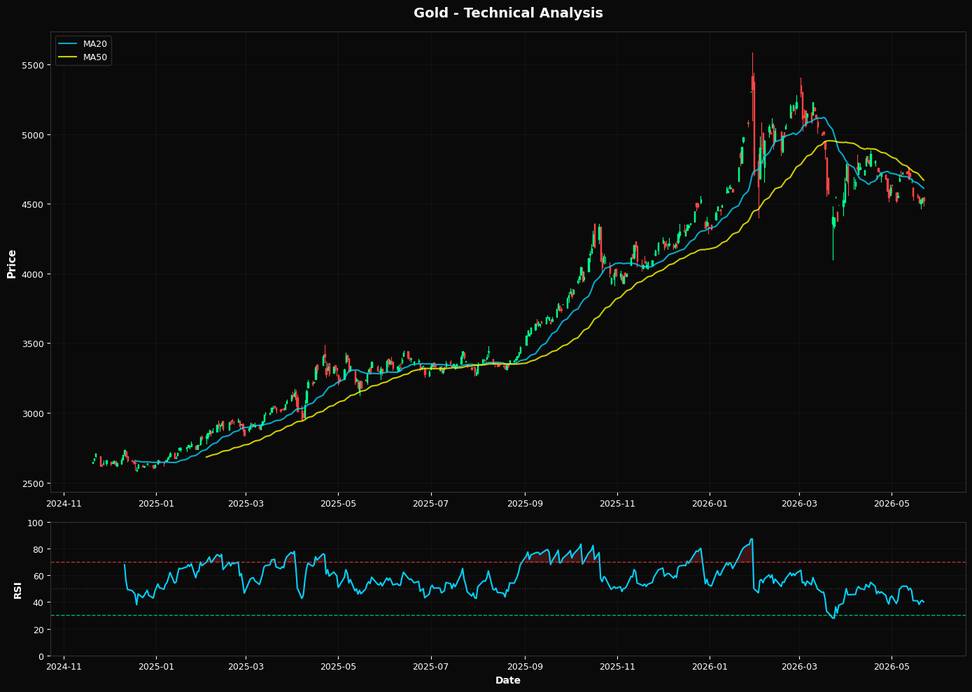
Gold's current price action suggests a bearish outlook, with the most pressing macro driver being the strength of the U.S. dollar. As gold is priced in dollars, a stronger USD typically exerts downward pressure on gold prices. Given the current price of $4521.70, which is down 0.40% daily and 0.75% weekly, the market appears to be reacting to expectations of continued Federal Reserve hawkishness. The Fed's commitment to maintaining higher interest rates to combat inflation strengthens the dollar, making gold less attractive as a non-yielding asset. This dynamic is crucial, as it directly impacts gold's appeal as a hedge against inflation and currency devaluation. From a technical perspective, gold's Relative Strength Index (RSI) of 40.0 indicates that it is approaching oversold territory, but not quite there yet. The price is currently below both the 20-day moving average ($4610.68) and the 50-day moving average ($4668.88), suggesting a bearish trend. However, it remains above the 200-day moving average ($4348.52), which could act as a longer-term support level. The nearest Fibonacci support at the 50.0% retracement level of $4414.30 is crucial; a breach below this could signal further downside. The technical setup, combined with macroeconomic pressures, suggests a bearish bias unless gold can reclaim and sustain levels above its short-term moving averages. A key risk that could alter this bearish outlook is a sudden shift in Federal Reserve policy or unexpected economic data that significantly weakens the dollar. For instance, if upcoming inflation data shows a sharper-than-expected decline, it could prompt the Fed to reconsider its rate hike trajectory, potentially weakening the dollar and providing a boost to gold prices. Conversely, stronger-than-expected economic data could reinforce the Fed's current stance, further pressuring gold. The upcoming release of U.S. inflation data will be pivotal in confirming or invalidating this view. Should the data indicate a cooling inflationary environment, it could lead to a reassessment of the Fed's policy path, potentially weakening the dollar and providing a tailwind for gold. Conversely, persistent inflationary pressures would likely reinforce the current bearish trend, as the Fed would be more inclined to maintain its hawkish stance, keeping the dollar strong and gold under pressure.📈 Technical Indicators Summary
RSI (14)
40.0
50-Day MA
$4668.88
200-Day MA
$4348.52
Fib Level
50.0%
📊 Technical Analysis Chart (18-Month View)
📐 Fibonacci Retracement Analysis
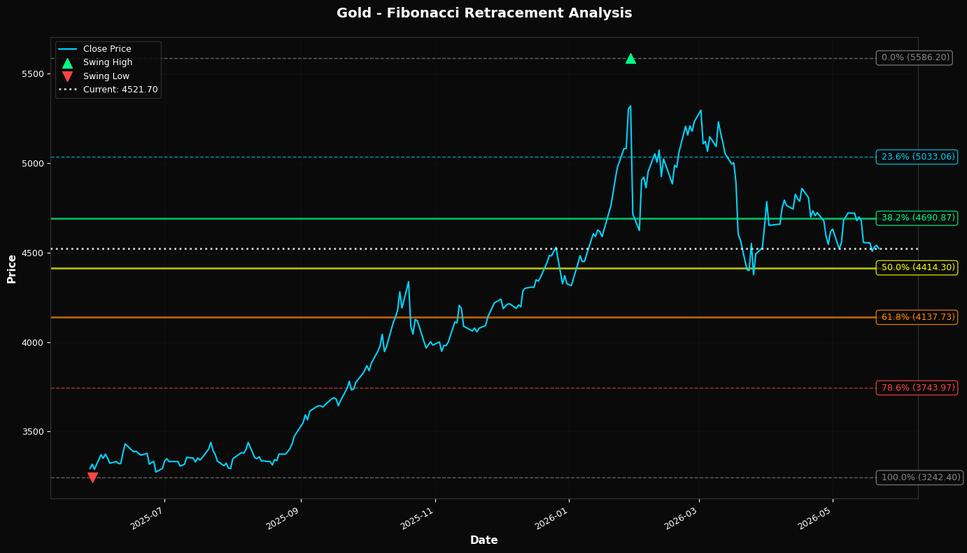
🎯 Key Trading Levels
Key Fibonacci Levels:
- 38.2%: $4690.87
- 50.0%: $4414.30
- 61.8%: $4137.73
Support: $3242.40 (Swing Low), $4668.88 (50-Day MA)
Resistance: $5586.20 (Swing High)
Disclaimer
The content on MarketsFN.com is provided for educational and informational purposes only. It does not constitute financial advice, investment recommendations, or trading guidance. All investments involve risks, and past performance does not guarantee future results. You are solely responsible for your investment decisions and should conduct independent research and consult a qualified financial advisor before acting. MarketsFN.com and its authors are not liable for any losses or damages arising from your use of this information.