Palladium: Down 1.7% to $1360.00 — Bearish — Below MA50 & MA200
· Commodities · QuoteReporter
Palladium: Down 1.7% to $1360.00 — Bearish — Below MA50 & MA200
Analysis Date: May 22, 2026
📊 Current Market Data
CURRENT PRICE
$1360.00
DAILY CHANGE
-1.69%
WEEKLY CHANGE
-4.42%
52W HIGH
$2169.90
52W LOW
$957.00
💡 Key Market Factors
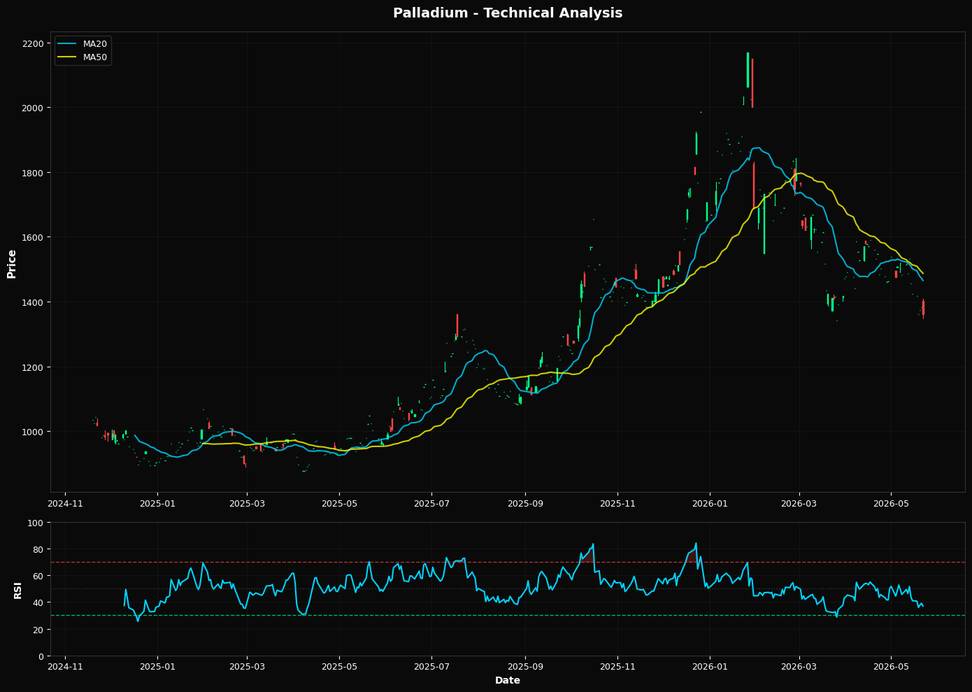
Palladium's current price weakness, with a daily decline of -1.69% and a weekly drop of -4.42%, underscores a critical macroeconomic driver: the strength of the U.S. dollar. As palladium is priced in dollars, a stronger USD makes it more expensive for foreign buyers, dampening demand. Given the Federal Reserve's hawkish stance on interest rates to combat persistent inflation, the dollar's strength is likely to persist, exerting continued downward pressure on palladium prices. This dynamic is crucial as it directly impacts the affordability and attractiveness of palladium on the global market, potentially leading to further price declines. From a technical perspective, palladium's Relative Strength Index (RSI) of 37.0 suggests it is approaching oversold territory, which could indicate a potential for a short-term rebound. However, the price is trading significantly below its 20-day, 50-day, and 200-day moving averages ($1464.98, $1487.15, and $1497.33, respectively), highlighting a strong bearish trend. The nearest Fibonacci support level at 61.8% is $1420.33, which palladium is currently trading below, further reinforcing the bearish outlook. The convergence of these technical indicators suggests a continued downward bias unless a significant catalyst emerges to alter the current trajectory. A key risk that could shift the palladium market is a change in automotive demand, particularly from the Chinese market, which is a major consumer of palladium for catalytic converters. Any significant policy shift or economic stimulus from China that boosts automotive production could increase palladium demand, providing a potential upside catalyst. Conversely, further economic slowdown or regulatory changes reducing palladium usage could exacerbate the current bearish trend. Looking ahead, the upcoming U.S. inflation data release will be pivotal. Should inflationary pressures ease, it could lead to a softer stance from the Federal Reserve, potentially weakening the dollar and providing some relief to palladium prices. Conversely, persistently high inflation could reinforce the Fed's hawkish policy, maintaining dollar strength and continuing to weigh on palladium. This data point will be critical in confirming or invalidating the current bearish outlook for palladium.📈 Technical Indicators Summary
RSI (14)
37.0
50-Day MA
$1487.15
200-Day MA
$1497.33
Fib Level
61.8%
📊 Technical Analysis Chart (18-Month View)
📐 Fibonacci Retracement Analysis
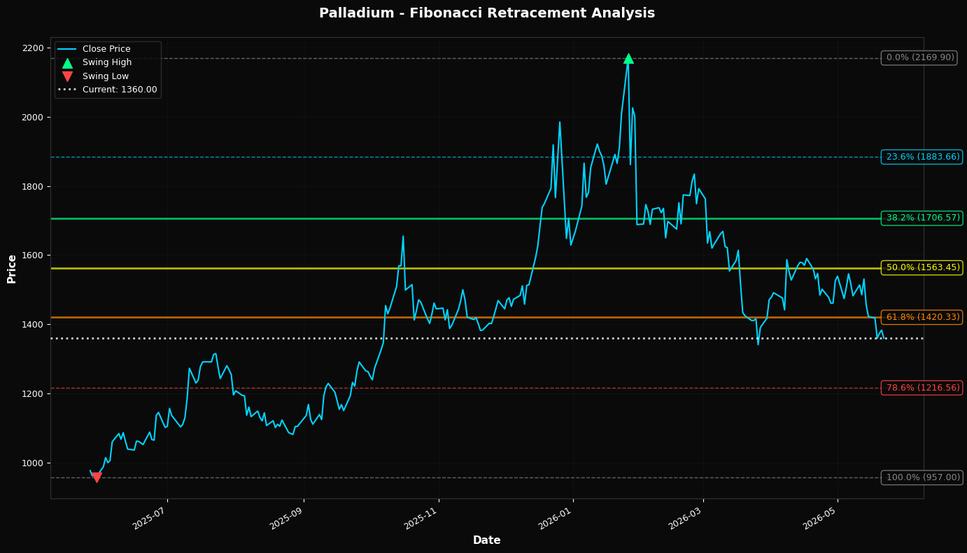
🎯 Key Trading Levels
Key Fibonacci Levels:
- 38.2%: $1706.57
- 50.0%: $1563.45
- 61.8%: $1420.33
Support: $957.00 (Swing Low), $1487.15 (50-Day MA)
Resistance: $2169.90 (Swing High)
Disclaimer
The content on MarketsFN.com is provided for educational and informational purposes only. It does not constitute financial advice, investment recommendations, or trading guidance. All investments involve risks, and past performance does not guarantee future results. You are solely responsible for your investment decisions and should conduct independent research and consult a qualified financial advisor before acting. MarketsFN.com and its authors are not liable for any losses or damages arising from your use of this information.