Gold Declines 0.7% near 50.0% Fibonacci resistance
· Commodities · QuoteReporter
Gold Declines 0.7% near 50.0% Fibonacci resistance
Analysis Date: May 21, 2026
📊 Current Market Data
CURRENT PRICE
$4499.10
DAILY CHANGE
-0.71%
WEEKLY CHANGE
-3.83%
52W HIGH
$5586.20
52W LOW
$3242.40
💡 Key Market Factors
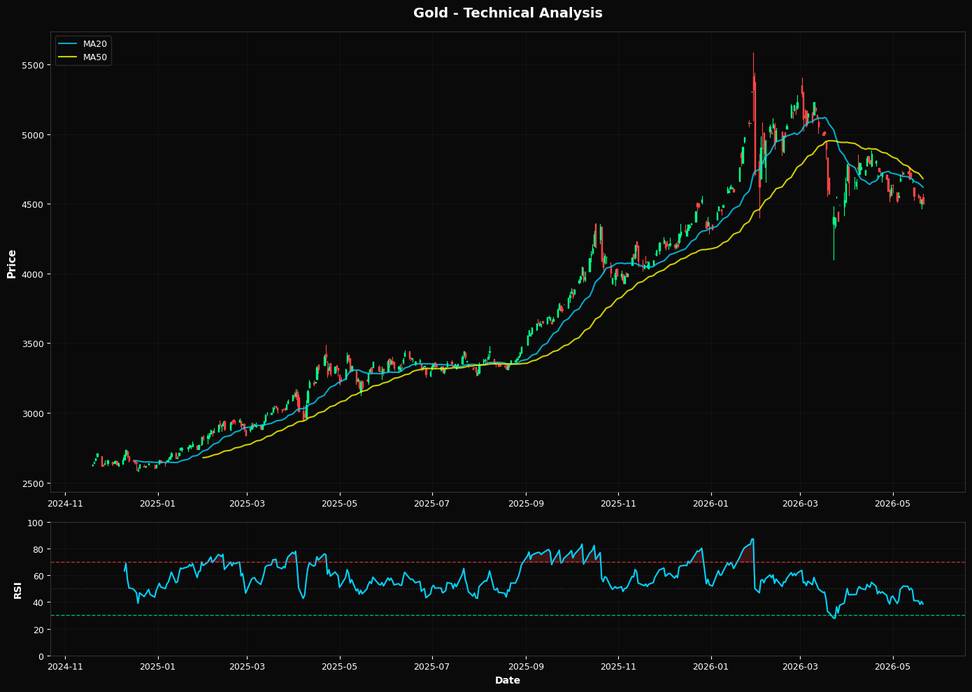
Gold prices have recently experienced a decline, with a daily drop of 0.71% and a weekly decrease of 3.83%. This downward trend can be partly attributed to the U.S. Federal Reserve's hawkish stance on interest rates. The Fed's commitment to maintaining higher rates to combat inflation has strengthened the U.S. dollar, which typically exerts downward pressure on gold prices as it becomes more expensive for holders of other currencies. From a technical perspective, gold's Relative Strength Index (RSI) is currently at 38.5, indicating that the commodity is approaching oversold territory. This suggests potential for a short-term rebound. However, the current price is below both the 20-day moving average ($4618.67) and the 50-day moving average ($4679.95), signaling a bearish trend in the medium term. The nearest Fibonacci retracement level at 50.0% is at $4414.30, which could serve as a potential support level if the decline continues. Geopolitical tensions, while present, have not significantly impacted gold prices in the immediate term. However, any escalation in major geopolitical events could alter investor sentiment, potentially increasing demand for gold as a safe-haven asset. For now, the primary focus remains on the interplay between U.S. monetary policy and inflationary pressures, which are key drivers of gold's current price trajectory.📈 Technical Indicators Summary
RSI (14)
38.5
50-Day MA
$4679.95
200-Day MA
$4342.61
Fib Level
50.0%
📊 Technical Analysis Chart (18-Month View)
📐 Fibonacci Retracement Analysis
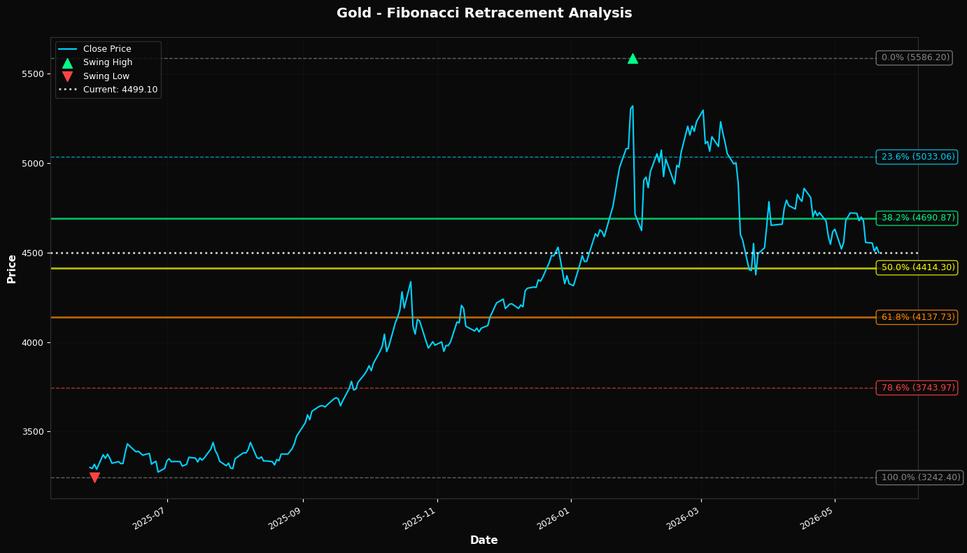
🎯 Key Trading Levels
Key Fibonacci Levels:
- 38.2%: $4690.87
- 50.0%: $4414.30
- 61.8%: $4137.73
Support: $3242.40 (Swing Low), $4679.95 (50-Day MA)
Resistance: $5586.20 (Swing High)
Disclaimer
The content on MarketsFN.com is provided for educational and informational purposes only. It does not constitute financial advice, investment recommendations, or trading guidance. All investments involve risks, and past performance does not guarantee future results. You are solely responsible for your investment decisions and should conduct independent research and consult a qualified financial advisor before acting. MarketsFN.com and its authors are not liable for any losses or damages arising from your use of this information.